CA Event Expected-Move Map v1
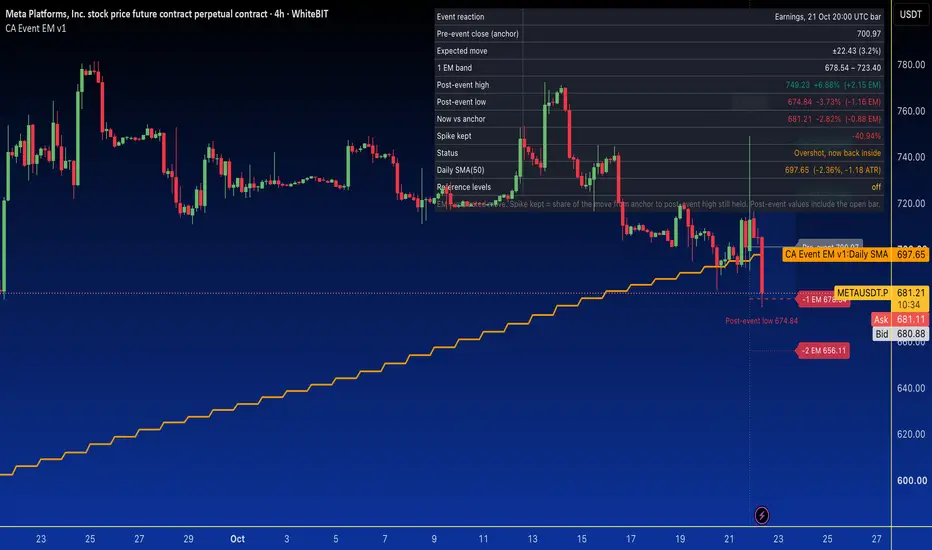
This indicator measures how price actually reacted to a scheduled event, such as an earnings release or a macro print, compared with the move the market expected beforehand.
How it works
• Anchor: the close of the last bar before the event bar. Nothing from after the event is used to set it.
• Expected move (EM): either a manual percentage (for example the options-implied move quoted before the event) or a multiple of the previous day's daily ATR.
• Bands: ±1 EM (shaded) and optional ±2 EM lines drawn from the event bar forward.
• Reaction: the post-event high, low and current close, shown in percent and in EM multiples.
• Spike kept: how much of the move from the anchor to the post-event high is still held.
• Context: a daily SMA (default 50) taken from the previous completed daily bar, so it does not repaint.
• Optional reference levels: two manual inputs (0 = off) for any upside or downside levels you want to track.
The table summarises the anchor, expected move, post-event extremes, current position, status (above, below, inside, or overshot and back inside the expected move) and distance to the daily SMA.
How to use it
1. Set "Event time" to the release time and rename the event label.
2. Enter the expected move in percent, or switch to "Daily ATR multiple" if you have no implied-move figure.
3. Read the result: a move beyond 1 EM that has since returned inside the band means the market faded the news, while a close holding outside the band shows the reaction was accepted.
Notes
• Works on any symbol and timeframe. On intraday charts the event bar is the bar containing the release time, so bar boundaries matter.
• On instruments that trade around the clock, the pre-event close will differ from the exchange session close.
• Post-event values include the current, still-open bar.
• It tracks one event at a time and produces no buy or sell signals.
This is an educational tool, not financial advice. Test it and adjust the inputs before relying on it.
How it works
• Anchor: the close of the last bar before the event bar. Nothing from after the event is used to set it.
• Expected move (EM): either a manual percentage (for example the options-implied move quoted before the event) or a multiple of the previous day's daily ATR.
• Bands: ±1 EM (shaded) and optional ±2 EM lines drawn from the event bar forward.
• Reaction: the post-event high, low and current close, shown in percent and in EM multiples.
• Spike kept: how much of the move from the anchor to the post-event high is still held.
• Context: a daily SMA (default 50) taken from the previous completed daily bar, so it does not repaint.
• Optional reference levels: two manual inputs (0 = off) for any upside or downside levels you want to track.
The table summarises the anchor, expected move, post-event extremes, current position, status (above, below, inside, or overshot and back inside the expected move) and distance to the daily SMA.
How to use it
1. Set "Event time" to the release time and rename the event label.
2. Enter the expected move in percent, or switch to "Daily ATR multiple" if you have no implied-move figure.
3. Read the result: a move beyond 1 EM that has since returned inside the band means the market faded the news, while a close holding outside the band shows the reaction was accepted.
Notes
• Works on any symbol and timeframe. On intraday charts the event bar is the bar containing the release time, so bar boundaries matter.
• On instruments that trade around the clock, the pre-event close will differ from the exchange session close.
• Post-event values include the current, still-open bar.
• It tracks one event at a time and produces no buy or sell signals.
This is an educational tool, not financial advice. Test it and adjust the inputs before relying on it.

Disclaimer
The information and publications are not meant to be, and do not constitute, financial, investment, trading, or other types of advice or recommendations supplied or endorsed by TradingView. Read more in the Terms of Use.
Disclaimer
The information and publications are not meant to be, and do not constitute, financial, investment, trading, or other types of advice or recommendations supplied or endorsed by TradingView. Read more in the Terms of Use.