Volume Nodes [Quanty]
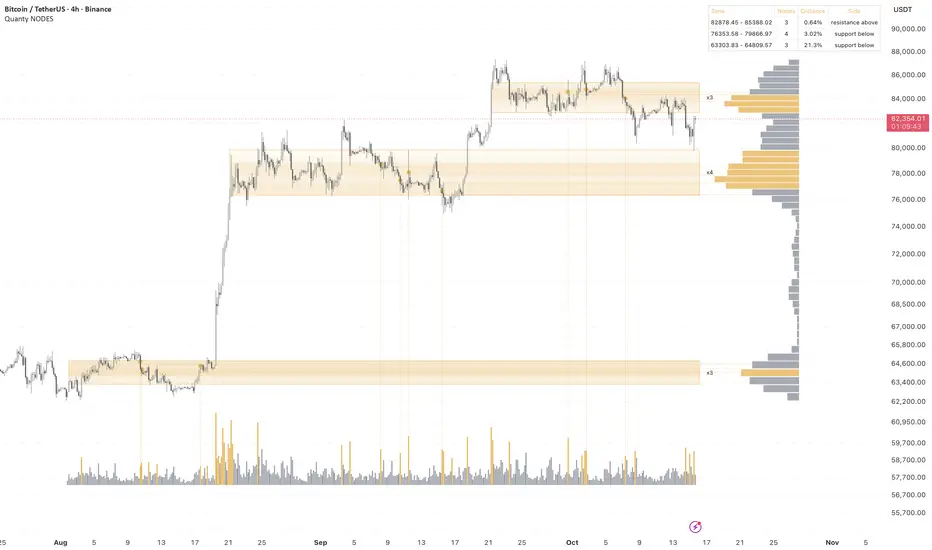
Volume Nodes marks the price zones where trading volume piled up, using two views of the same volume at once.
Horizontal: a volume profile of the window (the last 450 candles by default, or as many as the chart has loaded) on the right of the chart; its densest rows are highlighted.
Vertical: each candle's volume at the bottom, for up to the last 450 candles; heavy candles (2x the average of the previous 50) are highlighted.
A node is a heavy candle whose typical price sat in the densest rows of the profile of the 200 candles before it (adjustable). Thin dotted lines join the newest nodes to their volume column and to their profile row.
Zones are the price rows that are dense in the profile or hold a cluster of nodes. Shading is a gradient: the more nodes around a row, the darker it is. The label shows how many nodes sit inside a zone. The table lists the zones nearest to price, their distance and whether they sit above or below it.
How we checked: we tested single node levels as a fixed rule against random levels, and they did not hold more often than chance. So this is a map of where volume sat, not a signal. Zones that hold and zones that break are both common.
Settings: window length, node search window, volume average, heavy-volume multiple, profile rows, share of dense rows, profile width and gap, colours, zones on or off, table on or off.
Nodes are found on closed candles and do not repaint; the profile and the zones include the forming candle and update with it. On forex and CFDs the volume is tick volume.
Data, not advice.
Horizontal: a volume profile of the window (the last 450 candles by default, or as many as the chart has loaded) on the right of the chart; its densest rows are highlighted.
Vertical: each candle's volume at the bottom, for up to the last 450 candles; heavy candles (2x the average of the previous 50) are highlighted.
A node is a heavy candle whose typical price sat in the densest rows of the profile of the 200 candles before it (adjustable). Thin dotted lines join the newest nodes to their volume column and to their profile row.
Zones are the price rows that are dense in the profile or hold a cluster of nodes. Shading is a gradient: the more nodes around a row, the darker it is. The label shows how many nodes sit inside a zone. The table lists the zones nearest to price, their distance and whether they sit above or below it.
How we checked: we tested single node levels as a fixed rule against random levels, and they did not hold more often than chance. So this is a map of where volume sat, not a signal. Zones that hold and zones that break are both common.
Settings: window length, node search window, volume average, heavy-volume multiple, profile rows, share of dense rows, profile width and gap, colours, zones on or off, table on or off.
Nodes are found on closed candles and do not repaint; the profile and the zones include the forming candle and update with it. On forex and CFDs the volume is tick volume.
Data, not advice.

Disclaimer
The information and publications are not meant to be, and do not constitute, financial, investment, trading, or other types of advice or recommendations supplied or endorsed by TradingView. Read more in the Terms of Use.
Disclaimer
The information and publications are not meant to be, and do not constitute, financial, investment, trading, or other types of advice or recommendations supplied or endorsed by TradingView. Read more in the Terms of Use.