Motion Flow [Quanty]
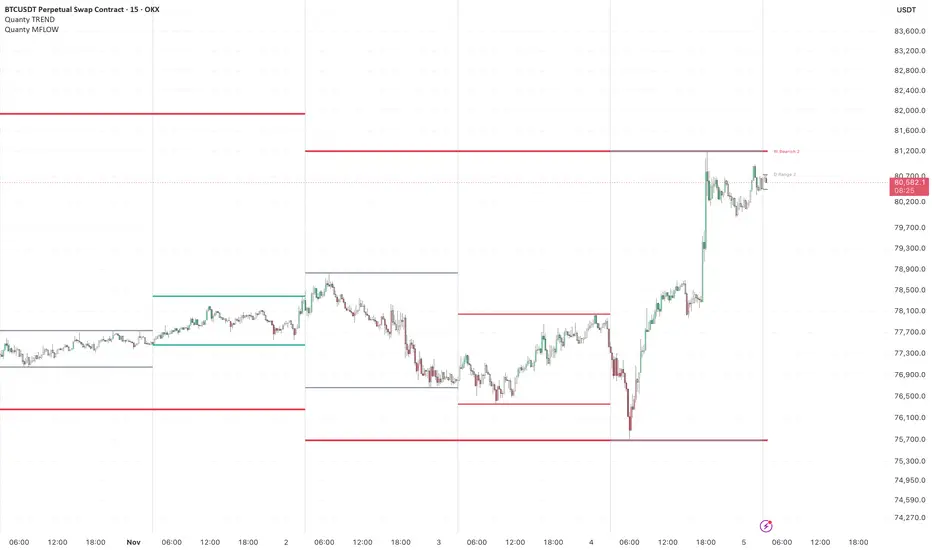
Motion Flow [Quanty]
Research. Build. Refine.
Market structure across 1h, 4h, daily and weekly periods, read from one thing: whether a period took the high or the low of the period before it. Each period's high and low are drawn as solid lines, and the line colour tells you the state. It reads the structure; it does not give signals, entries or targets.
HOW IT WORKS
Bullish (HH + HL): the period took the previous high and held the previous low.
Bearish (LH + LL): the period took the previous low and held the previous high.
Range: it took both, or neither.
The state updates live while a period is open and is final when the period closes. The high and low lines can move until then.
HOW TO READ IT
Green lines: higher highs and higher lows. Red lines: lower highs and lower lows. Grey lines: no clear structure. A thin vertical line marks the start of a period. The tag on the newest period shows the timeframe, the state and how many periods in a row it has held, for example D Bullish 3.
SETTINGS
High / Low: tick 1h, 4h, Daily, Weekly, any number at once. Separators: the same four ticks, set apart from the lines, so you can show weekly separators with daily levels. Periods shown: 1 to 30, default 15. State tag: on or off. Colours: Bullish, Bearish, Range.
GOOD TO KNOW
A timeframe smaller than the chart is skipped: on a 4h chart, 1h is not drawn. Period starts follow the symbol's own session, so they can differ between markets.
Written from the definition of market structure; no code from other scripts is used.
Data, not advice.
Research. Build. Refine.
Market structure across 1h, 4h, daily and weekly periods, read from one thing: whether a period took the high or the low of the period before it. Each period's high and low are drawn as solid lines, and the line colour tells you the state. It reads the structure; it does not give signals, entries or targets.
HOW IT WORKS
Bullish (HH + HL): the period took the previous high and held the previous low.
Bearish (LH + LL): the period took the previous low and held the previous high.
Range: it took both, or neither.
The state updates live while a period is open and is final when the period closes. The high and low lines can move until then.
HOW TO READ IT
Green lines: higher highs and higher lows. Red lines: lower highs and lower lows. Grey lines: no clear structure. A thin vertical line marks the start of a period. The tag on the newest period shows the timeframe, the state and how many periods in a row it has held, for example D Bullish 3.
SETTINGS
High / Low: tick 1h, 4h, Daily, Weekly, any number at once. Separators: the same four ticks, set apart from the lines, so you can show weekly separators with daily levels. Periods shown: 1 to 30, default 15. State tag: on or off. Colours: Bullish, Bearish, Range.
GOOD TO KNOW
A timeframe smaller than the chart is skipped: on a 4h chart, 1h is not drawn. Period starts follow the symbol's own session, so they can differ between markets.
Written from the definition of market structure; no code from other scripts is used.
Data, not advice.

Disclaimer
The information and publications are not meant to be, and do not constitute, financial, investment, trading, or other types of advice or recommendations supplied or endorsed by TradingView. Read more in the Terms of Use.
Disclaimer
The information and publications are not meant to be, and do not constitute, financial, investment, trading, or other types of advice or recommendations supplied or endorsed by TradingView. Read more in the Terms of Use.