Amagon Group signal VSA Wyckoff Volume Alert
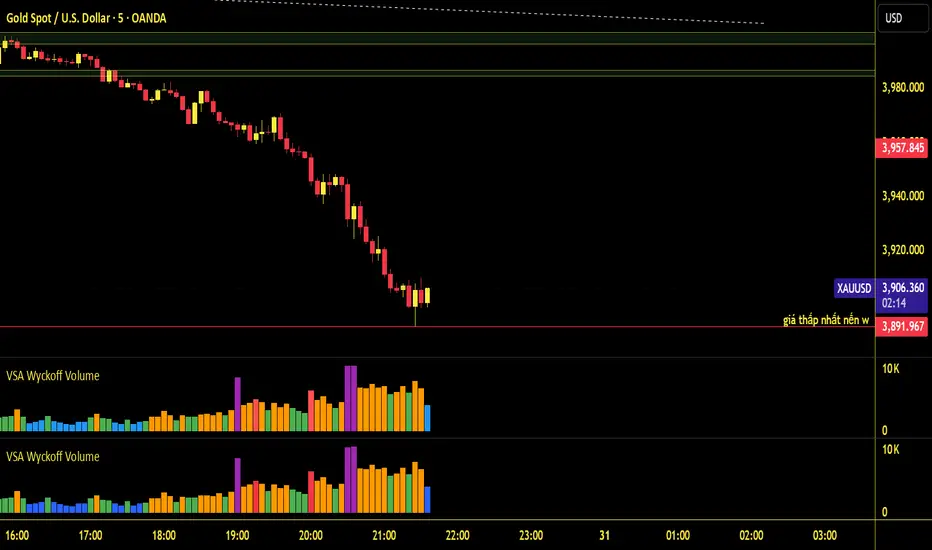
VSA Wyckoff Volume Alert
This indicator colors each volume bar by how strong it is compared with recent average volume, following the Volume Spread Analysis (VSA) and Wyckoff approach. It also adds a ready-to-use alert for the strongest level, shown in purple.
How it works
Average volume is calculated with a Wilder moving average (default length: 20 bars).
Each bar’s volume is compared with that average and sorted into six levels:
Purple: Ultra High (2.2x average or more)
Red: Very High (1.8x and above)
Orange: High (1.2x and above)
Green: Normal (0.8x and above)
Blue: Low (0.4x and above)
Silver: Very Low (below 0.4x)
All ratios and the moving average length can be changed in the settings. An optional line shows the volume moving average.
Alert
The alert condition “Volume tím (Ultra High)” fires when a purple bar appears.
Create it from the Alerts panel and choose “Once Per Bar Close” to be notified after the candle closes, or “Once Per Bar” for an earlier notice during the candle. Notifications can be sent as a popup, sound, email, or push message, depending on your TradingView plan.
How to use
Add the indicator to any chart and timeframe. It was set up with the 5-minute chart in mind, but it works on any timeframe.
Ultra High volume can point to unusually heavy activity, which traders often check against the price action (spread, close position, and the surrounding trend) before drawing conclusions.
Notes
On forex and gold symbols, volume is usually tick volume (the number of price updates), not actual traded volume.
This indicator is a charting aid and does not give buy or sell signals. It is not financial advice.
This indicator colors each volume bar by how strong it is compared with recent average volume, following the Volume Spread Analysis (VSA) and Wyckoff approach. It also adds a ready-to-use alert for the strongest level, shown in purple.
How it works
Average volume is calculated with a Wilder moving average (default length: 20 bars).
Each bar’s volume is compared with that average and sorted into six levels:
Purple: Ultra High (2.2x average or more)
Red: Very High (1.8x and above)
Orange: High (1.2x and above)
Green: Normal (0.8x and above)
Blue: Low (0.4x and above)
Silver: Very Low (below 0.4x)
All ratios and the moving average length can be changed in the settings. An optional line shows the volume moving average.
Alert
The alert condition “Volume tím (Ultra High)” fires when a purple bar appears.
Create it from the Alerts panel and choose “Once Per Bar Close” to be notified after the candle closes, or “Once Per Bar” for an earlier notice during the candle. Notifications can be sent as a popup, sound, email, or push message, depending on your TradingView plan.
How to use
Add the indicator to any chart and timeframe. It was set up with the 5-minute chart in mind, but it works on any timeframe.
Ultra High volume can point to unusually heavy activity, which traders often check against the price action (spread, close position, and the surrounding trend) before drawing conclusions.
Notes
On forex and gold symbols, volume is usually tick volume (the number of price updates), not actual traded volume.
This indicator is a charting aid and does not give buy or sell signals. It is not financial advice.

Disclaimer
The information and publications are not meant to be, and do not constitute, financial, investment, trading, or other types of advice or recommendations supplied or endorsed by TradingView. Read more in the Terms of Use.
Disclaimer
The information and publications are not meant to be, and do not constitute, financial, investment, trading, or other types of advice or recommendations supplied or endorsed by TradingView. Read more in the Terms of Use.