Golden Cross Historical Map
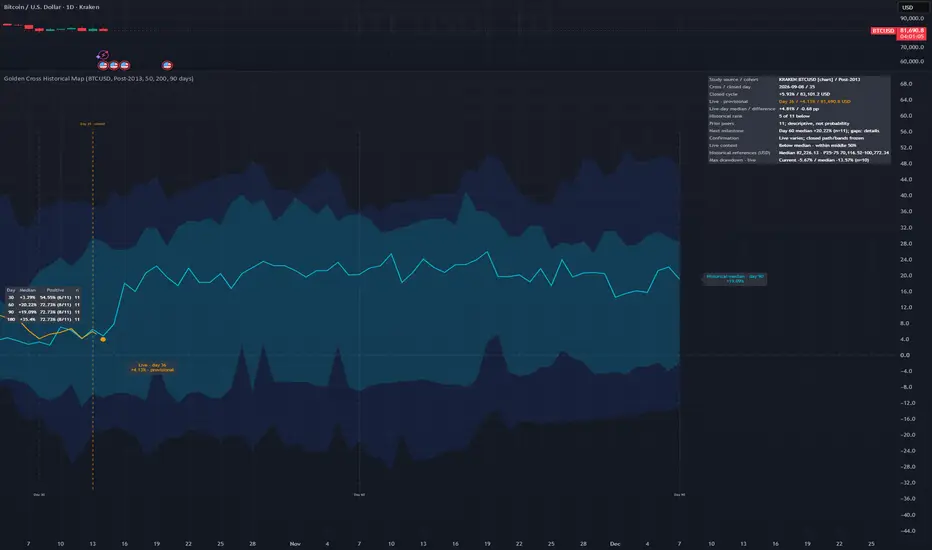
Quick start
Golden Cross Historical Map compares the latest confirmed daily golden-cross cycle with earlier cycles from the same market. It is a descriptive indicator, not a trading strategy or price forecast.
What does this indicator help you understand?
A golden cross identifies a change in the moving-average trend, but it does not tell you how the following weeks will unfold. This indicator adds historical context: it compares the current cycle with earlier golden-cross cycles from the same selected market, aligned by days since the cross.
It helps answer several practical questions:
Can it predict what happens next?
The historical paths provide a reference for possible scenarios, rather than a validated prediction of the current cycle. They show what followed comparable events previously; they do not establish that today's market will repeat those outcomes.
For example, a historical median of +20% at day 60 means the median eligible prior-cycle return was +20% from its own cross-day close. It does not predict a further 20% rise from today's price.
Likewise, an 80% percentile band is a historical range at each individual day—not an 80% probability that the current cycle will remain inside the band throughout the entire period. The Positive percentage is an observed historical frequency, not a forecast success rate.
Use the indicator to judge relative strength, historical variability and experienced drawdown, and to frame expectations with context. Small, overlapping samples and changing market conditions limit how confidently those observations can be carried forward.
Reading the chart
Dashboard and milestones
The milestone summary retains days 30, 60, 90 and 180 in either view.
How the historical sample is built
A cross occurs when daily SMA50 exceeds SMA200 after being at or below it on the previous source bar; both lengths are configurable. Available pre-cutoff data provides moving-average warmup.
Live view and drawdown
Live return, rank and context can fluctuate without changing confirmed events, closed paths or frozen references. Manual quotes refresh with host-chart updates, not a guaranteed independent source tickstream; stale or non-forming quotes are not labelled live.
Maximum drawdown is the worst negative daily-close peak-to-trough return since the cross, including its anchor. Its historical median is calculated from individual cycles through the same day, not from the median curve; complete daily-close windows are required.
Missing current history is marked observed only. A live quote acts as a provisional next close without mutating confirmed drawdown.
Optional features and alerts
Cohort comparison shares one source, anchor, day and freeze date. Optional gray paths show up to ten newest prior cycles; missing/unmatured dates remain gaps and omitted fragmented paths are disclosed.
Alerts use confirmed source closes, available at the next source day opening. Initial attachment arms silently; skipped days do not produce retrospective notifications.
Limits
Requested history is capped at 20,000 bars and 100 retained crosses; optional paths have a 64-segment budget. Historical paths and drawdown peers stop at day 180, while current observed drawdown continues.
Samples may be small; feed composition, provider revisions and coverage affect results. Replay, full source rollover/reconnect behaviour and actual server-alert delivery remain unverified; past observations do not guarantee future results.
Inspiration
Conceptual inspiration: Krown's discussion of golden-cross historical paths. This independent implementation uses no Krown code or private dataset and claims no affiliation or endorsement.
Golden Cross Historical Map compares the latest confirmed daily golden-cross cycle with earlier cycles from the same market. It is a descriptive indicator, not a trading strategy or price forecast.
- Use a standard, UTC-aligned, 24-hour crypto chart on 1D. Synthetic charts and session-based daily feeds are unsupported.
- Chart-follow is enabled by default; use KRAKEN:BTCUSD for the intended Bitcoin/USD comparison. Disable chart-follow to choose an independent study source; the manual fallback is KRAKEN:BTCUSD.
- Defaults: SMA50/200, Post-2013, 90-day view, live display, historical prices and milestone summary on. Cohort comparison, individual paths and alerts are off; Post-2015, full available history and a 180-day view are selectable.
What does this indicator help you understand?
A golden cross identifies a change in the moving-average trend, but it does not tell you how the following weeks will unfold. This indicator adds historical context: it compares the current cycle with earlier golden-cross cycles from the same selected market, aligned by days since the cross.
It helps answer several practical questions:
- Is the current cycle stronger or weaker than previous cycles at this stage? Compare its return with the historical median and percentile bands at the same elapsed day.
- How varied were the historical outcomes? The bands show the spread between earlier cycles. Wide bands indicate that similar starting events produced substantially different results.
- Is the current pullback unusually deep? Maximum drawdown compares the current cycle's worst daily-close decline from a preceding peak with historical drawdowns through the same day.
- What happened at later milestones? The day 30/60/90/180 summary shows historical median returns, available sample counts and the proportion of outcomes above their cross-day starting price.
- How sensitive is the picture to the historical sample? Comparing date cohorts helps reveal whether older cycles materially change the reference.
Can it predict what happens next?
The historical paths provide a reference for possible scenarios, rather than a validated prediction of the current cycle. They show what followed comparable events previously; they do not establish that today's market will repeat those outcomes.
For example, a historical median of +20% at day 60 means the median eligible prior-cycle return was +20% from its own cross-day close. It does not predict a further 20% rise from today's price.
Likewise, an 80% percentile band is a historical range at each individual day—not an 80% probability that the current cycle will remain inside the band throughout the entire period. The Positive percentage is an observed historical frequency, not a forecast success rate.
Use the indicator to judge relative strength, historical variability and experienced drawdown, and to frame expectations with context. Small, overlapping samples and changing market conditions limit how confidently those observations can be carried forward.
Reading the chart
- Aqua median: the historical median return at each elapsed day.
- P25-P75 / P10-P90: the middle 50% / 80% percentile ranges of prior-cycle returns, using linear interpolation. These describe historical spread, not confidence intervals or forecast probabilities.
- Solid orange: confirmed current-cycle closes, normalized to its cross-day close. Endpoint labels and day markers identify the observed day.
- Live orange point: a provisional selected-source quote; an adjacent-day dashed extension never bridges missing dates.
Dashboard and milestones
- Difference: displayed return minus same-day median, in percentage points.
- Rank and context: descriptive comparisons with available peers, not trading signals. Exact ties are disclosed; percentile-band boundaries are inclusive.
- Price references: anchor multiplied by one plus the historical return, in the selected source's currency. They are historical equivalents, not targets; USD and USDT feeds are distinct and never pooled.
- n: earlier cycles with an available outcome on that exact day, excluding the current cycle.
- Positive: count of closing returns strictly above zero from each cycle's own cross close, divided by n for the displayed percentage. Equal counts at different horizons need not involve the same cycles or imply forecast probabilities.
The milestone summary retains days 30, 60, 90 and 180 in either view.
How the historical sample is built
A cross occurs when daily SMA50 exceeds SMA200 after being at or below it on the previous source bar; both lengths are configurable. Available pre-cutoff data provides moving-average warmup.
- Day 0 is the cross close; returns are percentage changes from that anchor on exact calendar dates.
- The current cycle is excluded. References freeze at its confirmed cross close: only earlier outcomes already available then contribute.
- Missing outcomes stay unavailable, so counts vary. Overlapping crosses are retained and observations are dependent; date cutoffs are comparison choices, not proven maturity boundaries.
Live view and drawdown
Live return, rank and context can fluctuate without changing confirmed events, closed paths or frozen references. Manual quotes refresh with host-chart updates, not a guaranteed independent source tickstream; stale or non-forming quotes are not labelled live.
Maximum drawdown is the worst negative daily-close peak-to-trough return since the cross, including its anchor. Its historical median is calculated from individual cycles through the same day, not from the median curve; complete daily-close windows are required.
Missing current history is marked observed only. A live quote acts as a provisional next close without mutating confirmed drawdown.
Optional features and alerts
Cohort comparison shares one source, anchor, day and freeze date. Optional gray paths show up to ten newest prior cycles; missing/unmatured dates remain gaps and omitted fragmented paths are disclosed.
- Enable the alert master and desired milestone, median-cross or P10-P90 exit types.
- Create a TradingView alert using Any alert() function call.
- Recreate it after changing script settings or source/code.
Alerts use confirmed source closes, available at the next source day opening. Initial attachment arms silently; skipped days do not produce retrospective notifications.
Limits
Requested history is capped at 20,000 bars and 100 retained crosses; optional paths have a 64-segment budget. Historical paths and drawdown peers stop at day 180, while current observed drawdown continues.
Samples may be small; feed composition, provider revisions and coverage affect results. Replay, full source rollover/reconnect behaviour and actual server-alert delivery remain unverified; past observations do not guarantee future results.
Inspiration
Conceptual inspiration: Krown's discussion of golden-cross historical paths. This independent implementation uses no Krown code or private dataset and claims no affiliation or endorsement.

Disclaimer
The information and publications are not meant to be, and do not constitute, financial, investment, trading, or other types of advice or recommendations supplied or endorsed by TradingView. Read more in the Terms of Use.
Disclaimer
The information and publications are not meant to be, and do not constitute, financial, investment, trading, or other types of advice or recommendations supplied or endorsed by TradingView. Read more in the Terms of Use.