Volume Profile - POC VAH VAL
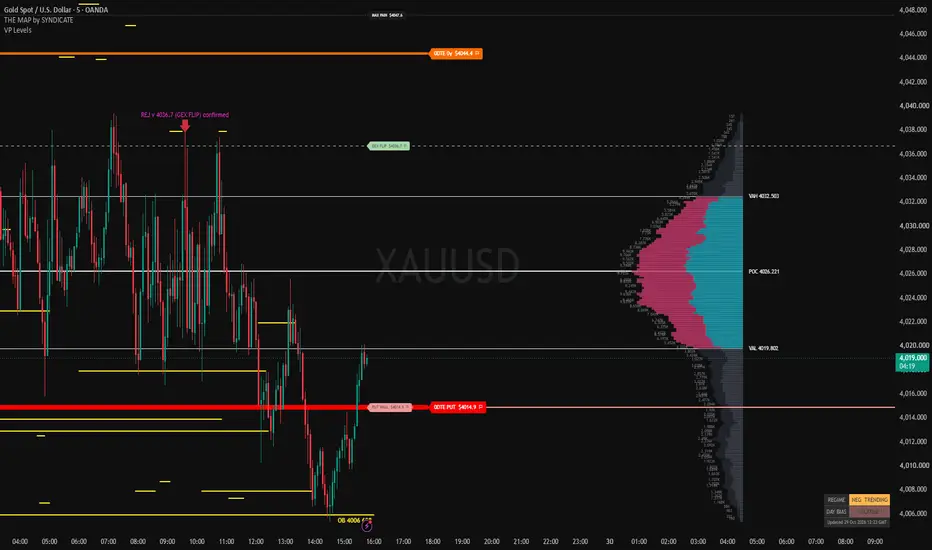
Volume Profile - POC VAH VAL (VP Levels)
WHAT IT DOES
Draws a volume profile for the part of the chart you choose and marks the three levels traders use most: the Point of Control (POC), the Value Area High (VAH) and the Value Area Low (VAL). The histogram sits to the right of the last bar and the three levels run across the chart as horizontal lines with price labels. The settings are laid out like TradingView's built-in Fixed Range Volume Profile, so they will feel familiar.
THE THREE LEVELS
- POC: the price row with the most traded volume in the range. Often treated as "fair value".
- VAH: the top edge of the value area.
- VAL: the bottom edge of the value area.
The value area holds 70% of the range's volume by default. You can set it anywhere from 10% to 100%.
HOW IT WORKS
1. The high-low of the chosen range is split into equal price rows.
2. Each bar's volume is spread across the rows its high-low range covers, in proportion to the overlap.
3. Bars that close at or above the open count as up volume. All other bars count as down volume.
4. The POC is the row with the highest total volume.
5. The value area starts at the POC and grows outward. At each step it adds whichever pair of rows above or below has more volume, until the chosen percentage of total volume is inside.
PROFILE RANGE
- Visible Range: profiles the bars on screen. It updates when you scroll or zoom.
- Fixed Bars: profiles the last N bars (10 to 5000).
- Session (Day): from the start of today until now.
- Week: from the start of this week until now.
SETTINGS
- Rows Layout: Number Of Rows or Ticks Per Row. Row Size goes up to 2000.
- Volume display: Up/Down (stacked buy and sell), Total, or Delta (buy minus sell per row).
- Value Area Volume: 10 to 100%, default 70%.
- Show or hide the profile, volume values, POC, VAH, VAL and the price labels.
- Colour, line style (solid, dashed or dotted) and width for each level.
- Colours for up volume, down volume and the value-area up and down volume.
- Profile width, left or right placement, box width and the gap to the last bar.
- Extend the levels to the left (on by default) and/or to the right.
- Developing POC and Developing VA (off by default): replay the range bar by bar and draw how the POC and value area moved while the range formed.
HOW TO USE IT
- Give the chart some empty space on the right so the histogram box is visible. You can widen it with "Box width (bars)".
- Use Visible Range to read the profile of whatever you are looking at. Use Session or Week for intraday and weekly context.
- Many traders watch how price reacts around the POC, VAH and VAL: acceptance inside the value area, rejection at its edges, or a move away from the POC. These are reference levels, not signals.
- Turn on Developing POC to see whether value is moving up or down during the session.
NOTES AND LIMITS
- It needs volume data. If the symbol has none, it shows "No volume data for this symbol".
- On forex and CFD symbols (for example gold on OANDA) the volume is the tick volume supplied by the data feed, not real exchange volume. Read the profile with that in mind.
- It looks back at most 5000 bars.
- The profile is calculated on the latest bar and drawn with lines, labels and boxes. It shows the current profile only and does not paint history on past bars. It has no alerts.
- To stay within TradingView's drawing limits, the histogram is drawn with at most 240 merged rows. The POC, VAH and VAL are calculated on all rows.
DISCLAIMER
For education and analysis only. This is not financial advice and does not predict future price moves.
WHAT IT DOES
Draws a volume profile for the part of the chart you choose and marks the three levels traders use most: the Point of Control (POC), the Value Area High (VAH) and the Value Area Low (VAL). The histogram sits to the right of the last bar and the three levels run across the chart as horizontal lines with price labels. The settings are laid out like TradingView's built-in Fixed Range Volume Profile, so they will feel familiar.
THE THREE LEVELS
- POC: the price row with the most traded volume in the range. Often treated as "fair value".
- VAH: the top edge of the value area.
- VAL: the bottom edge of the value area.
The value area holds 70% of the range's volume by default. You can set it anywhere from 10% to 100%.
HOW IT WORKS
1. The high-low of the chosen range is split into equal price rows.
2. Each bar's volume is spread across the rows its high-low range covers, in proportion to the overlap.
3. Bars that close at or above the open count as up volume. All other bars count as down volume.
4. The POC is the row with the highest total volume.
5. The value area starts at the POC and grows outward. At each step it adds whichever pair of rows above or below has more volume, until the chosen percentage of total volume is inside.
PROFILE RANGE
- Visible Range: profiles the bars on screen. It updates when you scroll or zoom.
- Fixed Bars: profiles the last N bars (10 to 5000).
- Session (Day): from the start of today until now.
- Week: from the start of this week until now.
SETTINGS
- Rows Layout: Number Of Rows or Ticks Per Row. Row Size goes up to 2000.
- Volume display: Up/Down (stacked buy and sell), Total, or Delta (buy minus sell per row).
- Value Area Volume: 10 to 100%, default 70%.
- Show or hide the profile, volume values, POC, VAH, VAL and the price labels.
- Colour, line style (solid, dashed or dotted) and width for each level.
- Colours for up volume, down volume and the value-area up and down volume.
- Profile width, left or right placement, box width and the gap to the last bar.
- Extend the levels to the left (on by default) and/or to the right.
- Developing POC and Developing VA (off by default): replay the range bar by bar and draw how the POC and value area moved while the range formed.
HOW TO USE IT
- Give the chart some empty space on the right so the histogram box is visible. You can widen it with "Box width (bars)".
- Use Visible Range to read the profile of whatever you are looking at. Use Session or Week for intraday and weekly context.
- Many traders watch how price reacts around the POC, VAH and VAL: acceptance inside the value area, rejection at its edges, or a move away from the POC. These are reference levels, not signals.
- Turn on Developing POC to see whether value is moving up or down during the session.
NOTES AND LIMITS
- It needs volume data. If the symbol has none, it shows "No volume data for this symbol".
- On forex and CFD symbols (for example gold on OANDA) the volume is the tick volume supplied by the data feed, not real exchange volume. Read the profile with that in mind.
- It looks back at most 5000 bars.
- The profile is calculated on the latest bar and drawn with lines, labels and boxes. It shows the current profile only and does not paint history on past bars. It has no alerts.
- To stay within TradingView's drawing limits, the histogram is drawn with at most 240 merged rows. The POC, VAH and VAL are calculated on all rows.
DISCLAIMER
For education and analysis only. This is not financial advice and does not predict future price moves.

Disclaimer
The information and publications are not meant to be, and do not constitute, financial, investment, trading, or other types of advice or recommendations supplied or endorsed by TradingView. Read more in the Terms of Use.
Disclaimer
The information and publications are not meant to be, and do not constitute, financial, investment, trading, or other types of advice or recommendations supplied or endorsed by TradingView. Read more in the Terms of Use.