OPEN-SOURCE SCRIPT
Updated RSI Divergence Detector
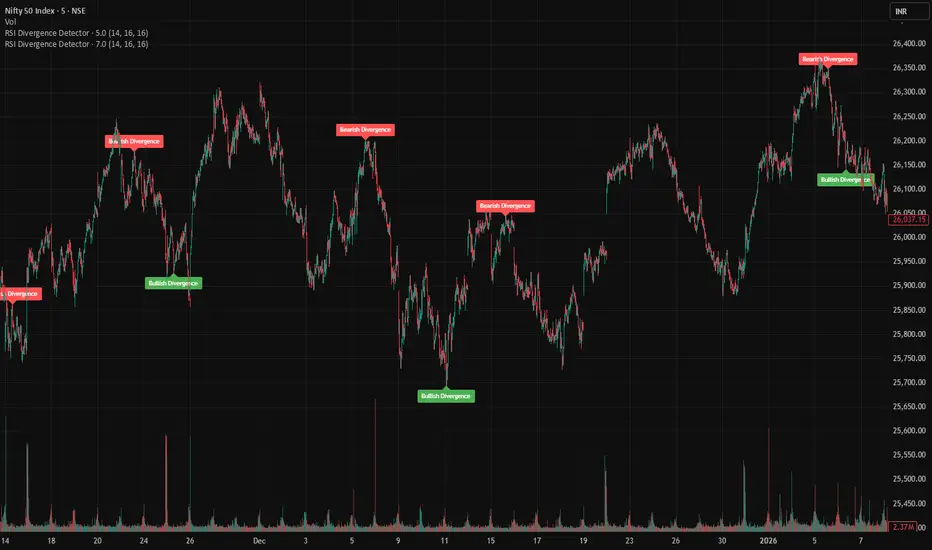
This indicator automatically detects bullish and bearish RSI divergences and displays them directly on the price chart.
A bullish divergence occurs when price forms a lower low while RSI forms a higher low, which may indicate weakening bearish momentum and a potential upward reversal.
A bearish divergence occurs when price forms a higher high while RSI forms a lower high, which may signal weakening bullish momentum and a possible downward reversal.
The script uses pivot highs and lows on both price and RSI to identify confirmed divergences and plots labels on the chart when they occur.
Inputs
RSI Length – period used to calculate RSI
Pivot Left Bars – bars required on the left to confirm a pivot
Pivot Right Bars – bars required on the right to confirm a pivot
Because pivots require confirmation, signals appear after several bars.
A bullish divergence occurs when price forms a lower low while RSI forms a higher low, which may indicate weakening bearish momentum and a potential upward reversal.
A bearish divergence occurs when price forms a higher high while RSI forms a lower high, which may signal weakening bullish momentum and a possible downward reversal.
The script uses pivot highs and lows on both price and RSI to identify confirmed divergences and plots labels on the chart when they occur.
Inputs
RSI Length – period used to calculate RSI
Pivot Left Bars – bars required on the left to confirm a pivot
Pivot Right Bars – bars required on the right to confirm a pivot
Because pivots require confirmation, signals appear after several bars.
Release Notes
UpdateRelease Notes
updatesRelease Notes
updateRelease Notes
updatesRelease Notes
update: added alertOpen-source script
In true TradingView spirit, the creator of this script has made it open-source, so that traders can review and verify its functionality. Kudos to the author! While you can use it for free, remember that republishing the code is subject to our House Rules.

Disclaimer
The information and publications are not meant to be, and do not constitute, financial, investment, trading, or other types of advice or recommendations supplied or endorsed by TradingView. Read more in the Terms of Use.
Open-source script
In true TradingView spirit, the creator of this script has made it open-source, so that traders can review and verify its functionality. Kudos to the author! While you can use it for free, remember that republishing the code is subject to our House Rules.
Disclaimer
The information and publications are not meant to be, and do not constitute, financial, investment, trading, or other types of advice or recommendations supplied or endorsed by TradingView. Read more in the Terms of Use.