Strat HTF Candle Panels
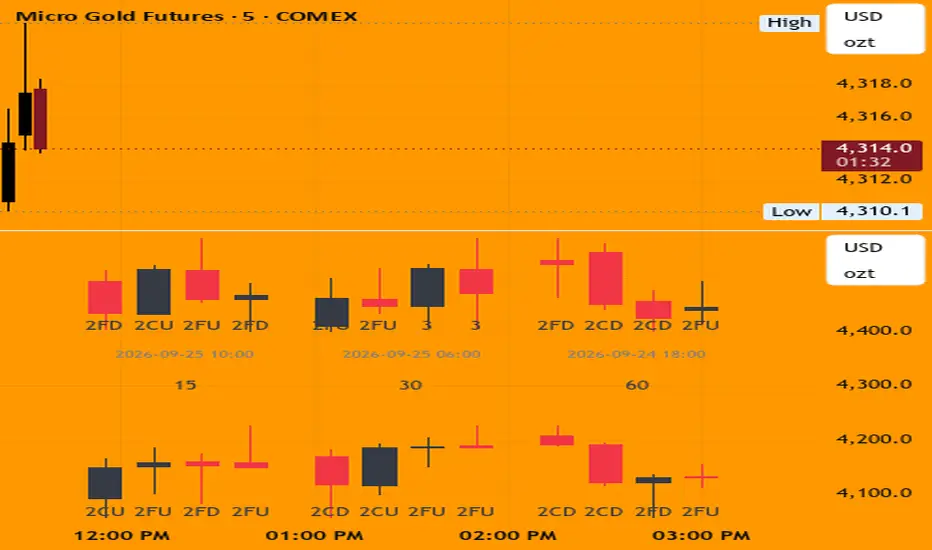
CRT is apart of my trading strategy , I created this indicator as sort of a higher time frame overlay. I just recently modified it to time travel and go back in time to show me what the selected timeframe was sorta looking like at a specific time, not as a directional bias but for a CRT bias (s/o to nitro trades on yt).
This indicator displays miniature candlestick "panels" for six timeframes at once, pinned to the right side of your chart (I recommend moving it to a new pane below), so you can scan multiple timeframes' recent price action without switching charts. Each panel shows the last several candles of its timeframe, classified using "Strat" candle typing (1, 2U, 2D, 3) with the type printed under each candle.
Key features:
Six configurable timeframe panels, arranged in two rows of three (defaults: 5m, 15m, 1H on top; 4H, Daily, Weekly on bottom), each fully customizable via the Timeframes group.
Strat candle classification — every candle is automatically labeled 1 (inside bar), 2U/2D (directional break), or 3 (outside bar), using the same logic as the Strat Research Matrix.
Time Travel mode — pick any past date and time, and every panel redraws to show what its candles looked like as of that exact moment, on that panel's own timeframe. Useful for reviewing how each timeframe's Strat pattern looked at a specific point in history. Includes an adjustable search range for timeframes that need to look further back to find your chosen date.
Hover tooltips — hovering near any candle reveals its exact date and time down to the minute, in your chart's timezone (its a bit hard to hover over the right spot on the candle to view this feature but if you hover over the candle it's a spot where the tooltip will pop up)
Date/time labels — each panel shows the date/time of its most recent visible candle along the bottom, so you always know what period you're looking at especially useful with Time Travel on (If it gives you any problems with lining up the exact time and date, the candles disappear or it times out adjust the search range *200* to a higher or lower number, sorry for the inconvenience).
Fully adjustable layout and style — candle width/spacing, panel size and vertical offset from price, panel height as a % of price, bull/bear colors, and toggles for titles, Strat number labels, date/time labels, and tooltips.
How it works: the script pulls each timeframe's OHLC and Strat classification via request.security, then draws the candles as scaled boxes/lines positioned to the right of the current bar — they're drawing objects, not real chart data, so they only render on the most recent bar and update live.
This indicator displays miniature candlestick "panels" for six timeframes at once, pinned to the right side of your chart (I recommend moving it to a new pane below), so you can scan multiple timeframes' recent price action without switching charts. Each panel shows the last several candles of its timeframe, classified using "Strat" candle typing (1, 2U, 2D, 3) with the type printed under each candle.
Key features:
Six configurable timeframe panels, arranged in two rows of three (defaults: 5m, 15m, 1H on top; 4H, Daily, Weekly on bottom), each fully customizable via the Timeframes group.
Strat candle classification — every candle is automatically labeled 1 (inside bar), 2U/2D (directional break), or 3 (outside bar), using the same logic as the Strat Research Matrix.
Time Travel mode — pick any past date and time, and every panel redraws to show what its candles looked like as of that exact moment, on that panel's own timeframe. Useful for reviewing how each timeframe's Strat pattern looked at a specific point in history. Includes an adjustable search range for timeframes that need to look further back to find your chosen date.
Hover tooltips — hovering near any candle reveals its exact date and time down to the minute, in your chart's timezone (its a bit hard to hover over the right spot on the candle to view this feature but if you hover over the candle it's a spot where the tooltip will pop up)
Date/time labels — each panel shows the date/time of its most recent visible candle along the bottom, so you always know what period you're looking at especially useful with Time Travel on (If it gives you any problems with lining up the exact time and date, the candles disappear or it times out adjust the search range *200* to a higher or lower number, sorry for the inconvenience).
Fully adjustable layout and style — candle width/spacing, panel size and vertical offset from price, panel height as a % of price, bull/bear colors, and toggles for titles, Strat number labels, date/time labels, and tooltips.
How it works: the script pulls each timeframe's OHLC and Strat classification via request.security, then draws the candles as scaled boxes/lines positioned to the right of the current bar — they're drawing objects, not real chart data, so they only render on the most recent bar and update live.

Disclaimer
The information and publications are not meant to be, and do not constitute, financial, investment, trading, or other types of advice or recommendations supplied or endorsed by TradingView. Read more in the Terms of Use.
Disclaimer
The information and publications are not meant to be, and do not constitute, financial, investment, trading, or other types of advice or recommendations supplied or endorsed by TradingView. Read more in the Terms of Use.