Updated
Market Strategies - FVG Breakers v2 alert system
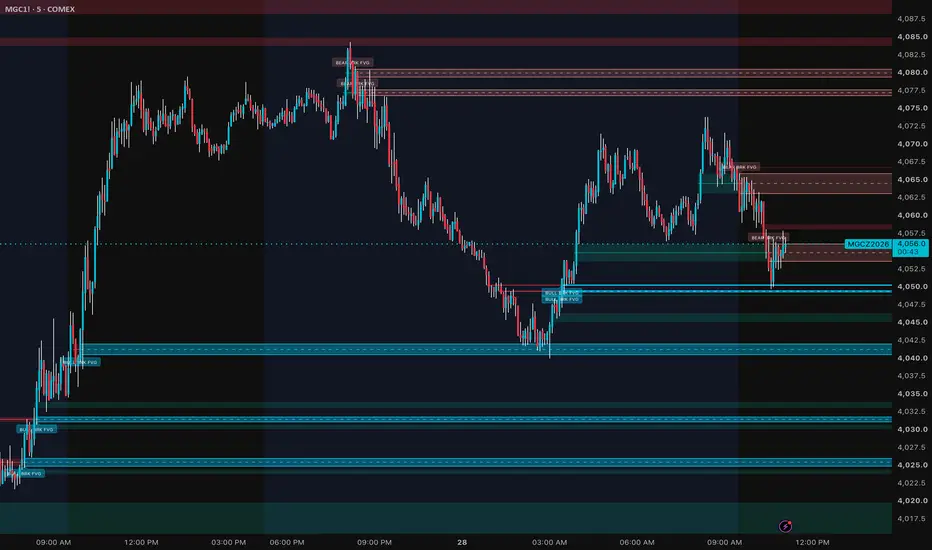
# Market Strategies - FVG Breakers v2
### Overview
Market Strategies - FVG Breakers v2 is a price-action indicator designed to identify Fair Value Gap (FVG) inversions, commonly referred to as FVG Breakers, using Smart Money Concepts-based detection and mitigation logic.
The indicator tracks existing price imbalances and identifies when those zones are breached, potentially signaling a change in directional control. Once an FVG transitions into a breaker, the corresponding price area is highlighted as a potential support or resistance zone.
The primary objective is to provide traders with a clean, systematic method for identifying bullish and bearish FVG breakers, particularly around significant swing highs, swing lows, and areas of changing market structure.
---
### Understanding FVG Breakers
A Fair Value Gap is a three-candle price imbalance created when aggressive directional movement leaves a separation between the first and third candles.
An FVG Breaker develops when price breaches an existing imbalance according to the selected mitigation criteria, changing the zone's directional interpretation.
**Bullish FVG Breaker**
A bullish breaker forms when price breaches the upper boundary of a previously bearish FVG. This transition may indicate increasing buying pressure and the potential for the former resistance area to become support.
**Bearish FVG Breaker**
A bearish breaker forms when price breaches the lower boundary of a previously bullish FVG. This transition may indicate increasing selling pressure and the potential for the former support area to become resistance.
These zones are highlighted directly on the chart, allowing traders to monitor subsequent price reactions and potential retests.
---
### FVG Breakers Around Swing Highs and Swing Lows
One of the most valuable applications of Market Strategies - FVG Breakers v2 is monitoring breaker formations around established swing highs and swing lows.
These structural levels frequently attract trading activity because they may contain clusters of stop orders, breakout orders, and resting liquidity.
When price moves beyond a significant swing point but fails to sustain the breakout, a subsequent FVG breaker can provide additional evidence of a potential directional transition.
**Bullish Breakers Near Swing Lows**
A bullish setup may develop when price trades below an established swing low, fails to sustain downward continuation, and subsequently reverses through a bearish FVG.
A sequence worth monitoring includes:
1. Price approaches or breaches a previous swing low.
2. Selling pressure fails to establish sustained acceptance below the level.
3. Price reverses upward, potentially reclaiming the previous swing low.
4. A bearish FVG is breached, creating a bullish FVG breaker.
5. Price returns to the breaker zone and demonstrates a supportive reaction.
This sequence may indicate that the attempted bearish continuation has weakened and that buyers are beginning to establish control.
**Bearish Breakers Near Swing Highs**
A bearish setup may develop when price trades above an established swing high, fails to sustain upward continuation, and subsequently reverses through a bullish FVG.
A sequence worth monitoring includes:
1. Price approaches or breaches a previous swing high.
2. Buying pressure fails to establish sustained acceptance above the level.
3. Price reverses downward, potentially falling back below the previous swing high.
4. A bullish FVG is breached, creating a bearish FVG breaker.
5. Price returns to the breaker zone and demonstrates a rejection.
This sequence may indicate weakening bullish momentum and a potential transition toward bearish control.
**Key Consideration:** Breakers developing near significant swing points may offer stronger contextual relevance than isolated breaker formations occurring without nearby structural reference levels. However, their reliability depends on prevailing market conditions and requires independent evaluation.
The indicator identifies FVG breakers automatically; swing-point significance and liquidity-sweep confirmation must be assessed separately.
---
### Breaker Confluence and Structural Confirmation
Although FVG breakers can provide useful information independently, their interpretation may be strengthened when supported by additional price-action conditions.
**Liquidity Sweeps**
A breaker developing after price briefly exceeds a previous swing high or low and subsequently reverses may suggest a failed attempt to continue through that liquidity area.
**Change of Character (CHoCH)**
A breaker forming alongside a change in short-term market structure may provide additional evidence of a potential directional transition.
**Break of Structure (BOS)**
A breaker aligned with a structural breakout may help identify areas worth monitoring for continuation or retest opportunities.
**Displacement**
Strong directional candles accompanying a breaker formation may indicate aggressive participation in the direction of the inversion.
**Breaker Retests**
When price returns to a previously formed breaker zone, the reaction can provide information about whether the area is functioning as support or resistance.
**Higher-Timeframe Context**
Breakers that align with broader market structure may be more relevant to a trader's directional thesis than those forming against it.
These factors are intended as analytical considerations rather than guaranteed confirmations.
---
### FVG Detection and Breaker Calculation
Market Strategies - FVG Breakers v2 uses a three-candle imbalance detection model with an adjustable Average True Range (ATR) threshold.
Bullish FVG candidates are identified when the third candle's low is above the first candle's high and the intermediate candle satisfies the configured threshold condition.
Bearish FVG candidates are identified using the corresponding opposite conditions.
The indicator registers qualifying FVGs with a one-bar delay and tracks their subsequent interaction with price.
Three mitigation methods are available:
- **Close:** Evaluates breaches using candle-body boundaries.
- **Wick:** Evaluates breaches using candle high and low extremes.
- **Avg:** Evaluates breaches using the midpoint of the FVG zone.
When the selected condition is satisfied, the original FVG transitions into a breaker.
The same mitigation framework is used to evaluate subsequent breaker invalidation.
---
### Overlap Filtering and Zone Management
The indicator includes an overlap-filtering system designed to reduce competing price imbalance zones.
The filtering process evaluates overlapping FVG records and removes qualifying overlaps according to the underlying Smart Money Concepts-based logic.
FVGs are tracked through their formation, breaker conversion, and eventual invalidation.
The **Show Last** setting defaults to 12 and controls the number of recent surviving FVG records displayed per direction.
Because this includes both regular FVGs and converted breakers, the number of visible breaker zones may be lower when regular FVG display is disabled.
This approach helps maintain a cleaner chart while preserving the most recent qualifying zones.
---
### Visual Features
**Bullish FVG Breakers**
Displayed in cyan, identifying bearish FVGs that have transitioned into bullish breakers.
**Bearish FVG Breakers**
Displayed in light red, identifying bullish FVGs that have transitioned into bearish breakers.
**Dashed Midpoint Lines**
Each breaker can display a dashed midpoint line, providing a central reference within the price imbalance zone.
**Breaker Labels**
Optional labels identify bullish and bearish breaker formations directly on the chart.
**Regular FVG Visibility**
Regular FVGs can be displayed or hidden independently of the breaker zones.
**Zone Extension**
Breaker zones can extend to the right, allowing traders to monitor future interactions with previously established imbalance levels.
**Adjustable Zone Display**
The number of displayed FVG records can be customized to accommodate different trading styles and chart preferences.
---
### Alert Conditions
Market Strategies - FVG Breakers v2 includes configurable alerts for the following events:
- Bullish FVG formation
- Bearish FVG formation
- Bullish FVG mitigation
- Bearish FVG mitigation
- Bullish FVG breaker formation
- Bearish FVG breaker formation
- Any bullish or bearish FVG breaker formation
Alerts are evaluated on confirmed candles to reduce signals associated with incomplete price bars.
These alerts allow traders to monitor multiple instruments without continuously observing every chart.
---
### Practical Trading Application
The indicator can be used across multiple timeframes, including the 1-minute, 5-minute, 15-minute, and higher-timeframe charts.
For short-term traders, the 1-minute and 5-minute charts can be useful for monitoring breaker development around intraday swing points and potential liquidity events.
A structured analytical process may include:
1. Identify a significant swing high, swing low, or established structural level.
2. Observe whether price breaks that level and sustains or rejects the move.
3. Monitor the formation of a bullish or bearish FVG breaker.
4. Evaluate whether the breaker aligns with a structural shift, displacement, or prevailing directional bias.
5. Observe subsequent price interaction with the breaker zone for confirmation or invalidation.
6. Establish risk parameters independently before considering an entry.
The indicator is intended to support this analytical process rather than automatically determine trade entries or exits.
---
### Final Considerations
Market Strategies - FVG Breakers v2 combines systematic Fair Value Gap inversion detection, breaker-zone visualization, overlap filtering, mitigation-based invalidation, and configurable alerts into a focused price-action tool.
Its central purpose is to help traders identify areas where previously established imbalances have changed directional significance.
**Special attention should be given to FVG breakers forming near significant swing highs and swing lows, particularly following failed breakouts, liquidity sweeps, or changes in market structure.**
These locations can provide meaningful context for evaluating potential reversals, continuation opportunities, and subsequent price reactions.
FVG breakers should not be interpreted as guaranteed trading signals. No single formation ensures a particular market outcome, and all trading decisions should incorporate independent analysis, appropriate risk management, and prevailing market conditions.
### Overview
Market Strategies - FVG Breakers v2 is a price-action indicator designed to identify Fair Value Gap (FVG) inversions, commonly referred to as FVG Breakers, using Smart Money Concepts-based detection and mitigation logic.
The indicator tracks existing price imbalances and identifies when those zones are breached, potentially signaling a change in directional control. Once an FVG transitions into a breaker, the corresponding price area is highlighted as a potential support or resistance zone.
The primary objective is to provide traders with a clean, systematic method for identifying bullish and bearish FVG breakers, particularly around significant swing highs, swing lows, and areas of changing market structure.
---
### Understanding FVG Breakers
A Fair Value Gap is a three-candle price imbalance created when aggressive directional movement leaves a separation between the first and third candles.
An FVG Breaker develops when price breaches an existing imbalance according to the selected mitigation criteria, changing the zone's directional interpretation.
**Bullish FVG Breaker**
A bullish breaker forms when price breaches the upper boundary of a previously bearish FVG. This transition may indicate increasing buying pressure and the potential for the former resistance area to become support.
**Bearish FVG Breaker**
A bearish breaker forms when price breaches the lower boundary of a previously bullish FVG. This transition may indicate increasing selling pressure and the potential for the former support area to become resistance.
These zones are highlighted directly on the chart, allowing traders to monitor subsequent price reactions and potential retests.
---
### FVG Breakers Around Swing Highs and Swing Lows
One of the most valuable applications of Market Strategies - FVG Breakers v2 is monitoring breaker formations around established swing highs and swing lows.
These structural levels frequently attract trading activity because they may contain clusters of stop orders, breakout orders, and resting liquidity.
When price moves beyond a significant swing point but fails to sustain the breakout, a subsequent FVG breaker can provide additional evidence of a potential directional transition.
**Bullish Breakers Near Swing Lows**
A bullish setup may develop when price trades below an established swing low, fails to sustain downward continuation, and subsequently reverses through a bearish FVG.
A sequence worth monitoring includes:
1. Price approaches or breaches a previous swing low.
2. Selling pressure fails to establish sustained acceptance below the level.
3. Price reverses upward, potentially reclaiming the previous swing low.
4. A bearish FVG is breached, creating a bullish FVG breaker.
5. Price returns to the breaker zone and demonstrates a supportive reaction.
This sequence may indicate that the attempted bearish continuation has weakened and that buyers are beginning to establish control.
**Bearish Breakers Near Swing Highs**
A bearish setup may develop when price trades above an established swing high, fails to sustain upward continuation, and subsequently reverses through a bullish FVG.
A sequence worth monitoring includes:
1. Price approaches or breaches a previous swing high.
2. Buying pressure fails to establish sustained acceptance above the level.
3. Price reverses downward, potentially falling back below the previous swing high.
4. A bullish FVG is breached, creating a bearish FVG breaker.
5. Price returns to the breaker zone and demonstrates a rejection.
This sequence may indicate weakening bullish momentum and a potential transition toward bearish control.
**Key Consideration:** Breakers developing near significant swing points may offer stronger contextual relevance than isolated breaker formations occurring without nearby structural reference levels. However, their reliability depends on prevailing market conditions and requires independent evaluation.
The indicator identifies FVG breakers automatically; swing-point significance and liquidity-sweep confirmation must be assessed separately.
---
### Breaker Confluence and Structural Confirmation
Although FVG breakers can provide useful information independently, their interpretation may be strengthened when supported by additional price-action conditions.
**Liquidity Sweeps**
A breaker developing after price briefly exceeds a previous swing high or low and subsequently reverses may suggest a failed attempt to continue through that liquidity area.
**Change of Character (CHoCH)**
A breaker forming alongside a change in short-term market structure may provide additional evidence of a potential directional transition.
**Break of Structure (BOS)**
A breaker aligned with a structural breakout may help identify areas worth monitoring for continuation or retest opportunities.
**Displacement**
Strong directional candles accompanying a breaker formation may indicate aggressive participation in the direction of the inversion.
**Breaker Retests**
When price returns to a previously formed breaker zone, the reaction can provide information about whether the area is functioning as support or resistance.
**Higher-Timeframe Context**
Breakers that align with broader market structure may be more relevant to a trader's directional thesis than those forming against it.
These factors are intended as analytical considerations rather than guaranteed confirmations.
---
### FVG Detection and Breaker Calculation
Market Strategies - FVG Breakers v2 uses a three-candle imbalance detection model with an adjustable Average True Range (ATR) threshold.
Bullish FVG candidates are identified when the third candle's low is above the first candle's high and the intermediate candle satisfies the configured threshold condition.
Bearish FVG candidates are identified using the corresponding opposite conditions.
The indicator registers qualifying FVGs with a one-bar delay and tracks their subsequent interaction with price.
Three mitigation methods are available:
- **Close:** Evaluates breaches using candle-body boundaries.
- **Wick:** Evaluates breaches using candle high and low extremes.
- **Avg:** Evaluates breaches using the midpoint of the FVG zone.
When the selected condition is satisfied, the original FVG transitions into a breaker.
The same mitigation framework is used to evaluate subsequent breaker invalidation.
---
### Overlap Filtering and Zone Management
The indicator includes an overlap-filtering system designed to reduce competing price imbalance zones.
The filtering process evaluates overlapping FVG records and removes qualifying overlaps according to the underlying Smart Money Concepts-based logic.
FVGs are tracked through their formation, breaker conversion, and eventual invalidation.
The **Show Last** setting defaults to 12 and controls the number of recent surviving FVG records displayed per direction.
Because this includes both regular FVGs and converted breakers, the number of visible breaker zones may be lower when regular FVG display is disabled.
This approach helps maintain a cleaner chart while preserving the most recent qualifying zones.
---
### Visual Features
**Bullish FVG Breakers**
Displayed in cyan, identifying bearish FVGs that have transitioned into bullish breakers.
**Bearish FVG Breakers**
Displayed in light red, identifying bullish FVGs that have transitioned into bearish breakers.
**Dashed Midpoint Lines**
Each breaker can display a dashed midpoint line, providing a central reference within the price imbalance zone.
**Breaker Labels**
Optional labels identify bullish and bearish breaker formations directly on the chart.
**Regular FVG Visibility**
Regular FVGs can be displayed or hidden independently of the breaker zones.
**Zone Extension**
Breaker zones can extend to the right, allowing traders to monitor future interactions with previously established imbalance levels.
**Adjustable Zone Display**
The number of displayed FVG records can be customized to accommodate different trading styles and chart preferences.
---
### Alert Conditions
Market Strategies - FVG Breakers v2 includes configurable alerts for the following events:
- Bullish FVG formation
- Bearish FVG formation
- Bullish FVG mitigation
- Bearish FVG mitigation
- Bullish FVG breaker formation
- Bearish FVG breaker formation
- Any bullish or bearish FVG breaker formation
Alerts are evaluated on confirmed candles to reduce signals associated with incomplete price bars.
These alerts allow traders to monitor multiple instruments without continuously observing every chart.
---
### Practical Trading Application
The indicator can be used across multiple timeframes, including the 1-minute, 5-minute, 15-minute, and higher-timeframe charts.
For short-term traders, the 1-minute and 5-minute charts can be useful for monitoring breaker development around intraday swing points and potential liquidity events.
A structured analytical process may include:
1. Identify a significant swing high, swing low, or established structural level.
2. Observe whether price breaks that level and sustains or rejects the move.
3. Monitor the formation of a bullish or bearish FVG breaker.
4. Evaluate whether the breaker aligns with a structural shift, displacement, or prevailing directional bias.
5. Observe subsequent price interaction with the breaker zone for confirmation or invalidation.
6. Establish risk parameters independently before considering an entry.
The indicator is intended to support this analytical process rather than automatically determine trade entries or exits.
---
### Final Considerations
Market Strategies - FVG Breakers v2 combines systematic Fair Value Gap inversion detection, breaker-zone visualization, overlap filtering, mitigation-based invalidation, and configurable alerts into a focused price-action tool.
Its central purpose is to help traders identify areas where previously established imbalances have changed directional significance.
**Special attention should be given to FVG breakers forming near significant swing highs and swing lows, particularly following failed breakouts, liquidity sweeps, or changes in market structure.**
These locations can provide meaningful context for evaluating potential reversals, continuation opportunities, and subsequent price reactions.
FVG breakers should not be interpreted as guaranteed trading signals. No single formation ensures a particular market outcome, and all trading decisions should incorporate independent analysis, appropriate risk management, and prevailing market conditions.
Release Notes
### What's New – Market Strategies FVG Breakers v2This update introduces enhanced **Smart Money Concepts (SMC) breaker logic and visualization** for more precise identification of FVG inversions.
- **SMC-Style Breaker Splitting:** Original FVGs and converted breakers now appear as two distinct, connected sections.
- **Improved Visualization:** Solid midpoint lines represent original FVGs, while dashed lines identify converted breakers.
- **Refined Detection:** Updated FVG formation, mitigation, invalidation, and overlap filtering using SMC logic.
- **Expanded Display:** Increased the default Show Last setting to 30.
- **Extended FVG Zones:** Enabled Extend FVG by default, allowing active FVG and breaker zones to project to the right until invalidated.
- **Enhanced Colors:** Increased bullish and bearish breaker visibility for clearer identification.
- **Breaker Alerts:** Bullish, bearish, and combined breaker formation notifications.
These improvements help traders identify FVG conversions and potential reaction zones more clearly, particularly around **swing highs, swing lows, liquidity sweeps, and market structure shifts.**

Disclaimer
The information and publications are not meant to be, and do not constitute, financial, investment, trading, or other types of advice or recommendations supplied or endorsed by TradingView. Read more in the Terms of Use.
Disclaimer
The information and publications are not meant to be, and do not constitute, financial, investment, trading, or other types of advice or recommendations supplied or endorsed by TradingView. Read more in the Terms of Use.