Ichimoku with ADXMy first attempt at coding a strategy in pine script. The strategy tests for a confluence of bull / bear signals and executes a trade when these are met. It uses the ADX as a screen against fake breakouts.Strategyby HappyHobo1162
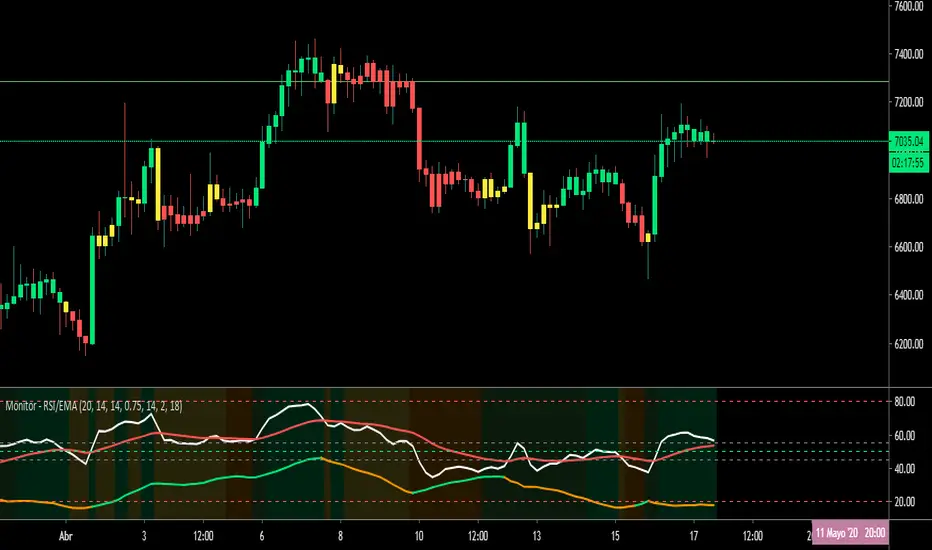
Estrategia de Monitor - RSI/EMAThis indicator, competes the signals of two of the most important and reliable indicators for monitoring price trends, the Squeeze Monitor and the RSI. For a better visualization of the relationship of the indicators with the price, the Squeeze Monitor is presented in colored bars that represent the trend of the indicator. The RSI is combined with the EMA of the RSI that supports its directionality. As additional support for decision making, the ADX is also plotted, as an element to project thIndicatorby suarezce13418
Directional Movement Index TrendThis DMI I modified to see the trend more clearly, and the ADX line changes according to the trend force, which is perfectly configurable, the configuration I left my default configuration, in case you want to modify it because you see the trend in different values, feel free, and basically the columns are the average of DI and also indicate the trend more clearly. ///////////////////////////////////////////////////////////////////////////////////////////////////////////////////////////////////Indicatorby MarqxUpdated 18481
Wolfs ADX + DII have created an alternative visualisation of the ADX + DI indicator created by MasaNakamura, credits to them for providing the source code! :-) The histogram represents the distance between the DI+ and the DI-. The crossing of the histogram is equal to the crossing of the DI lines. The ADX line is coloured based on the threshold. This creates a clean representation of the ADX + DI.Indicatorby itsHowlingWolf2378
[PX] ADX BoxesHello guys, today I would like to share an indicator that I had in my mind for quite some time. I call it ADX Boxes. How does it work? What the indicator does is very simple. Whenever the ADX falls below a certain threshold (which can be managed in the user input settings) a box will appear. The box will continue to grow as long as the ADX stays below the threshold. Once the ADX goes back above the threshold, the box will stop growing and will set its right border. There are two modes, whIndicatorby paaaxUpdated 31 2 K
RedK_Directional Index / K xDMIHere's a modern take on the famous DMI/ADX. i first wrote this on another platform few years ago, so i'm happy to be able to share it on TradingView quick refresher: what does DMI/ADX tell us: ------------------------------------------------------ in simple terms, at the core of this indicator, there are 3 main calculations / lines: the Plus Directional Index ( +DI ) which represents how much the bulls are able to push the high of a bar compared to previous one, the Minus Directional Index ( -Indicatorby RedKTrader7760
Ultimate Momentum IndicatorThis is an indicator I've been playing with for a while, based on my previous MACD w/ RSI Warning indicator. This one takes it a step further, including information from MACD, RSI, ADX, and Parabolic SAR. These four indicators are represented in this indicator as follows: MACD: The histogram itself is a normal MACD histogram. Nothing strange about it, and you can adjust the settings for it just as you would a normal MACD. RSI: Any time the RSI is outside of normal ranges (which can be adjIndicatorby JoshJaySalazar8462
Stochastic Pop and Drop by Jake Bernstein v1 [Bitduke]I found a simple strategy by Jake Bernstein, modified it a little and created a strategy with Risk Management System (SL+TP); After that I test it on the different cryptocurrency pairs. About the Indicator Basically it's the strategy of 2 indicators: Stochastic Oscillator to define the bias and Average Directional Index to confirm it. One again, It uses Stochastic Oscillator to define the trading bias. In particular, the trading bias was deemed bullish when the weekly 14-period Stochastic OStrategyby Bitduke3370
[PX] ADX and DI v4Hey guys, I recently used the "ADX and DI" indicator in a variety of my own scripts. Because I keep on developing version 4 scripts and the "ADX and DI" indicator is developed in one of the previous PineScript versions, I had to update the old script every time I wanted to use it. I decided to publish the updated version and also changed a few things: - ADX color is now orange - Instead of plotting the DI+ and DI- lines, it's filling the space between the two (can be changed in the "style"-secIndicatorby paaax6396
ADX Adaptive StochasticStandart stochastic with dynamic period, based on ADXIndicatorby laptevmaxim92Updated 2108
Directional Movement Index + Average Directional IndexPersonal DMI and ADX script ADX color change from positive vs negative momentum DMI Color fill based on DMI+/- positive momentum No fill color during lack of momentumIndicatorby KondrackiKarlUpdated 4581
(JS)DMI BarsAlright - so this is my own version of John Carter's "10x Bars"... I have done multiple things that are different from his version so they are slightly different.. So first of all the main indicator is based off of the ADX and the DMI; For those who aren't familiar with it, Directional Movement is what you'd pull up under "built-in's" from the indicators tab (if you want to check it out). The standard interpretation of this however, is when the ADX is above 20 that suggests the trend is stroIndicatorby J-StreakUpdated 11832
RSX-D [ID: AC-P]The "AC-P" version of Jaggedsoft's RSX Divergence and Everget's RSX script is my personal customized version of RSX with the following additions and modifications: LSMA-D line that averages in three LSMA components to form a composite, the LSMA-D line. Offset for the LSMA-D line is set to -2 to offset latency from averaging togther the LSMA components to form a composite - recommended to adjust to your timeframe and asset/pair accordingly. Divergence component from JustUncle, RicardoSantosIndicatorby UnknownUnicorn279684115 1.4 K
DAX Shooter 5M StrategyThis is a simple strategy that applies very well for scaling indices to 5 minutes especially for the DAX. The algorithm provides for buying or selling when the market is very "pulled". The rules are as follows: you buy when: 1- The ADX indicator with the standard settings is greater than 32. 2- the RSI indicator set to 7 periods is crossing upwards the oversold line at 30 3- the candle minimum is lower than the lower band of bollinger bands set to 50 periods. is sold when: 1- ADX indicator witStrategyby th3web3 1.2 K
ADX Di+ Di- [Gu5]Fill indicates Strong Trend Cross indicates End of Trend -- El relleno indica una fuerte tendencia cuando el Di supera "Level Trend" El cruce de Di+ con Di- indica el fin de la tendencia Cuando el valor del ADX es menor a "Level Range", estamos en RangoIndicatorby gu5tavo71Updated 82 5.6 K
London_NYThis is a session indicator that is one color from beginning of London Session to end of New York Session.Indicatorby jslfx221144
ADX indicatorUsed for trendanalysis - fill colors give the user an idea of trend direction - and/or shift in trend. EnjoyIndicatorby NikoBellic90165
ADX GapperBased on the ADX Gapper strategy described in the book Street Smarts, it looks to exploit retracement to a prevailing trend when there has been a gap away from the trend, giving you multiple potential entries. It uses the ADX to determine a trend and detects when there is a gap to signal an entry day where: You would enter short if the DI-(red line) > DI+ (green line), ADX (blue area) > 30 indicating a strong trend and if there is a gap up from the previous day. If all the described conditions Indicatorby the_no_factor165
ADX and DI With Coloured Histogram BUY/SELLWe display here the ADX has a colored histogram, which is - green when ADX and DI+ are higher then DI-, while the ADX is increasing, meaning that we are in a potential uptrend--> we should rather be long (only buy if you have other concordant signals !) - red when ADX and DI- are higher then DI+, while the ADX is increasing, meaning that we are in a potential downtrend --> we should rather be short (only sell if you have other concordant signals !) - not visible if none of these conditions areIndicatorby Montdouan-De-Sprimont5 1.3 K