Strategy

Harmonic Periodicity Matrix [Pineify]Harmonic Periodicity Matrix — Multi-Cycle Stochastic Oscillator with Momentum Ribbon & Adaptive Signals
The Harmonic Periodicity Matrix is an advanced cycle-detection oscillator that identifies market rhythm, momentum shifts, and high-probability reversal zones by harmonically combining three stochastic waves at different periodicities. Rather than relying on a single fixed lookback window — which inevitably misses cycles of differing durations — this indicator synthesizes a short-cycle , a primary-cycle , and a long-cycle stochastic into a single composite wave. The result is a smoother, more robust picture of where the market currently sits within its natural oscillation pattern.
Key Features
Three harmonically spaced stochastic cycles fused into one composite wave
Weighted Moving Average (WMA) smoothing to reduce noise without excessive lag
EMA-based signal line that generates precise momentum-crossover triggers
Dynamic gradient coloring that visually encodes cycle strength and direction
Momentum Ribbon fill between the cycle wave and signal line for at-a-glance bias confirmation
Overbought / Oversold reference zones with subtle background shading
Filtered Buy and Sell signals that fire only when reversals originate from extreme cycle territory
How It Works
At its core, the indicator computes three stochastic oscillators (%K) across three harmonically related lengths derived from a user-defined Primary Cycle Length :
Short cycle — half the primary length ( cycleLen / 2 ), capturing fast intraday or shorter-term oscillations.
Primary cycle — the user-defined length ( cycleLen ), representing the dominant market rhythm.
Long cycle — 1.5× the primary length ( cycleLen × 1.5 ), anchoring the broader trend context.
These three stochastic readings are averaged into a single composite cycle and then smoothed with a Weighted Moving Average (WMA) over the user-defined Smoothing Factor . Subtracting 50 centers the result around zero (range: −50 to +50), making overbought and oversold conditions immediately intuitive.
A Signal Line — an EMA calculated over twice the smoothing period — acts as a lagging reference. Crossovers between the composite wave and the signal line mark momentum inflection points.
Trading Ideas and Insights
Zero-line crosses — When the composite wave crosses above 0, market momentum is transitioning bullish; below 0 signals bearish transition.
Overbought / Oversold extremes — Readings above +25 indicate potential exhaustion; readings below −25 indicate potential recovery opportunity.
Signal crossovers from extremes — The highest-conviction signals occur when the wave crosses the signal line while already in oversold (< −15, Buy) or overbought (> +15, Sell) territory.
Momentum Ribbon color — A green ribbon confirms bullish momentum continuation; a red ribbon warns of bearish pressure even if price is still rising.
How Multiple Indicators Work Together
The power of the Harmonic Periodicity Matrix comes from the deliberate combination of three stochastic oscillators and two moving average types:
The three stochastics represent different frequency bands of market activity — fast, medium, and slow. Averaging them suppresses random noise that would appear in any single stochastic while preserving genuine cyclical structure that repeats across all three timeframes simultaneously.
The WMA smoothing is applied to the averaged cycle rather than to each individual stochastic. WMA front-weights recent data, keeping the smoothed line more responsive than a Simple Moving Average while avoiding the excessive lag of longer EMAs — the ideal balance for a cycle oscillator.
The EMA signal line is computed over a longer period (2× the smoothing factor), intentionally lagging behind the main wave. This lag creates meaningful crossover events: when the faster composite wave crosses the slower signal line, it indicates a genuine shift in momentum rather than a transient fluctuation.
The gradient coloring system encodes amplitude into color, providing an instant visual read of cycle intensity that raw numbers cannot convey. The background zone shading reinforces awareness of extreme readings without cluttering the visual space.
Together, these components form a self-contained cycle analysis system: the three stochastics define the oscillation, the WMA refines it, the EMA signal line contextualizes momentum, and the visual layer communicates everything instantly.
Unique Aspects
Harmonic period spacing — Using 0.5×, 1×, and 1.5× ratios is inspired by harmonic analysis principles, where related frequencies reinforce true cyclical signals and cancel spurious noise.
Amplitude-coded gradient — Color intensity scales with distance from zero (0→40 bullish, −40→0 bearish), making it easy to distinguish a mild rebound from a powerful trend.
Filtered signals — Buy signals require the crossover to occur below −15; Sell signals require it above +15. This prevents signal generation in neutral mid-range territory where momentum reversals are statistically less reliable.
Zero-centered display — Centering around 0 (rather than displaying 0–100) aligns naturally with how traders think about bullish vs. bearish bias.
How to Use
Add the indicator to any chart and timeframe. It plots in a separate panel below the price chart.
Watch for green circles (Buy signals) — these appear when the cycle wave crosses up through the signal line from oversold territory (below −15).
Watch for red circles (Sell signals) — these appear when the cycle wave crosses down through the signal line from overbought territory (above +15).
Use the Momentum Ribbon fill color to confirm trend direction before entering trades.
Pay attention to the overbought (+25) and oversold (−25) zones — readings beyond these thresholds suggest cycle exhaustion and potential reversal.
Combine with price action or volume analysis for additional confirmation before executing trades.
Customization
Primary Cycle Length (default: 20) — Increase for longer-term swing cycle detection; decrease for faster, shorter-term cycle tracking.
Smoothing Factor (default: 6) — Higher values produce a smoother wave with more lag; lower values are more reactive but noisier.
Bullish Wave color — Default green (#089981); customizable.
Bearish Wave color — Default red (#F23645); customizable.
Equilibrium color — Default gray (#787b86); customizable.
Conclusion
The Harmonic Periodicity Matrix offers a methodologically grounded approach to market cycle analysis by combining multi-frequency stochastic decomposition, adaptive smoothing, and momentum-crossover detection into a single, visually intuitive oscillator. It is designed for traders who want more than a standard stochastic — those who seek to understand the rhythm of the market across multiple cycle lengths simultaneously. Whether you are swing trading, trend following, or timing entries within a larger move, this indicator provides a structured, repeatable framework for identifying when momentum is genuinely shifting versus when the market is simply oscillating in neutral territory. Indicator

Indicator

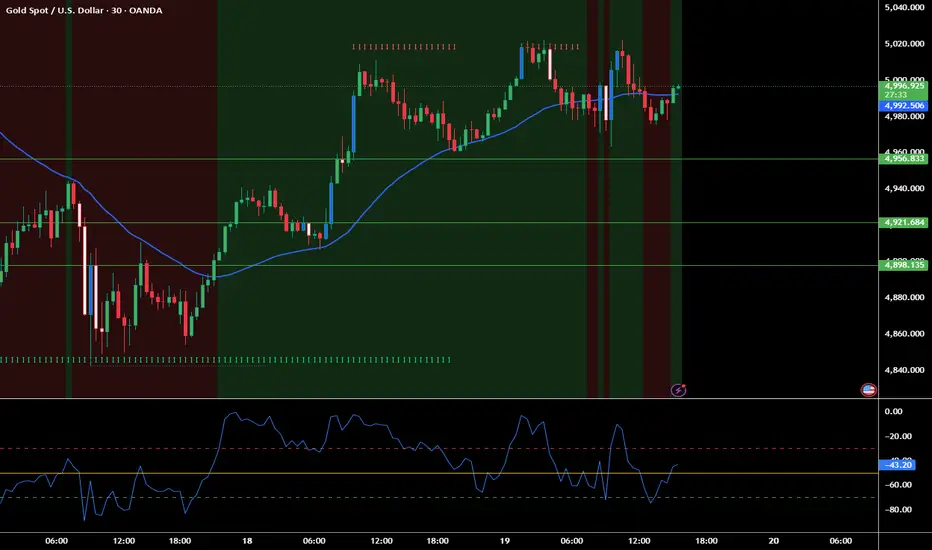
Spira Alligator This is an trend-following pullback system inspired by Bill Williams’ Alligator, but built to operate as a purely mechanical signal system. It’s designed for traders who want to:
Follow the main trend
Buy or sell on pullbacks back into the trend
Use simple, visual logic without having to interpret too many “subtle” patterns
How it works
The Alligator lines (Lips, Teeth, Jaw) visualize trend direction and strength.
A separate trend line (default EMA 144) is used as a long-term trend filter.
The system detects a pullback back to the Teeth (Lips crosses once against the trend and then crosses back), but only when price is on the correct side of the trend line.
When the conditions are met, it prints:
A BUY signal when price is above the trend line
A SELL signal when price is below the trend line
How to use it
Add Spira Alligator to TradingView and enable the line + signal display.
Use BUY signals as candidate entries in an uptrend (price above the trend line).
Use SELL signals as candidate entries in a downtrend (price below the trend line).
Use the background color to quickly spot when an active signal event occurs.
This logic is meant as a starting point—add your own risk management (stop-loss, take-profit, confluence with other indicators) as needed.
Important notes
This is not the classic Alligator approach, but a systematic variation that produces clear, mechanical signals.
It’s made for testing and experimentation, and is especially suitable for trend-following traders who prefer simple but robust logic. Indicator

Indicator

Fractal Structure Model [Pro]Fractal Structure Model
A professional-grade multi-timeframe price action indicator that automates the identification of expansion setups by analyzing lower timeframe movements within higher timeframe candle structures.
<h
🔷 What This Indicator Does
Markets move in fractal cycles — alternating between contraction (consolidation) and expansion (directional movement). This indicator detects the precise moment when expansion is likely to begin by combining:
Higher Timeframe directional candle closures
Lower Timeframe confirmation through Change in State of Delivery (CISD)
Automated projection of future price targets
Real-time setup tracking with success/failure detection
⚙️ Core Components
1. Automatic Timeframe Pairing
The indicator intelligently pairs your chart timeframe with a higher timeframe for multi-timeframe analysis:
1min → 5min
3min → 15min
5min → 1Hour
15min → 4Hour
1Hour → Daily
4Hour → Weekly
Manual override is available for custom pairings. The indicator validates pairings and displays warnings for invalid configurations.
2. HTF Power of Three (PO3) Candles
Visualizes the higher timeframe candle directly on your lower timeframe chart:
Translucent body box (open to close range)
Wick lines extending to high and low
Dashed open price reference line
Timeframe badge label
This allows you to observe how micro price action constructs the macro candle — identifying accumulation, manipulation, and distribution phases in real time.
3. Change in State of Delivery (CISD)
The CISD is the confirmation signal that price has shifted from one directional bias to another.
Bullish CISD Logic:
text
- Price was making lows (testing swing low area)
- A candle closes above its open AND above the previous candle's high
- This signals sellers have exhausted and buyers are taking control
Bearish CISD Logic:
text
- Price was making highs (testing swing high area)
- A candle closes below its open AND below the previous candle's low
- This signals buyers have exhausted and sellers are taking control
Visual: A highlighted box around the CISD candles with a directional label.
Use Case: After the 1-Hour candle closes bullish, you watch the 5-minute chart for a bullish CISD near a swing low. When it triggers, it confirms that the new hour is likely to continue expanding upward.
4. Setup Detection
A complete setup requires two conditions:
Condition Description
HTF Directional Close The previous HTF candle closed bullish or bearish
LTF CISD Confirmation A change in delivery state occurs on the lower timeframe
When both align, the indicator generates a setup signal with a bold vertical bar and a large directional label.
Use Case: The previous 4-Hour candle closed strongly bearish. On your 15-minute chart, you see price briefly push up into a swing high, then a bearish CISD fires. The indicator marks this as a Bear Setup, telling you expansion to the downside is probable.
5. Candle Tracking (C1 through C4+)
Once a setup triggers, the indicator tracks how many HTF candles have elapsed:
Label Meaning Color
C1 ✓ First candle — setup just formed Gray
C2 ✓ Second candle — setup active and healthy Gray
C3 ⚠ Third candle — potential slowdown/consolidation Orange
C4 ⚠ Fourth candle — likely exhaustion Orange
Any ✗ Price returned to setup origin — failure Red
Failure Condition:
Bullish setup fails if price drops below the setup low
Bearish setup fails if price rises above the setup high
Use Case: You entered a bullish trade on C1. By C2, price has expanded nicely. On C3, the label turns orange — you consider tightening your stop or taking partial profits because momentum may be fading. If it turns red, you know the setup has been invalidated.
6. Equilibrium + Premium/Discount Zones
The Equilibrium (EQ) is the 50% level of the setup range (from setup high to setup low).
Zone Location Meaning
Premium Above EQ Price is expensive — favorable for shorts
Discount Below EQ Price is cheap — favorable for longs
Visual: Two shaded boxes with text labels ("PREMIUM" / "DISCOUNT") and a dashed EQ line.
Use Case: After a bullish setup fires, price retraces. You see it enter the discount zone (below 50%). This is your optimal entry area — buying at a discount within a confirmed bullish structure.
7. T-Spot Identification
The T-Spot marks where the higher timeframe candle's wick is anticipated to form — essentially a reversal or continuation point.
Calculation: 23.6% from the setup extreme (based on Fibonacci-like proportioning of the range).
Visual: A dotted line with a thin zone box and "T-SPOT" label.
Use Case: In a bullish setup, the T-Spot sits near the top of the range. If price reaches this level and shows signs of rejection, it may indicate the HTF candle's high wick is forming — a potential point to take profits or expect a pullback.
8. Projection Levels
Once a setup is confirmed, the indicator projects future price targets based on the range between the CISD price and the swing reference point.
Default Projections:
Level Calculation Purpose
-1× 1× the CISD range First target — minimal expansion
-2× 2× the CISD range Standard expansion target
-2.5× 2.5× the CISD range Extended target
-4× 4× the CISD range Full expansion
-4.5× 4.5× the CISD range Maximum expected expansion
Each projection has:
A solid line at the level
A thin zone box for visibility
A multiplier label (e.g., "-2×")
Progressive transparency (closer targets are more opaque)
Use Case: A bearish setup fires. You set your take-profit at the -2× projection. If price reaches -2× and shows exhaustion, you exit. If momentum continues, you trail toward -4×.
9. Formation Liquidity
Marks the previous HTF candle's high and low as critical liquidity levels.
Visual: Dotted horizontal lines labeled "LIQ $.H" (high) and "LIQ $.L" (low).
Use Case: Before a new setup forms, price often sweeps the previous candle's high or low to grab liquidity. Watching these levels helps you anticipate:
Where stop losses are clustered
Where engineered liquidity raids may occur
Potential reversal points after the sweep
10. Candle 1 Liquidity
Solid horizontal lines marking the setup's own high and low — the structural boundaries.
Use Case: These are your invalidation levels. If a bullish setup's low is broken, the setup fails. These lines give you a clear visual reference for stop-loss placement.
11. Swing Structure Markers
Small diamond symbols (◆) at detected swing highs and lows.
Use Case: Helps you see the market's structural rhythm — where swing points form relative to the HTF candle. Useful for identifying when price is building higher lows (bullish) or lower highs (bearish).
12. Bias Selection
Mode What It Shows
Bullish Only bullish CISD signals and setups
Bearish Only bearish CISD signals and setups
Neutral Both directions
Use Case: You've done your daily analysis and determined the market is in a bullish trend. You set bias to "Bullish" to filter out counter-trend bearish signals and focus exclusively on buy setups.
13. Time Filters
Three configurable UTC time windows. Setups outside these windows are ignored.
Example Configuration:
Session 1: 08:00 - 11:00 (London Open)
Session 2: 13:00 - 16:00 (New York Open)
Session 3: OFF
Use Case: You only want to trade during London and New York sessions because that's when the most volume and expansion occurs. The indicator automatically suppresses signals during Asia session or off-hours.
14. Professional Info Table
A dark-themed dashboard showing:
Field Example Value
Pairing 5 → 60
Status ✓ Valid
Bias ▲ Bullish
Setup ▲ Bull C2
Auto TF ● Enabled
Sessions 8:00-11:00 13:00-16:00
Total 12 setups
15. Alerts
Alert Trigger
Bullish Fractal Setup Full bullish setup confirmed
Bearish Fractal Setup Full bearish setup confirmed
Bullish CISD Bullish delivery change detected
Bearish CISD Bearish delivery change detected
Setup Failed Active setup invalidated
Trading Workflow — Complete Use Case
Scenario: Trading EUR/USD on the 5-Minute Chart
Step 1 — Preparation
- Open 5min chart
- Indicator auto-pairs to 1H HTF
- Set bias to "Neutral"
- Enable London + NY time filters
Step 2 — Wait for HTF Context
- Watch the PO3 candle building the current hour
- Previous 1H candle closed bullish
- Current hour opens → you watch for a pullback
Step 3 — CISD Confirmation
- Price pulls back to a 5min swing low
- A 5min candle closes above its open and above the prior high
- CISD marker appears → Bullish Setup triggers
- Labels, projections, EQ zones all appear automatically
Step 4 — Entry
- Price is in the DISCOUNT zone (below EQ)
- Enter long near the CISD level
- Stop loss below the C1 Liquidity low line
Step 5 — Management
- C1 label shows ✓ — setup is fresh
- Price reaches -1× projection → move stop to breakeven
- C2 label appears ✓ — momentum continues
- Price hits -2× projection → take 50% profit
- C3 label turns orange ⚠ — trail stop tightly
- Price reaches -2.5× → close remaining position
Step 6 — Failure Scenario
- If price drops below setup low before hitting targets
- C2 label turns red ✗
- Projections, EQ, T-Spot all disappear
- You exit the trade at your stop loss
Who Is This Indicator For?
Trader Type How They Use It
Day Traders 1min/5min charts paired with 15min/1H for intraday setups
Swing Traders 15min/1H charts paired with 4H/Daily for multi-day holds
Scalpers 1min charts paired with 5min for quick expansion trades
Analysts Use projections and structure labels for market commentary
Key Strengths
Non-repainting — levels remain stable once plotted
Fully automated — no manual drawing required
Multi-asset — works on forex, crypto, stocks, indices, commodities
Adaptive — auto-adjusts to any timeframe
Professional visuals — clean, institutional-grade appearance with black text on colored labels for maximum readability
Indicator

Strategy

Strategy
Indicator

Indicator

Indicator

Indicator

Indicator

Indicator

Indicator

Indicator

Indicator

Indicator

Piv X**Title:** Piv X: Confluence-Based Market Structure & Volume Analyzer
**Introduction**
Piv X is a comprehensive market structure analysis tool designed to grade the quality of Pivot Points using a composite "Confluence Score." Unlike standard indicators that simply identify local highs and lows based on price alone, this script evaluates the *strength* of every pivot by cross-referencing it against volume data, momentum divergences, multi-timeframe structure, and institutional key levels.
**Concept & Methodology**
The core functionality of this script builds upon a **Dynamic Pivot Quality Scoring System**. When a pivot point is detected (using an ATR-based dynamic lookback), the script runs a background analysis on 10+ technical factors to assign a "Confluence Score" (0-100).
The score is calculated based on the accumulation of the following factors:
1. **Volume Anomalies**: Detects volume spikes at the pivot, suggesting institutional participation.
2. **Momentum Divergence**: Checks for RSI and Williams %R divergences relative to price action to identify exhaustion.
3. **Liquidity Mechanics**: Identifies "Swing Failure Patterns" (SFP) and "Sweeps" where price pierces a previous structure but closes back inside.
4. **Multi-Timeframe Alignment**: Verifies if the pivot aligns with Higher Timeframe (HTF) trends and structures to filter out counter-trend noise.
5. **Key Level Interaction**: Rewards pivots that form near Daily/Weekly Highs or Lows.
6. **Fair Value Gap (FVG) Fills**: Detects if the pivot is reacting to a market imbalance fill.
**Unique Feature: Williams %R Divergence Anchored VWAP**
This tool introduces a logic-driven Anchored VWAP. Instead of arbitrarily anchoring VWAPs to high/low dates, the script automatically anchors a VWAP from the exact candle where a Williams %R Momentum Divergence is confirmed. This allows traders to visualize the "true cost basis" of participants who entered specifically on the momentum reversal signal.
**How to Use**
1. **Golden Zones (High Confluence)**: Pivots that achieve a high Confluence Score (e.g., >80) are highlighted with a distinct "Golden" border and background. These represent high-probability Support/Resistance levels backed by multiple forms of technical evidence.
2. **Standard Zones (Normal Confluence)**: Pivots with moderate scores are shown in standard Green/Purple. These are valid structure points but may require additional confirmation before trading.
3. **Trend Filtering**: The "Trend System" overlay (using EMA Clouds and RSI filters) provides visual context for the dominant trend direction, helping traders avoid taking structure signals against the main flow.
4. **Market Structure Shifts (MSS)**: The script automatically plots CHoCH (Change of Character) lines to alert traders when the sequence of Higher Highs or Lower Lows has been broken, often signaling a trend reversal.
**Settings**
* **Pivot Detection**: Adjust the ATR Multiplier to control the sensitivity of pivot detection.
* **Filters**: Toggle specific scoring factors (like Session Logic or HTF Confluence) to customize how strict the Scoring System is.
* **Visuals**: Enable/Disable specific VWAP periods (Weekly, Monthly, Yearly) to keep the chart clean.
**Disclaimer**
This tool is intended for market analysis and educational purposes only. Past performance of these setups does not guarantee future results.
Indicator

Williams Vix Fix Bottoms and Tops - DUAL MODEWilliams Vix Fix Bottoms and Tops - DUAL MODE
This is a DUAL implementation of Williams Vix Fix that evaluates both:
- LOWS: potential downside exhaustion / bottom conditions.
- HIGHS: potential upside exhaustion / top conditions.
The goal is to combine statistical extremes with price-action confirmation and clear visual signaling.
Core calculations
LOWS mode:
WVF_LOWS = ((highest(close, pd) - low) / highest(close, pd)) * 100
HIGHS mode:
WVF_HIGHS = ((lowest(close, pd) - high) / lowest(close, pd)) * 100
For each mode, the script computes:
- statistical bands (SMA + stdev multiplier),
- percentile thresholds (lb with ph/pl),
- extreme-state conditions,
- and price-action/context filters (ltLB, mtLB, str).
Signals and bar coloring
Bars can be highlighted by 5 classes:
- Aggressive
- Filtered
- Entry
- Above Lines
- All Bars
In DUAL mode, LOWS and HIGHS are processed together with signal-priority layering to keep chart reading consistent.
Histogram and lines
- LOWS histogram: “Extreme” color in extreme conditions, “Normal” otherwise.
- HIGHS histogram: “Extreme” color in extreme conditions, “Normal” otherwise.
- Optional lines for statistical bands and percentile ranges.
Alerts
Includes:
- Williams Green Bar (LOWS)
- Williams Green Bar (HIGHS)
GreenBarLookBack controls lookback/consecutive logic for alert triggering.
How to use
- Tune parameters per symbol/timeframe.
- Use signals with structure confirmation and risk management.
- This is a decision-support tool, not a guaranteed-profit system.
Open-source reuse and credits
This script is based on the open-source indicator:
“Williams Vix Fix Bottoms and Tops” by theehoganator
Source:
This version adds and/or changes:
1) Dual simultaneous processing of LOWS and HIGHS.
2) Distinct visual logic for LOWS/HIGHS extremes and normal states.
3) Layered bar-color priority for signal classes.
4) Green-bar alert logic with configurable lookback.
5) Input/layout and signal presentation refinements.
Limitations
- Reversal signals can be early in strong trends.
- Behavior depends on volatility regime.
- Risk management is required.
Indicator

Luminous Market Breadth Pulse [Pineify]Luminous Market Breadth Pulse — Dual-Factor Breadth & Volume Oscillator
The Luminous Market Breadth Pulse is a market internals oscillator that fuses advance-decline breadth with up/down volume flow into a single, easy-to-read histogram. Rather than relying on price action of a single instrument, this indicator looks beneath the surface of the market to gauge the true health of participation across all listed stocks on the NYSE or NASDAQ. It answers a question that price alone cannot: Are the majority of stocks — and the majority of capital — moving in the same direction?
Key Features
Combines two independent breadth dimensions (advance-decline ratio and up/down volume ratio) into one unified oscillator.
Gradient-colored histogram that visually intensifies as market conviction strengthens.
Built-in signal line (WMA) for crossover-based entry and exit timing.
Supports both NYSE and NASDAQ breadth data with a single toggle.
Four ready-to-use alert conditions for bullish/bearish crossovers and zero-line transitions.
How It Works
The indicator is built on two normalized ratios, each scaled to a –100 to +100 range:
Advance-Decline Ratio — Calculated as (Advancing Issues – Declining Issues) / (Advancing + Declining) × 100. This captures the net directional bias of individual stocks. A reading near +100 means nearly every stock is advancing; near –100, nearly every stock is declining.
Up/Down Volume Ratio — Calculated as (Up Volume – Down Volume) / (Up Volume + Down Volume) × 100. This measures whether capital is flowing into advancing stocks or declining stocks. It adds a critical volume-confirmation layer that pure issue counts miss.
Raw Pulse — The simple average of the two ratios above. Equal weighting ensures that neither breadth nor volume dominates the reading, giving a balanced composite view.
Smoothed Pulse (EMA) — The raw pulse is smoothed with an Exponential Moving Average controlled by the "Pulse Length" input. EMA was chosen because it reacts quickly to shifts in market internals while still filtering single-day noise.
Signal Line (WMA) — A Weighted Moving Average of the smoothed pulse. WMA places more emphasis on recent values than SMA, making it a responsive yet stable reference for crossover signals.
How Multiple Indicators Work Together
The core design philosophy is confirmation through independent data streams . Advance-decline data tells you how many stocks are participating in a move, while up/down volume data tells you how much capital is behind that participation. A rally where many stocks advance but volume is weak scores lower than a rally where both breadth and volume confirm strength. By averaging these two dimensions, the Luminous Pulse filters out misleading signals that either metric alone might produce — for example, a narrow large-cap rally that lifts volume but leaves most issues flat, or a broad advance on thin volume that lacks institutional conviction.
The EMA-smoothed pulse and WMA signal line form a dual-speed system similar in concept to MACD, but applied to market internals rather than price. When the faster pulse crosses above the slower signal, it suggests broadening participation and increasing volume commitment — an early sign of sustainable momentum. The reverse crossover flags deteriorating internals before price may reflect it.
Trading Ideas and Insights
Crossover entries — A bullish signal fires when the pulse crosses above its signal line, indicating improving breadth and volume. A bearish signal fires on the opposite crossover. These work well as confirmation filters alongside price-based setups.
Zero-line regime filter — When the pulse is above zero, market internals favor the bulls; below zero, the bears. Use this as a trend filter: only take long setups when the pulse is positive, and short setups when negative.
Divergence analysis — If the index makes a new high but the Luminous Pulse prints a lower high, internal participation is weakening — a classic breadth divergence that often precedes corrections.
Gradient intensity — The histogram color transparency reflects conviction strength. Deep, vivid bars signal strong consensus; faded bars warn of indecision even if the reading is technically bullish or bearish.
Unique Aspects
Unlike single-factor breadth indicators (e.g., a standalone Advance-Decline Line or McClellan Oscillator), this tool merges issue-count breadth with volume-weighted breadth into one normalized score, reducing false signals from either dimension alone.
The gradient-mapped histogram provides an instant visual gauge of conviction without requiring additional overlays or secondary panels.
All breadth data is pulled on a daily timeframe regardless of your chart's resolution, ensuring consistent readings and avoiding intraday noise artifacts that can distort breadth calculations on lower timeframes.
How to Use
Add the indicator to any chart. It works independently of the charted symbol since it reads exchange-level breadth data.
Select your preferred exchange (NYSE or NASDAQ) in the settings.
Adjust Pulse Length for sensitivity — lower values react faster to shifts in market internals; higher values produce smoother, more deliberate signals.
Adjust Signal Smoothing to control how quickly the signal line tracks the pulse. A shorter smoothing period generates more frequent crossovers; a longer one filters out minor fluctuations.
Use the built-in alert conditions to receive notifications for bullish/bearish crossovers and zero-line transitions without watching the chart.
Customization
Exchange — Toggle between NYSE and NASDAQ to analyze the breadth of your preferred market.
Pulse Length — Controls the EMA period applied to the raw pulse. Default is 10.
Signal Smoothing — Controls the WMA period for the signal line. Default is 5.
Colors — Fully customizable bullish, bearish, and signal line colors to match any chart theme.
Conclusion
The Luminous Market Breadth Pulse gives traders a window into the internal engine of the market. By combining advance-decline breadth with volume flow and presenting the result as a gradient-colored oscillator with a built-in signal line, it offers a concise yet powerful tool for gauging market health, timing entries, and spotting divergences — all from a single indicator panel.
Indicator

Indicator

Indicator