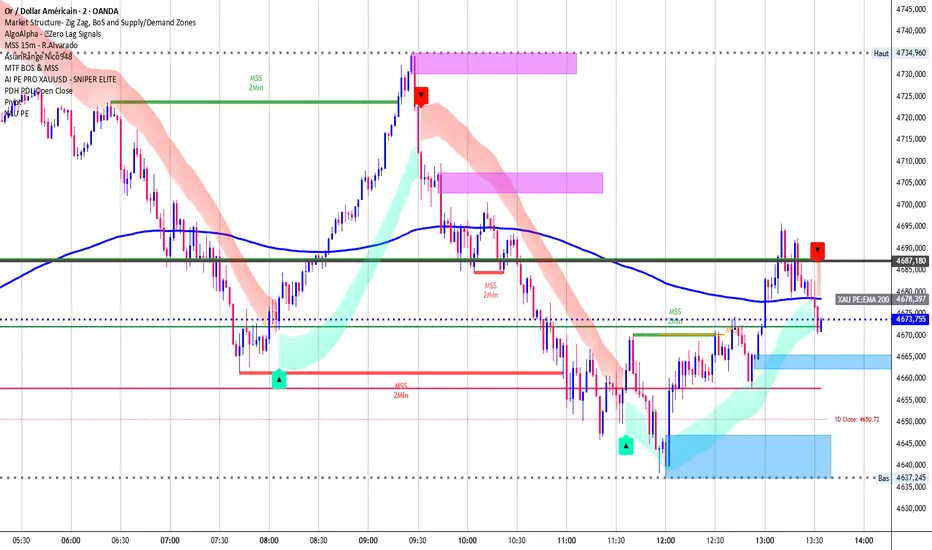
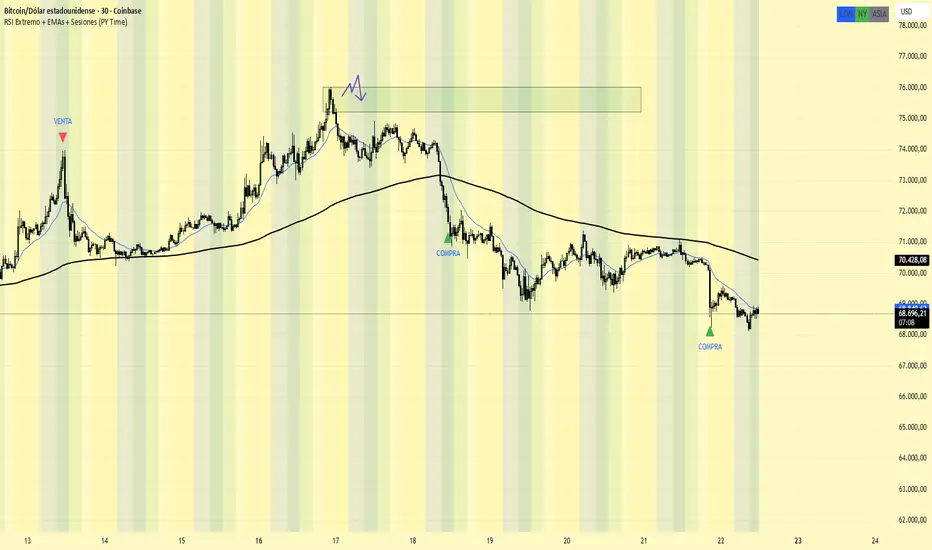
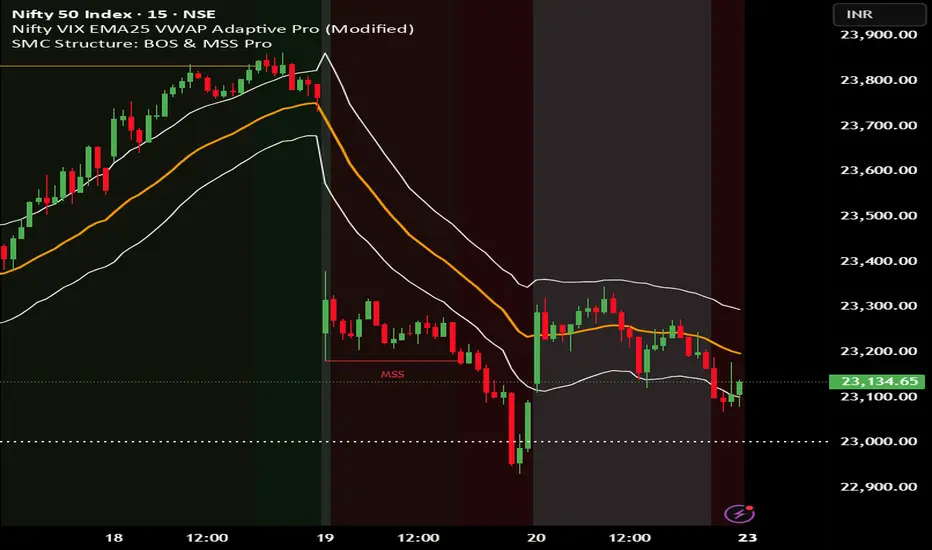
ATR Daily TargetsThis indicator plots the daily opening price and six ATR-based price targets directly on your chart, giving you a clear visual map of the day's expected range before price even moves.
How it works:
Each session, the indicator anchors to the daily open and calculates six target levels using the 14-period Average True Range (ATR) — three above and three below:
±50% ATR — first target, useful for quick scalps or partial profit taking
±75% ATR — mid-range target, a common area of resistance/support within the day
±100% ATR — full daily range target, represents a statistically significant move for the session
All levels are derived from the daily ATR regardless of what timeframe you're viewing, so the targets are consistent whether you're trading on a 1-minute, 5-minute, or 1-hour chart.
Features:
Daily open line plotted prominently for easy reference
Color-coded target lines above and below the open (fully customizable)
Green and red shaded zones showing the expected upside and downside range
Price labels on the right side of each level so you always know the exact target price
Info table (top-right corner) displaying all target prices and a live ✔ indicator when price has reached each level during the session
6 built-in alert conditions — one for each target level in both directions
ATR length is adjustable (default: 14)
All colors are customizable via the settings panel
Best used with: Intraday timeframes (1m, 5m, 15m, 30m, 1h). Pairs well with price action strategies like The Strat, ICT, or any open-drive methodology where the daily open is a key reference point. Indicator

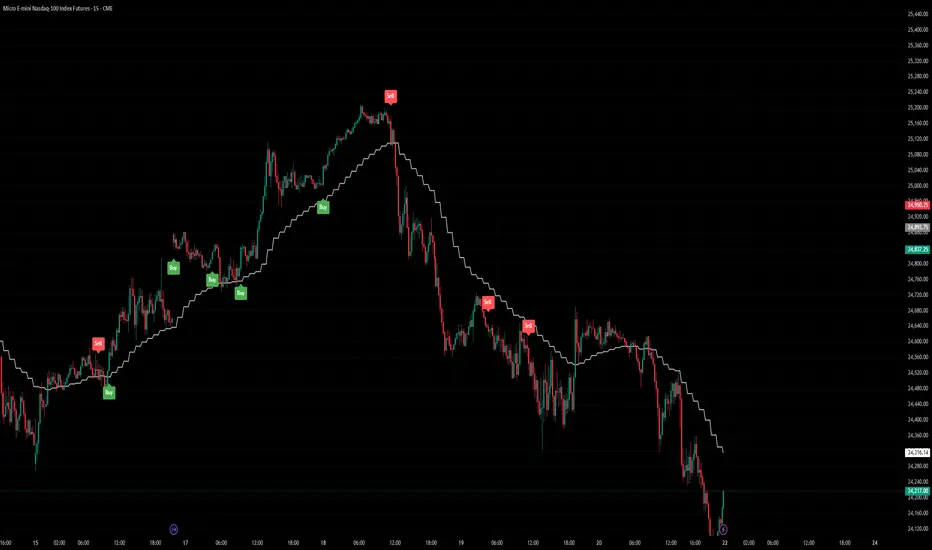
AYN-Replicated [Ryan] v4 + HTF BiasThe modified AYN Ryan script is a TradingView Pine Script strategy built to turn the original AYN-style visual trend and reversal logic into a testable, rules-based trading system. It is designed to identify bullish and bearish entry opportunities using the script’s custom trend calculations, cross or flip conditions, and confirmation filters, then automatically manage trades with defined stop-loss and take-profit rules rather than just plotting signals on the chart. In your versions, the script has been adjusted to improve stability, reduce false triggers, and better suit fast intraday futures trading by tuning sensitivity inputs such as cross strength, flip confirmation, ATR-based risk controls, and trade timing behaviour, while also focusing on practical issues like making sure both long and short setups work properly, avoiding over-filtering that kills all trades, and forcing positions to close within your session rules instead of holding overnight. Indicator

Indicator

Indicator

Strategy

Adaptive Flow Analyzer [JOAT]Adaptive Flow Analyzer
Introduction
The Adaptive Flow Analyzer is an advanced open-source volatility regime classification indicator that combines dynamic regime detection, entropy analysis, adaptive bands, and momentum waves into a unified flow state system. This indicator helps traders identify whether the market is trending, ranging, or choppy by analyzing volatility patterns, price distribution entropy, and momentum characteristics in real-time.
Unlike basic volatility indicators that simply show ATR or Bollinger Bands, this system classifies market conditions into actionable regimes and recommends appropriate trading strategies. Trending regimes favor breakout and trend-following approaches, ranging regimes favor mean-reversion strategies, and choppy regimes signal to avoid trading. The indicator is designed for traders who understand that different market conditions require different strategies and that regime identification is critical for consistent profitability.
Why This Indicator Exists
This indicator addresses a fundamental challenge in trading: applying the right strategy to the right market condition. Most traders lose money because they use trend-following strategies in ranging markets or mean-reversion strategies in trending markets. By combining multiple regime analysis methodologies, this indicator reveals:
Volatility Regime Detection: Classifies markets as Trending, Ranging, or Choppy based on volatility ratio and directional alignment
Entropy Analysis: Measures price distribution chaos using information theory - high entropy = uncertainty, low entropy = order
Adaptive Bands: Dynamic upper/lower bands that adjust to volatility - shows price position relative to extremes
Momentum Waves: RSI rate-of-change visualization showing momentum acceleration and deceleration
Chaos Zones: Identifies extreme uncertainty periods when trading should be avoided
Strategy Recommendations: Suggests Trend Follow, Mean Revert, or Avoid based on current regime
Each component provides a different lens on market flow. Regime classification shows condition, entropy shows uncertainty, bands show extremes, momentum shows acceleration, and chaos zones show danger. Together, they create a comprehensive view of market state.
Core Components Explained
1. Volatility Regime Detection
The indicator classifies markets into three regimes using volatility ratio and trend alignment:
atr = ta.atr(14)
atrSma = ta.sma(atr, 50)
volRatio = atr / atrSma
// Trending: Aligned EMAs + normal volatility
trendStrength = (ema9 > ema21 and ema21 > ema50) or
(ema9 < ema21 and ema21 < ema50)
regime = volRatio > 1.5 ? 0 : // Choppy
trendStrength ? 2 : // Trending
1 // Ranging
Regime classification:
Trending (2): EMAs aligned + volatility ratio < 1.5 - directional market with follow-through
Ranging (1): EMAs not aligned + volatility ratio < 1.5 - oscillating market with mean reversion
Choppy (0): Volatility ratio > 1.5 - erratic market with no clear pattern
The indicator displays regime with color-coded background and text in dashboard. Trending = green, Ranging = orange, Choppy = red.
2. Entropy Calculation
Entropy measures the randomness or uncertainty in price distribution using information theory:
The indicator:
Collects price changes over lookback period (default 50 bars)
Creates histogram by dividing changes into bins (default 10 bins)
Calculates Shannon entropy: -Σ(p * log(p)) where p = probability
Normalizes to 0-100 scale for easy interpretation
Entropy interpretation:
High entropy (>70): Price changes are random and unpredictable - high uncertainty
Medium entropy (40-70): Moderate predictability - mixed conditions
Low entropy (<40): Price changes are ordered and predictable - low uncertainty
High entropy warns of chaotic conditions where patterns break down. Low entropy confirms regime reliability. The indicator plots entropy as a gradient area chart (green to red).
3. Adaptive Bands System
Adaptive bands adjust to volatility and show price position relative to extremes:
ma = ta.sma(close, 50)
upperBand = ma + (atr * 2.0)
lowerBand = ma - (atr * 2.0)
// Normalize price position to 0-100
pricePosition = (close - lowerBand) / (upperBand - lowerBand) * 100
The indicator displays:
Price position oscillator (0-100 scale)
Reference lines at 0 (lower band), 50 (middle), 100 (upper band)
Multi-layer glow effect on position line for visibility
Color changes based on regime (green for trending, orange for ranging, red for choppy)
Price position interpretation:
Above 75: Overbought - expect mean reversion in ranging regime
Below 25: Oversold - expect mean reversion in ranging regime
Sustained above 50: Bullish in trending regime
Sustained below 50: Bearish in trending regime
4. Momentum Waves
Momentum waves visualize RSI rate-of-change to show acceleration and deceleration:
rsi = ta.rsi(close, 14)
rsiMomentum = ta.change(rsi, 3)
momentumStrength = math.abs(rsiMomentum) / 10 * 100
The indicator plots momentum as gradient area chart:
Green gradient: Positive momentum (RSI rising)
Red gradient: Negative momentum (RSI falling)
Intensity: Stronger color = faster momentum change
Height: Taller wave = larger momentum shift
Momentum waves reveal:
Acceleration into trends (expanding waves)
Deceleration at reversals (contracting waves)
Momentum divergence from price (warning signal)
Momentum exhaustion (extreme waves followed by collapse)
5. Chaos Zone Detection
Chaos zones occur when entropy exceeds threshold (75) AND volatility ratio exceeds 1.5:
inChaosZone = entropyNormalized > 75 and volRatio > 1.5
When chaos zone is active:
Pulsing red background appears
"CHAOS ZONE" label displays
Dashboard shows "CHAOS" flow state
Strategy recommendation changes to "AVOID"
Chaos zones represent extreme uncertainty where technical patterns break down. Trading during chaos zones typically results in whipsaws and losses. The indicator warns to stay flat.
6. Strategy Recommendations
Based on regime classification, the indicator recommends trading approach:
Trending Regime: "TREND FOLLOW" - Use breakout strategies, ride momentum, trail stops
Ranging Regime: "MEAN REVERT" - Fade extremes, buy support, sell resistance
Choppy Regime: "AVOID" - Stay flat, wait for regime clarity
The dashboard displays current recommendation with color coding. This prevents applying wrong strategy to wrong condition.
Visual Elements
Price Position Oscillator: Multi-layer glow line showing position in bands (0-100)
Reference Lines: Horizontal lines at 0, 50, 100 with gradient colors
Regime Background: Color-coded background (green/orange/red) based on regime
Entropy Area Chart: Gradient fill (green to red) showing uncertainty level
Momentum Waves: Gradient area chart showing RSI momentum
Chaos Zone Background: Pulsing red background during extreme uncertainty
Dashboard: Real-time regime state and strategy recommendations
The dashboard displays 9 key metrics:
1. Flow Regime (Trending/Ranging/Choppy)
2. Flow Ratio (volatility multiple)
3. Chaos Index (entropy percentage)
4. Strategy Mode (Trend Follow/Mean Revert/Avoid)
5. Momentum (Strong Up/Strong Down/Neutral)
6. Confidence (High/Medium/Low)
7. Flow State (Directional/Oscillating/Erratic/Chaos)
8. Position (Overbought/Oversold/Neutral)
Input Parameters
Flow Dynamics:
Flow Period: ATR calculation length (default: 14)
Band Multiplier: ATR multiple for bands (default: 2.0)
Equilibrium Period: Moving average length (default: 50)
Adaptive Bands: Enable dynamic band adjustment
Entropy Analysis:
Chaos Measurement: Lookback for entropy calculation (default: 50)
Distribution Bins: Number of histogram bins (default: 10)
Chaos Zones: Enable/disable chaos zone detection
Visualization:
Flow Bands: Show/hide adaptive bands
Regime Coloring: Enable/disable background colors
Entropy Overlay: Show/hide entropy chart
Momentum Waves: Show/hide RSI momentum
How to Use This Indicator
Step 1: Identify Current Regime
Check the dashboard for Flow Regime. This determines your trading approach. Trending = breakouts, Ranging = reversals, Choppy = avoid.
Step 2: Assess Chaos Index
Check entropy level. High chaos (>70) = unreliable patterns. Low chaos (<40) = reliable patterns. Only trade when chaos is low to medium.
Step 3: Check Strategy Recommendation
Dashboard shows recommended approach. Follow it. Don't use trend strategies in ranging markets or mean reversion in trending markets.
Step 4: Monitor Price Position
In ranging regime: Buy near 0-25 (oversold), sell near 75-100 (overbought). In trending regime: Stay with trend when above/below 50.
Step 5: Watch Momentum Waves
Expanding waves = acceleration (enter trends). Contracting waves = deceleration (prepare for reversal). Divergence = warning.
Step 6: Avoid Chaos Zones
When chaos zone activates (pulsing red background), close positions and wait. Don't trade during extreme uncertainty.
Best Practices
Regime determines strategy - always check before trading
High entropy + choppy regime = stay flat
Low entropy + trending regime = best trend-following conditions
Low entropy + ranging regime = best mean-reversion conditions
Momentum waves lead price - watch for acceleration
Chaos zones are dangerous - respect them
Confidence level in dashboard shows setup quality
Flow ratio > 1.5 = elevated risk regardless of regime
Position oscillator works differently in each regime
Regime changes take time to confirm - don't trade transitions
Indicator Limitations
Regime classification is retrospective - may lag at transitions
Entropy calculation requires sufficient data - unreliable on new instruments
Choppy regime can persist longer than expected
Adaptive bands can whipsaw during regime transitions
Momentum waves show acceleration, not direction
Chaos zones can have false positives during news events
The indicator shows current state, not future regime
Strategy recommendations are general - not specific entry signals
Regime classification may differ across timeframes
Technical Implementation
Built with Pine Script v6 using:
ATR-based volatility ratio calculations
EMA alignment for trend strength detection
Shannon entropy calculations with histogram binning
Adaptive band system with dynamic adjustment
RSI momentum rate-of-change analysis
Chaos zone detection with dual criteria
Multi-gradient visualization with pulsing effects
Real-time dashboard with 9 regime metrics
The code is fully open-source and can be modified to suit individual trading styles and preferences.
Originality Statement
This indicator is original in its comprehensive regime integration approach. While individual components (ATR, entropy, bands, RSI) are established concepts, this indicator is justified because:
It synthesizes volatility analysis, entropy theory, and momentum detection into unified regime classification
The entropy calculation applies information theory to price distribution for uncertainty measurement
Chaos zone detection combines entropy and volatility for extreme condition identification
Strategy recommendations adapt to regime in real-time
Momentum wave visualization shows RSI acceleration, not just level
The confidence scoring system quantifies regime reliability
Multi-gradient visualization with pulsing effects enhances regime awareness
Real-time dashboard presents 9 metrics simultaneously for holistic regime analysis
Each component contributes unique information: Regime shows condition, entropy shows uncertainty, bands show extremes, momentum shows acceleration, chaos shows danger, and strategy shows approach. The indicator's value lies in presenting these complementary perspectives simultaneously with unified classification and actionable recommendations.
Disclaimer
This indicator is provided for educational and informational purposes only. It is not financial advice or a recommendation to buy or sell any financial instrument. Trading involves substantial risk of loss and is not suitable for all investors.
Regime analysis is a tool for understanding market conditions, not a crystal ball for predicting future behavior. Trending regimes can become ranging. Ranging regimes can become choppy. Past regime patterns do not guarantee future regime patterns. Market conditions change, and strategies that worked historically may not work in the future.
The regime classifications displayed are analytical constructs based on current market data, not predictions of future market state. High confidence scores do not guarantee profitable trades. Users must conduct their own analysis and risk assessment before making trading decisions.
Always use proper risk management, including stop losses and position sizing appropriate for your account size and risk tolerance. Never risk more than you can afford to lose. Consider consulting with a qualified financial advisor before making investment decisions.
The author is not responsible for any losses incurred from using this indicator. Users assume full responsibility for all trading decisions made using this tool.
-Made with passion by officialjackofalltrades Indicator

Indicator

Indicator

Indicator
TX Volume Spike Overview:
TX Volume Spike Pro is a sophisticated technical analysis tool designed to identify high-probability breakout and breakdown opportunities in STOCK trading. The core philosophy is "Volume confirms price." By combining price action breakout levels with directional volume spikes and advanced momentum filters, this script helps traders filter out market noise and identify institutional accumulation or distribution.
Key Features:
Directional Volume Spike Logic: Unlike standard volume indicators, TX Pro distinguishes between Bullish Spikes (accumulation) and Bearish Spikes (distribution). A signal is only valid if the recent volume surge aligns with the candle's direction.
Hybrid Confirmation System: The "Hybrid" mode integrates several technical indicators—On-Balance Volume (OBV), Money Flow Index (MFI), and Volume Oscillator—to ensure that momentum and money flow are fully supporting the price move.
Breakout/Breakdown Engine: Automatically identifies dynamic resistance (High) and support (Low) levels based on user-defined lookback periods.
Institutional Trend Filter: Includes a 200-period SMA filter to ensure traders stay on the right side of the long-term trend, significantly reducing risk in trending markets.
Professional UI: Features clean visual plots of key levels, directional bar highlighting for volume anomalies, and optimized signal labels.
How to Use:
Bullish Signal (BUY): Triggered when the price crosses over the Resistance level, confirmed by a Bullish Volume Spike within the lookback window, and supported by Hybrid filters (OBV/MFI/VO) if enabled.
Bearish Signal (SELL): Triggered when the price crosses under the Support level, confirmed by a Bearish Volume Spike, and supported by momentum filters.
Recommended Setting: Use the "Hybrid (All Filters)" mode for stock trading to ensure maximum confirmation.
Disclaimer:
This script is a technical analysis tool and should not be considered financial advice. Always use proper risk management and stop-loss orders in your trading strategy. Indicator

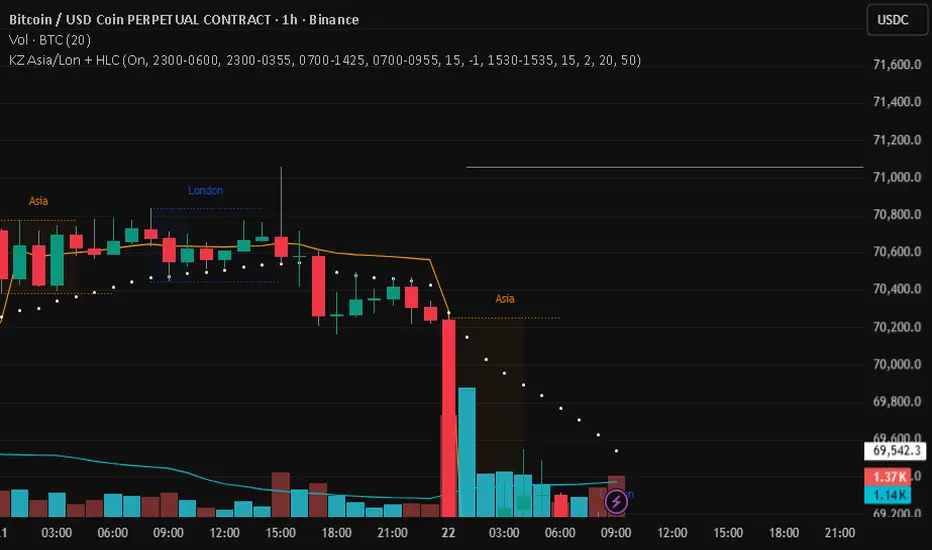
KillZones Asia/London + HLC + Custom SessionHere is a professional and engaging version of the description in English, optimized for the TradingView Public Library.
🚀 Asia/London KillZones & Dynamic HLC Levels
This "All-in-One" professional indicator is designed for intraday traders who need a clean, automated view of the most important price levels and operational time windows (KillZones). It combines the power of historical HLC (High, Low, Close) levels with institutional market sessions and customizable trend filters.
🔹 Key Features:
Asia & London KillZones: Automatically plots session ranges and specific KillZones for ICT/SMC setup hunting. Includes integrated alerts when the High or Low of a KillZone is swept.
Dynamic HLC Levels (Daily & Weekly): Automatically tracks key horizontal lines from previous periods:
PDH / PDL / PDC: Previous Day High, Low, and Close.
PWC: Previous Week Close.
Visual Optimization: Lines start from the current day’s open to keep the chart clean and focused on today’s price action.
Custom Session (Trigger Range): A unique feature to define a specific time bracket (e.g., 15:30-15:35 New York Open) and automatically project its High/Low range and a vertical reference line.
Trend & Momentum Filters: Includes a Session VWAP and two fully customizable EMAs (Exponential Moving Averages) for trend confirmation.
Total Customization: Every single module (KillZones, HLC levels, VWAP, EMAs) can be toggled on or off independently through an organized input panel.
🔹 Why use this script?
Instead of cluttering your chart with 5 or 6 different indicators, this script consolidates everything you need into a single, optimized tool. It is ideal for traders focusing on Liquidity Sweeps, Institutional Openings, and Price Action during the London and Asian sessions. Indicator

Triple Cloud SMA CrossoverTriple Cloud SMA Crossover (Adaptive Multi-Timeframe)
This indicator is designed for traders who value discipline and precision. By utilizing three distinct "Cloud" layers, it provides a comprehensive view of market momentum—from intraday scalping to long-term trend following—without ever requiring you to switch timeframes.
Key Technical Features
The Triple Cloud System:
Intraday/Fast: 20/50 SMA Crossover
Intermediate/Medium: 100/200 SMA Crossover
Macro/Long-term: 200/600 SMA Crossover
The "Cloud" Effect: Rather than simple lines, the space between these moving averages forms a visual cloud. This helps identify the strength of a trend; a widening cloud indicates accelerating momentum, while a thinning cloud warns of a potential reversal.
True Average Pricing (OHLC): Unlike standard indicators that only look at the Close, this script calculates movement based on the average of Open, High, Low, and Close.
Why this matters: Closing prices can be manipulated or deceptive. By averaging every move within a candle, we capture the "Real Average Price." While a closing price might repeat, the true OHLC average is almost never identical, providing a smoother, more accurate trend line.
The Trading Rule
The philosophy here is rooted in simplicity and the principle of discipline.
Bearish Bias: If the Average Price is ABOVE the current market price, look for sell opportunities (Short).
Bullish Bias: If the Average Price is BELOW the current market price, look for buy opportunities (Long).
By sticking to this core principle, you eliminate the "noise" of smaller fluctuations and trade in harmony with the dominant trend.
Why Use This?
Efficiency: No more jumping between 5-minute, 1-hour, and Daily charts. The 200/600 cloud brings the "Big Picture" directly onto your current workspace.
No Lagging Data: By using the total price action (OHLC) rather than just the close, the indicator reacts to the reality of the market movement in real-time.
Visual Clarity: The clouds act as dynamic support and resistance zones. Indicator

Indicator
Indicator

Indicator

Indicator

Indicator

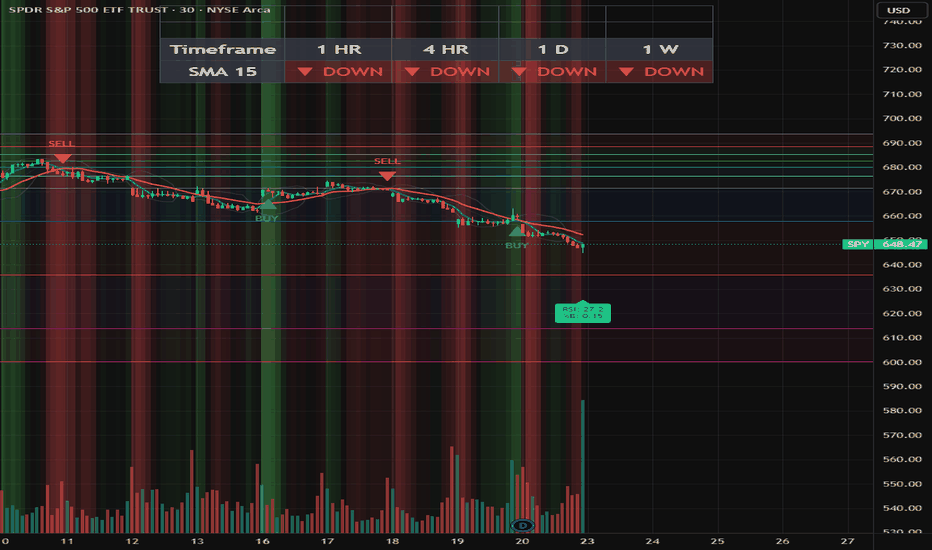
15 SMA Trend-Friend MTF15 SMA Trend-Friend MTF is a high-level situational awareness tool designed to provide an instant "bird's-eye view" of a stock's trend structure across four critical timeframes: 1 Hour, 4 Hour, Daily, and Weekly.
By pulling real-time data from multiple time horizons into a single, clean table at the top of your chart, this indicator eliminates the need to constantly flip between tabs, allowing you to maintain focus on your primary execution timeframe.
Core Logic:
The dashboard tracks the SMA 15 across all four timeframes. A signal is determined by the relationship between the price and this moving average:
▲ UP (Green): Price has closed above the SMA 15 and is successfully maintaining its position above it. This indicates a confirmed bullish trend on that specific timeframe.
▼ DOWN (Red): Price has closed below the SMA 15 and is maintaining its position beneath it. This indicates a confirmed bearish trend on that specific timeframe.
Why This Is Valuable to Traders:
Trend Confluence: The most powerful moves in the market happen when multiple timeframes align. If the 1H, 4H, and 1D are all showing "UP," you have a high-probability long setup. If they are mixed, you know to expect chop or a potential reversal.
Contextual Awareness: It prevents "tunnel vision." A trader looking at a 5-minute chart might see a buy signal, but the MTF Dashboard will instantly warn them if the Daily and Weekly trends are heavily "DOWN," suggesting they are trading against a massive wall of resistance.
Efficiency: It saves critical seconds during fast-moving market conditions. You can scan through your watchlist and instantly see which stocks have "Full Alignment" (all green or all red) without ever leaving your main chart.
Customizable Visibility: With adjustable text sizes (up to "Huge") and a "Top Padding" feature, the dashboard can be positioned to stay perfectly visible regardless of your screen resolution or TradingView UI layout.
Best Use Case:
Use this as your "Master Filter." Before taking any signal from the Apex Momentum Filter, glance at the MTF Trend Dashboard. If your entry signal aligns with the higher-timeframe trends (Daily and Weekly), your probability of a successful trade increases significantly. Indicator
Indicator

Indicator

time zone indicesPrecision Session Highlighter
This indicator is designed to highlight specific time ranges (sessions) with absolute precision across all asset classes, including Forex, Stocks, and Indices (NAS100, US30, SPX500).
The Problem it Solves:
Traders often face "time-shift" issues when moving from Forex to Indices because brokers and exchanges use different server times. Standard indicators often fail to align with the actual New York or London open when the chart is set to local time or RTH (Regular Trading Hours).
Key Features:
Manual Timezone Offset: Built using Pine Script v5, this script allows you to manually select the Timezone (e.g., UTC-5 for New York). This ensures the session box starts exactly at the candle you intend, regardless of your local clock or broker settings.
Indices Optimization: Perfect for marking Killzones or Open Ranges in indices where gap hours or pre-market data often displace standard session drawings.
Clean Visuals: Fully customizable background colors and transparency levels to maintain a clean workspace.
How to use:
Input your desired session time (e.g., 0930-1200).
Select the appropriate UTC offset for the asset you are trading.
If trading Indices, ensure your chart is set to "Electronic Trading Hours" (ETH) to see pre-market sessions. Indicator

Indicator
Indicator