Generalized Fisher Transform [LB] Concept
The Generalized Fisher Transform extends John F. Ehlers' classic Fisher Transform (2002) by introducing an adjustable shape parameter that controls the sensitivity profile of the transformation. While the original Fisher Transform maps any normalized input to a near‑Gaussian output to highlight statistical extremes, this generalized version allows traders to emphasize central regions (shape < 1) or extreme tails (shape > 1) depending on their strategy.
Mathematical Foundation
The indicator first normalizes price to a bounded range using a rolling min‑max window of length N :
x = 2 × (P - L_min) / (H_max - L_min) - 1
A signed power is then applied with a shape factor p :
x_p = sign(x) × |x|^p
The generalized Fisher Transform is computed as :
F = 0.5 × ln( (1 + x_p) / (1 - x_p) )
When p = 1 , the formula reduces to the classic Fisher Transform. Values of p < 1 amplify sensitivity near zero (central price region), while p > 1 amplify sensitivity near the edges (extreme price region). The result is smoothed by an EMA for noise reduction.
What Problem Does It Solve ?
Classic oscillators such as RSI or Stochastic use fixed non‑linear mappings that cannot adapt to different market regimes or trader preferences. The classic Fisher Transform offers a single sensitivity profile. The Generalized Fisher Transform solves this by exposing the shape parameter p , giving traders direct control over where the indicator is most responsive — near the mean or near the extremes — without changing the underlying logic or introducing additional indicators.
How To Interpret
The indicator operates in two selectable modes :
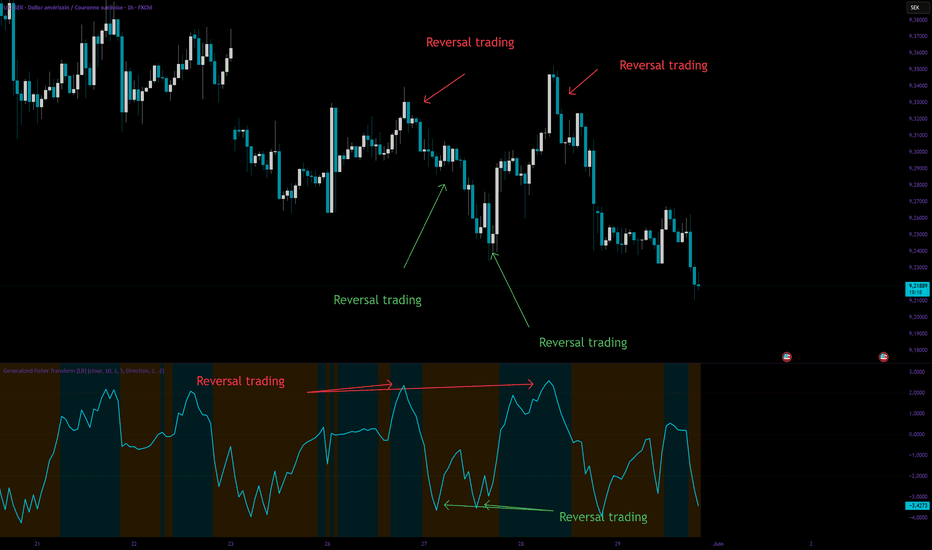
Extremes Mode – the background turns red when Fisher exceeds the upper threshold (statistically overbought), and green when it drops below the lower threshold (statistically oversold). These zones suggest potential mean‑reversion.
Direction Mode – the background turns cyan when Fisher is above zero (bullish bias) and orange when below zero (bearish bias). This mode is suited for trend‑following or directional confirmation.
In both modes, the Fisher line crossing zero indicates a shift in the price distribution relative to its recent range.
Parameters
Source – price data used for the calculation (default: close).
Normalization Period – number of bars used to compute the rolling min‑max for the normalization.
Shape Factor – exponent applied to the normalized price before the Fisher transform. 1 = classic Fisher, < 1 = center‑sensitive, > 1 = tail‑sensitive.
Smoothing Period – EMA length applied to the raw Fisher output.
Coloration Mode – switches between "Extremes" (overbought/oversold highlighting) and "Direction" (bullish/bearish highlighting).
Upper Threshold – Fisher level above which the background turns red in Extremes mode.
Lower Threshold – Fisher level below which the background turns green in Extremes mode.
Reference
Ehlers J.F., "Using the Fisher Transform", Technical Analysis of Stocks & Commodities, Vol. 20, No. 11, pp. 40‑45, November 2002.
Ehlers J.F., "Cybernetic Analysis for Stocks and Futures", Chapter 4 – The Fisher Transform, John Wiley & Sons, 2004. Indicator
SHK CCI RSI StochRSI Fisher Blended Oscillator divergence╔══════════════════════════════════════════════════════════════╗
SHK Blended Oscillator
CCI + RSI + Stoch RSI + Fisher
╚══════════════════════════════════════════════════════════════╝
A professional-grade momentum oscillator that blends four powerful
indicators — CCI, RSI, Stochastic RSI, and Fisher Transform — into
one single weighted signal line. No clutter, no multiple panes.
Just one clean oscillator with maximum confluence.
━━━━━━━━━━━━━━━━━━━━━━━━━━━━━━━━━━━━━━━━
🔷 HOW IT WORKS
━━━━━━━━━━━━━━━━━━━━━━━━━━━━━━━━━━━━━━━━
Each indicator is normalized to the CCI scale (±100/±200) and
blended using user-defined weights. The result is a single line
that represents the combined momentum of all four indicators.
A signal MA line is plotted over the blended line for crossover
confirmation.
━━━━━━━━━━━━━━━━━━━━━━━━━━━━━━━━━━━━━━━━
📊 4 BLENDED INDICATORS
━━━━━━━━━━━━━━━━━━━━━━━━━━━━━━━━━━━━━━━━
① CCI — Commodity Channel Index (core base, always active)
② RSI — Relative Strength Index (normalized to CCI scale)
③ Stoch RSI — Stochastic RSI K line (normalized to CCI scale)
④ Fisher Transform — Price distribution oscillator (normalized)
Each indicator can be enabled/disabled independently.
Each has its own blend weight (0.1 to 3.0) to control influence.
━━━━━━━━━━━━━━━━━━━━━━━━━━━━━━━━━━━━━━━━
📐 11 SIGNAL MA TYPES
━━━━━━━━━━━━━━━━━━━━━━━━━━━━━━━━━━━━━━━━
Choose any of 11 moving average types for the signal line:
▸ SMA — Simple MA
Equal weight to all bars. Slowest. Best for clean baselines.
▸ EMA — Exponential MA
More weight on recent bars. Balanced lag. Best general purpose.
▸ WMA — Weighted MA
Linear weight to recent bars. Slightly faster than SMA.
▸ RMA — Wilder's Smoothed MA
Same smoothing method used inside RSI and ATR. Very smooth,
minimal noise. Best for swing trades.
▸ HMA — Hull MA
Fastest MA with least lag. Reactive to price changes.
Best for intraday Nifty/BankNifty options scalping.
▸ VWMA — Volume Weighted MA
Weights bars by volume. Gives more importance to high-volume
moves. Best for volume-heavy stocks like Reliance, TCS.
▸ SWMA — Symmetrically Weighted MA
Fixed 4-bar symmetric weighting. No length setting needed.
Smooth and balanced.
▸ DEMA — Double EMA
2×EMA − EMA(EMA). Reduces lag significantly compared to EMA.
Good for trend-following entries.
▸ TEMA — Triple EMA
3×E1 − 3×E2 + E3. Very fast, aggressive lag reduction.
Best for strong trending markets.
▸ LSMA — Least Squares MA (Linear Regression)
Fits a regression line to price. Excellent for identifying
clean trend direction. Best for daily/weekly charts.
▸ ALMA — Arnaud Legoux MA
Gaussian-weighted MA with customizable Offset and Sigma.
Low lag + low noise. Best for commodity options (Gold, Crude).
━━━━━━━━━━━━━━━━━━━━━━━━━━━━━━━━━━━━━━━━
🎯 SIGNAL SYSTEM
━━━━━━━━━━━━━━━━━━━━━━━━━━━━━━━━━━━━━━━━
▲ Bull Signal — appears when:
• Blended line is above signal MA (strength confirmed)
• AND any one of these fires:
- Blended crosses above zero
- RSI exits oversold zone
- StochRSI K exits oversold zone
- Fisher exits oversold level
▼ Bear Signal — appears when:
• Blended line is below signal MA (strength confirmed)
• AND any one of these fires:
- Blended crosses below zero
- RSI exits overbought zone
- StochRSI K exits overbought zone
- Fisher exits overbought level
Only ONE ▲ and ONE ▼ symbol per bar — no clutter.
━━━━━━━━━━━━━━━━━━━━━━━━━━━━━━━━━━━━━━━━
🔍 DIVERGENCE DETECTION
━━━━━━━━━━━━━━━━━━━━━━━━━━━━━━━━━━━━━━━━
✦ CCI Divergence — draws solid lines on the blended oscillator
• Bullish: price lower low + blended higher low → Lime line
• Bearish: price higher high + blended lower high → Red line
✦ RSI Divergence — draws dashed lines on RSI (normalized)
• Bullish divergence → Aqua dashed line
• Bearish divergence → Orange dashed line
✦ Labels auto-printed:
"CCI Bull Div" / "CCI Bear Div"
"RSI Bull Div" / "RSI Bear Div"
"CCI&RSI Bull Div" when both confirm together
━━━━━━━━━━━━━━━━━━━━━━━━━━━━━━━━━━━━━━━━
🎨 VISUAL FEATURES
━━━━━━━━━━━━━━━━━━━━━━━━━━━━━━━━━━━━━━━━
• Strength Histogram — color-coded background bars behind the line
• Blended Line Color:
Bright Lime = above zero + above MA (strong bull)
Faded Lime = below zero but above MA (weak bull)
Bright Red = below zero + below MA (strong bear)
Faded Red = above zero but below MA (weak bear)
• Signal MA Color:
Green = Heikin Ashi bullish candle
Red = Heikin Ashi bearish candle
• Extreme Zone BG Highlight:
Green background = blended above +100 and above MA
Red background = blended below -100 and below MA
• Horizontal Levels: ±200 (OB/OS), ±100, Zero line
• Blue filled zone between +100 and -100 (normal range)
━━━━━━━━━━━━━━━━━━━━━━━━━━━━━━━━━━━━━━━━
🔔 30+ ALERT CONDITIONS
━━━━━━━━━━━━━━━━━━━━━━━━━━━━━━━━━━━━━━━━
Blended Alerts:
• Strong Bullish / Strong Bearish
• Zero line cross up / down
• Above +100 / Below -100
• Hit Overbought / Oversold
• Exit Overbought / Exit Oversold
RSI Alerts:
• RSI above OB / below OS
• RSI cross above/below 50
StochRSI Alerts:
• K cross above oversold / below overbought
• K cross above / below D
Fisher Alerts:
• Fisher cross above/below oversold/overbought
• Fisher cross above/below zero
Combined:
• Any Bull Signal fired
• Any Bear Signal fired
Heikin Ashi:
• HA turned Bullish / Bearish
Divergence:
• CCI Bull/Bear Div
• RSI Bull/Bear Div
• CCI & RSI both confirmed
━━━━━━━━━━━━━━━━━━━━━━━━━━━━━━━━━━━━━━━━
⚙️ SETTINGS GROUPS
━━━━━━━━━━━━━━━━━━━━━━━━━━━━━━━━━━━━━━━━
• CCI Settings — length, source, MA type, MA length, ALMA params
• Levels — OB/OS and ±100 levels fully adjustable
• RSI Settings — length, source, OB/OS, blend weight
• StochRSI Settings — RSI len, Stoch len, K/D smooth, OB/OS, weight
• Fisher Settings — length, OB/OS levels, blend weight
• Features — toggle divergences, histogram, signals, extremes
• Divergence — lookback bars and threshold sensitivity
━━━━━━━━━━━━━━━━━━━━━━━━━━━━━━━━━━━━━━━━
🇮🇳 BEST FOR INDIAN MARKETS
━━━━━━━━━━━━━━━━━━━━━━━━━━━━━━━━━━━━━━━━
✔ Nifty 50 / BankNifty intraday options (HMA or TEMA)
✔ Sensex daily swing trades (ALMA or RMA)
✔ MCX Gold / Crude Oil options (ALMA or LSMA)
✔ NSE large-cap stocks (VWMA)
✔ All timeframes — 1m to Monthly
━━━━━━━━━━━━━━━━━━━━━━━━━━━━━━━━━━━━━━━━
⚠️ DISCLAIMER
━━━━━━━━━━━━━━━━━━━━━━━━━━━━━━━━━━━━━━━━
━━━━━━━━━━━━━━━━━━━━━━━━━━━━━━━━━━━━━━━━
⚠️ IMPORTANT DISCLAIMER — READ BEFORE USE
━━━━━━━━━━━━━━━━━━━━━━━━━━━━━━━━━━━━━━━━
FOR EDUCATIONAL PURPOSES ONLY
This indicator is not financial advice, investment advice, or
a recommendation to buy or sell any financial instrument.
All signals, alerts, and visual outputs are informational only.
NO GUARANTEE OF ACCURACY
Technical indicators are mathematical calculations based on
historical price data. They are lagging by nature and cannot
predict future price movements. Signals may be false, delayed,
or unreliable during high volatility, news events, or low
liquidity conditions.
RISK OF LOSS
Trading financial markets involves substantial risk. Options
and derivatives carry even higher risk due to leverage — you
can lose your entire invested capital. Never trade with money
you cannot afford to lose.
YOUR RESPONSIBILITY
• You are solely responsible for all your trading decisions.
• Never use this as your only reason to enter or exit a trade.
• Always apply stop-loss, proper position sizing, and risk
management on every single trade.
• Consult a SEBI-registered advisor before making significant
financial decisions.
• The author accepts NO liability for any losses incurred
from the use or misuse of this indicator.
INDIA MARKET NOTE
NSE, BSE, and MCX markets are subject to SEBI regulations,
RBI policy decisions, Budget announcements, and circuit
breakers — all of which can cause sudden moves that no
indicator can anticipate. Always check news calendars.
Past performance shown on historical charts does NOT
guarantee future results under any circumstances.
─────────────────────────────────────────
© SHK — All rights reserved.
Unauthorized copying or resale of this script is strictly
prohibited under TradingView House Rules.
───────────────────────────────────────── Indicator

Indicator

KNN Fisher Holistic {LB] KNN FISHER HOLISTIC: Multi-Timeframe Predictive Suite
A Professional Quantitative Tool for Structural Trend Analysis.
The KNN FISHER HOLISTIC is a high-complexity technical indicator designed to eliminate the noise of single-timeframe trading. By combining the mathematical precision of the Fisher Transform with the statistical power of a k-Nearest Neighbors (KNN) algorithm, this tool identifies high-probability zones where market structure and historical patterns align.
■ THE ARCHITECTURE
1. The Holistic Master Axis
At the core of the indicator is a Weighted Multi-Timeframe (MTF) Axis . It standardizes the 15m, 1H, and 4H Fisher Transforms into a unified Z-Score distribution.
Pondération: 4H (50%), 1H (30%), 15m (20%).
Smoothing: We use an ALMA (Arnaud Legoux Moving Average) filter to provide a fluid, "zero-lag" trend line that represents the true institutional flow.
2. KNN Machine Learning Engine
The system features a localized k-Nearest Neighbors logic. It analyzes the current morphology (slope and position) of the Master Axis and compares it to the last 40 historical occurrences.
Predictive Score: The histogram at the bottom represents the KNN's confidence. If the current axis shape historically led to a price increase, the KNN displays a positive green score.
■ VISUAL COMPONENTS
The Multi-Layered Ribbon: Displays the gap between the Fast (15m) and Slow (4H) Fisher values. A "Squeeze" in the ribbon often precedes massive volatility breakouts.
Confluent Axis Coloring:
Cyan/Magenta: The Master Axis and the KNN Engine are in agreement. This is your Green Light for trend following.
Gray: The MTF structure and the KNN prediction are conflicting. This is a Neutral Zone where risk is highest.
KNN Confidence Histogram: Real-time probability scoring of the current trend signature.
■ OPERATIONAL STRATEGY
A. Trend Confluence (The Core Setup)
The strongest entries occur when the Master Axis turns Cyan (Bullish) or Magenta (Bearish). This indicates that the 4H trend is being supported by lower timeframe momentum AND that the KNN engine recognizes this pattern as a historically successful one.
B. Statistical Extremes (The Range Setup)
The indicator includes Z-Score Dotted Lines at +2 and -2 . These represent statistical anomalies (95% of data stays within these bounds).
When the 15m Fisher hits these extremes while the 4H Axis is flat, it signals a high-probability reversal point for mean-reversion traders.
C. Filtering False Breakouts
One of the most powerful uses of this tool is its Gray Filtering . If the price breaks a level but the Axis remains Gray , it means the KNN algorithm does not see historical validation for the move, warning you of a potential "Fake-out."
■ TECHNICAL SPECS
Standardization: Z-Score Normalization for cross-TF comparability.
Filtering: ALMA-based Zero-Lag smoothing.
Logic: Euclidean Distance-based KNN Classification.
Compatibility: Optimized for Pine Script® v6.
Risk Disclaimer: High-level quantitative indicators provide statistical probabilities, not certainties. Always pair this tool with solid risk management and price action confirmation. Indicator

Fisher MTF Unison & Cascade TP⬢ Fisher MTF Unison & Cascade TP
Sequential Orbital Alignment & Multi-Stage Exit Engine
Conception & Vision: Luis Barlier
Version: 1.0 — REVERSAL Edition (2026)
1. Introduction: The Synchronization Authority
The greatest weakness in a trend-following system is not the entry, but the exit strategy . Most traders exit too early during a minor pullback or stay too long until a profit turns into a loss.
The Cascade Solution: This system uses the Fisher Transform to detect high-probability entries through Full Unison . Its true power lies in its Sequential Take Profit (TP) logic, which scales you out of a position as each temporal layer loses its momentum.
2. Interface Anatomy & Technical Breakdown
To master this tool, you must understand the visual hierarchy of the "Gravity Wells."
Dans l'image ci-dessus : épaisseur différenciée - 4H 'Fondation' = gravité principale, 'Cascade' (X) = exhaustion séquentielle des timeframes inférieurs.
- 4H (The Foundation): Thickest lines, representing the primary market tide.
- 1H (The Current): Medium thickness, defining the intraday direction.
- 15m & 5m (The Waves): Thinner lines used for precision timing.
- The Unison Entry: Large Triangles appearing only when all 4 layers align.
3. The "Anti-Gravity" Reversal Strategy (Advanced)
While the indicator is built for trend following, a specific "Rubber Band" effect occurs when the timeframes are in total opposition.
The Rules for the Reversal:
The 15m Extreme: The 15m Fisher line must reach an absolute exhaustion point (Premium or Discount).
The 4H Anchor: The 4H line must be at the opposite extreme of the 15m.
The 1H Filter:
- If 15m is at a Premium Extreme : The 1H must not be below the 4H.
- If 15m is at a Discount Extreme : The 1H must not be above the 4H.
OR you may also like
4. Professional Interpretation Guide
I. Entering the Unison (The Alignment)
Wait for the BUY/SELL signal. This only occurs when the Fisher lines on all timeframes (5m, 15m, 1H, 4H) cross their respective triggers simultaneously.
II. Navigating the Cascade (The Managed Exit)
The system is designed for Partial Take Profits based on sequential decoupling:
- 5m TP (Orange X): Micro-exhaustion. Secure partial profits.
- 15m TP (Pink X): Confirmation of a deeper retracement.
- 1H TP (Deep Red/Blue X): Major structural exit.
5. Technical Specifications
- Fisher Transform (9): Optimized for sharp, actionable peaks rather than rounded curves.
- Strict Sequential Logic: The 15m TP cannot trigger unless the 5m TP has already been validated.
Author's Note:
This version of the MTF Fisher System was built for the disciplined practitioner. Observe the "Orbits," respect the "Cascade," and never fight the 4H Foundation.
— Luis Barlier , 2026 Edition. Indicator

Indicator

Swing Trading IndicatorThis script is a swing‑trading dashboard designed for BTC, ETH, S&P 500 (for now). It combines weekly RSI, USDT.D, VIX, moving averages and Fisher Transform into a single visual tool, with background highlights, an on‑chart info table and ready‑made alerts to help you time high‑probability swing entries and manage risk.
1. Overview
The indicator is intended to work on daily timeframe.
Signals are context‑aware: BTC and ETH get USDT.D conditions, SPX gets VIX and EMA‑100 logic, and all non‑ETH symbols can also use Fisher Transform as a mean‑reversion filter.
2. Conditions and background highlights
Each component sets a boolean condition and, when active, paints a background layer:
Weekly RSI condition
True when weekly RSI is below its symbol‑specific threshold.
USDT.D conditions
BTC: triggered when USDT.D is above the user threshold and the chart symbol is BTC.
ETH: same logic for ETH, but tracked separately..
VIX condition (SPX only)
True when VIX high is at or above the VIX threshold while the chart is SPX.
EMA condition (BTC & SPX)
BTC: daily close below EMA‑200.
SPX: daily close below EMA‑100.
Fisher Transform condition (non‑ETH)
Fisher Transform on the chart timeframe, using the configured period.
True when Fisher value is below the Fisher threshold.
3. Intended use and notes
This indicator is designed as a confluence tool for swing traders, not a standalone buy/sell system. It works best on assets that are in a clear uptrend, where the main idea is to accumulate during corrections within that broader bullish structure.
During larger market shocks, deep corrections, or black‑swan events, trend‑based and mean‑reversion filters can produce false signals, because volatility and correlations often behave abnormally in those periods. For that reason, this script should always be combined with independent risk management, higher‑timeframe trend analysis, and your own discretion.
Indicator

Indicator

Fisher MPzFisher MPz - Multi-Period Z-Score Fisher Transform
Overview
An enhanced Fisher Transform that uses multi-period analysis and improved statistical methods to provide more reliable trading signals with the goal of fewer false positives.
Evolution Beyond Traditional Fisher Transform
While the classic Fisher Transform uses simple price normalization and basic smoothing, Fisher MPz introduces several key enhancements:
- Multi-period composite instead of single timeframe analysis
- Robust z-score normalization using median/MAD rather than mean/standard deviation
- Winsorization to handle outliers and price spikes
- Dynamic clipping that adapts to market volatility
- Kalman filtering for superior noise reduction vs. traditional EMA smoothing
These improvements result in cleaner signals, better adaptability to different market conditions, handles trending markets without over-saturation at extreme values, and reduced false signals compared to the standard Fisher Transform.
Key Features
Multi-Period Analysis
- Three Timeframe Approach: Simultaneously analyzes short (default 8), medium (default 13), and long (default 26) periods
- Weighted Composite: Combines all three periods using customizable weights for optimal signal generation
- Individual Period Display: Optional visualization of each period's Fisher Transform for deeper analysis
Advanced Statistical Methods
Robust Z-Score Calculation
- Uses median and MAD (Median Absolute Deviation) instead of mean and standard deviation
- More resistant to outliers and extreme price movements
- Provides stable normalization across varying market conditions
Winsorization
- Caps extreme price values at specified percentiles (default 5th and 95th)
- Reduces the impact of price spikes and anomalies
- Configurable lookback period for threshold calculation
Dynamic Z-Score Clipping
- Automatically adjusts clipping levels based on recent volatility
- Tighter bounds in calm markets (0.05) for precision
- Wider bounds in volatile markets (0.2) to capture significant moves
- Uses ATR-based volatility measurement
Kalman Filter Smoothing
- Optional advanced noise reduction using Kalman filtering
- Superior to traditional EMA smoothing for optimal signal extraction
- Configurable process noise (Q) and measurement noise (R) parameters
- Fallback to traditional smoothing factor available
How to Use
Basic Interpretation
- Above Zero: Bullish momentum
- Below Zero: Bearish momentum
- Extreme Values: Potential overbought/oversold conditions
- Crossovers: Entry/exit signals when composite crosses trigger line
Customizable Settings
Periods: Adjust based on your trading timeframe
- Lower values (3-10): More sensitive, suitable for scalping
- Medium values (10-20): Balanced for swing trading
- Higher values (20-50): Smoother for position trading
Weights: Customize responsiveness
- Increase short weight: More reactive to recent price changes
- Increase long weight: More stability and trend confirmation
Kalman Settings
- Lower Q (0.001-0.02): Smoother, more filtered signals
- Higher Q (0.02-0.1): More responsive to price changes
- Lower R (0.01-0.05): Trust data more, less filtering
- Higher R (0.1-1.0): More skeptical of data, more smoothing Indicator

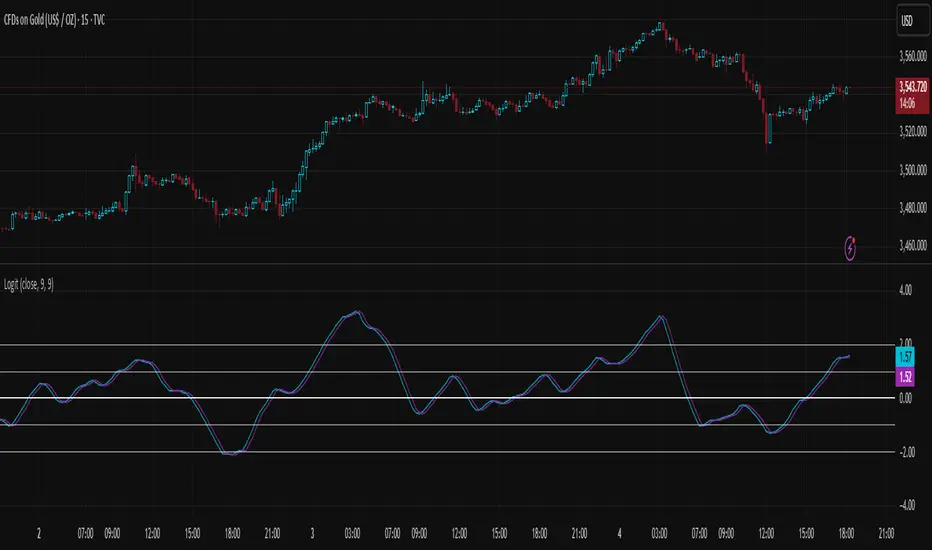
Logit Transform -EasyNeuro-Logit Transform
This script implements a novel indicator inspired by the Fisher Transform, replacing its core arctanh-based mapping with the logit transform. It is designed to highlight extreme values in bounded inputs from a probabilistic and statistical perspective.
Background: Fisher Transform
The Fisher Transform, introduced by John Ehlers , is a statistical technique that maps a bounded variable x (between a and b) to a variable approximately following a Gaussian distribution. The standard form for a normalized input y (between -1 and 1) is F(y) = 0.5 * ln((1 + y)/(1 - y)) = arctanh(y).
This transformation has the following properties:
Linearization of extremes:
Small deviations around the mean are smooth, while movements near the boundaries are sharply amplified.
Gaussian approximation:
After transformation, the variable approximates a normal distribution, enabling analytical techniques that assume normality.
Probabilistic interpretation:
The Fisher Transform can be linked to likelihood ratio tests, where the transform emphasizes deviations from median or expected values in a statistically meaningful way.
In technical analysis, this allows traders to detect turning points or extreme market conditions more clearly than raw oscillators alone.
Logit Transform as a Generalization
The logit function is defined for p between 0 and 1 as logit(p) = ln(p / (1 - p)).
Key properties of the logit transform:
Maps probabilities in (0, 1) to the entire real line, similar to the Fisher Transform.
Emphasizes values near 0 and 1, providing sharp differentiation of extreme states.
Directly interpretable in terms of odds and likelihood ratios: logit(p) = ln(odds).
From a statistical viewpoint, the logit transform corresponds to the canonical link function in binomial generalized linear models (GLMs). This provides a natural interpretation of the transformed variable as the logarithm of the likelihood ratio between success and failure states, giving a rigorous probabilistic framework for extreme value detection.
Theoretical Advantages
Distributional linearization:
For inputs that can be interpreted as probabilities, the logit transform creates a variable approximately linear in log-odds, similar to Fisher’s goal of Gaussianization but with a probabilistic foundation.
Extreme sensitivity:
By amplifying small differences near 0 or 1, it allows for sharper detection of market extremes or overbought/oversold conditions.
Statistical interpretability:
Provides a link to statistical hypothesis testing via likelihood ratios, enabling integration with probabilistic models or risk metrics.
Applications in Technical Analysis
Oscillator enhancement:
Apply to RSI, Stochastic Oscillators, or other bounded indicators to accentuate extreme values with a well-defined probabilistic interpretation.
Comparative study:
Use alongside the Fisher Transform to analyze the effect of different nonlinear mappings on market signals, helping to uncover subtle nonlinearity in price behavior.
Probabilistic risk assessment:
Transforming input series into log-odds allows incorporation into statistical risk models or volatility estimation frameworks.
Practical Considerations
The logit diverges near 0 and 1, requiring careful scaling or smoothing to avoid numerical instability. As with the Fisher Transform, this indicator is not a standalone trading signal and should be combined with complementary technical or statistical indicators.
In summary, the Logit Transform builds upon the Fisher Transform’s theoretical foundation while introducing a probabilistically rigorous mapping. By connecting extreme-value detection to odds ratios and likelihood principles, it provides traders and analysts with a mathematically grounded tool for examining market dynamics. Indicator

QFisher-R™ [ParadoxAlgo]QFISHER-R™ (Regime-Aware Fisher Transform)
A research/education tool that helps visualize potential momentum exhaustion and probable inflection zones using a quantitative, non-repainting Fisher framework with regime filters and multi-timeframe (MTF) confirmation.
What it does
Converts normalized price movement into a stabilized Fisher domain to highlight potential turning points.
Uses adaptive smoothing, robust (MAD/quantile) thresholds, and optional MTF alignment to contextualize extremes.
Provides a Reversal Probability Score (0–100) to summarize signal confluence (extreme, slope, cross, divergence, regime, and MTF checks).
Key features
Non-repainting logic (bar-close confirmation; security() with no lookahead).
Dynamic exhaustion bands (data-driven thresholds vs fixed ±2).
Adaptive smoothing (efficiency-ratio based).
Optional divergence tags on structurally valid pivots.
MTF confirmation (same logic computed on a higher timeframe).
Compact visuals with subtle plotting to reduce chart clutter.
Inputs (high level)
Source (e.g., HLC3 / Close / HA).
Core lookback, fast/slow range blend, and ER length.
Band sensitivity (robust thresholding).
MTF timeframe(s) and agreement requirement.
Toggle divergence & intrabar previews (default off).
Signals & Alerts
Turn Candidate (Up/Down) when multiple conditions align.
Trade-Grade Turn when score ≥ threshold and MTF agrees.
Divergence Confirmed when structural criteria are met.
Alerts are generated on confirmed bar close by default. Optional “preview” mode is available for experimentation.
How to use
Start on your preferred timeframe; optionally enable an HTF (e.g., 4×) for confirmation.
Look for RPS clusters near the exhaustion bands, slope inflections, and (optionally) divergences.
Combine with your own risk management, liquidity, and trend context.
Paper test first and calibrate thresholds to your instrument and timeframe.
Notes & limitations
This is not a buy/sell signal generator and does not predict future returns.
Readings can remain extreme during strong trends; use HTF context and your own filters.
Parameters are intentionally conservative by default; adjust carefully.
Compliance / Disclaimer
Educational & research tool only. Not financial advice. No recommendation to buy/sell any security or derivative.
Past performance, backtests, or examples (if any) are not indicative of future results.
Trading involves risk; you are responsible for your own decisions and risk management.
Built upon the Fisher Transform concept (Ehlers); all modifications, smoothing, regime logic, scoring, and visualization are original work by Paradox Algo. Indicator

RSI OS/OB Background StripesThe "RSI OS/OB Background Stripes" indicator is a simple tool designed to help traders visualize overbought and oversold market conditions using the Relative Strength Index (RSI). It highlights these conditions by displaying colored background stripes directly on your chart, making it easy to spot potential trading opportunities.
How It Works:RSI Calculation: The indicator calculates the RSI, a popular momentum indicator that measures the speed and change of price movements, using a default period of 14 (customizable).
Overbought/Oversold Levels: It marks areas where the RSI is above a user-defined overbought level (default: 70) with red background stripes, and below an oversold level (default: 30) with green background stripes.
Visual Feedback: The colored stripes appear on the chart when the RSI enters overbought (red) or oversold (green) zones, helping you quickly identify market conditions.
Customization: You can adjust the RSI period, overbought/oversold levels, background colors, and transparency. You can also choose to show the RSI line in a separate panel or display RSI values on the chart for debugging.
Alerts: The indicator includes optional alerts that notify you when the RSI crosses into overbought or oversold territory.
Who It’s For: This indicator is perfect for beginner and intermediate traders who want a clear, visual way to track RSI-based overbought and oversold conditions without cluttering their charts.
Key Features:Easy-to-read background stripes for overbought (red) and oversold (green) conditions.
Fully customizable RSI settings, colors, and transparency.
Optional RSI plot and value display for deeper analysis.
Alerts to keep you informed of key RSI level crossings.
This indicator is a straightforward way to monitor market momentum and make informed trading decisions.
Indicator

Pro Scalper AI [BullByte]The Pro Scalper AI is a powerful, multi-faceted scalping indicator designed to assist active traders in identifying short-term trading opportunities with precision. By combining trend analysis, momentum indicators, dynamic weighting, and optional AI forecasting, this tool provides both immediate and latched trading signals based on confirmed (closed bar) data—helping to avoid repainting issues. Its flexible design includes customizable filters such as a higher timeframe trend filter, and adjustable settings for ADX, ATR, and Hull Moving Average (HMA), giving traders the ability to fine-tune the strategy to different markets and timeframes.
Key Features :
- Confirmed Data Processing :
Utilizes a helper function to lock in price and volume data only from confirmed (closed) bars, ensuring the reliability of signals without the risk of intrabar repainting.
- Trend Analysis :
Employs ADX and Directional Movement (DI) calculations along with a locally computed HMA to detect short-term trends. An optional higher timeframe trend filter can further refine the analysis.
- Flexible Momentum Modes :
Choose between three momentum calculation methods—Stochastic RSI, Fisher RSI, or Williams %R—to match your preferred style of analysis. This versatility allows you to optimize the indicator for different market conditions.
- Dynamic Weighting & Volatility Adjustments :
Adjusts the contribution of trend, momentum, volatility, and volume through dynamic weighting. This ensures that the indicator responds appropriately to varying market conditions by scaling its sensitivity with user-defined maximum factors.
- Optional AI Forecast :
For those who want an extra edge, the built-in AI forecasting module uses linear regression to predict future price moves and adjusts oscillator thresholds accordingly. This feature can be toggled on or off, with smoothing options available for more stable output.
- Latching Mode for Signal Persistenc e:
The script features a latching mechanism that holds signals until a clear reversal is detected, preventing whipsaws and providing more reliable trade entries and exits.
- Comprehensive Visualizations & Dashboard :
- Composite Oscillator & Dynamic Thresholds : The oscillator is plotted with dynamic upper and lower thresholds, and the area between them is filled with a color that reflects the active trading signal (e.g., Strong Buy, Early Sell).
- Signal Markers : Both immediate (non-latching) and stored (latched) signals are marked on the chart with distinct shapes (circles, crosses, triangles, and diamonds) to differentiate between signal types.
- Real-Time Dashboard : A customizable dashboard table displays key metrics including ADX, oscillator value, chosen momentum mode, HMA trend, higher timeframe trend, volume factor, AI bias (if enabled), and more, allowing traders to quickly assess market conditions at a glance.
How to Use :
1. S ignal Interpretation :
- Immediate Signals : For traders who prefer quick entries, the indicator displays immediate signals such as “Strong Buy” or “Early Sell” based on the current market snapshot.
- Latched Signals : When latching is enabled, the indicator holds a signal state until a clear reversal is confirmed, offering sustained trade setups.
2. Trend Confirmation :
- Use the HMA trend indicator and the optional higher timeframe trend filter to confirm the prevailing market direction before acting on signals.
3. Dynamic Thresholds & AI Forecasting :
- Monitor the dynamically adjusted oscillator thresholds and, if enabled, the AI bias to gauge potential shifts in market momentum.
4. Risk Management :
- Combine these signals with additional analysis and sound risk management practices to determine optimal entry and exit points for scalping trades.
Disclaimer :
This script is provided for educational and informational purposes only and does not constitute financial advice. Trading involves risk, and past performance is not indicative of future results. Always perform your own analysis and use proper risk management strategies before trading.
Indicator

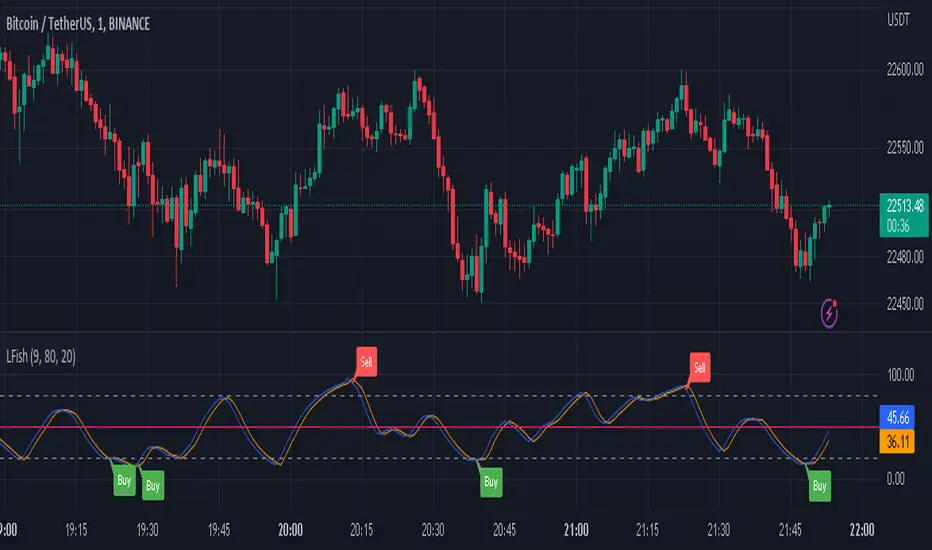
RSI + Normalized Fisher Transform with SignalsThis indicator combines three tools for market analysis: the Relative Strength Index (RSI), the RSI's moving average, and the Fisher Transform. RSI is a momentum oscillator that measures the speed and change of price movements, helping identify overbought and oversold conditions. The RSI moving average is a smoothed version of the RSI that filters noise and confirms trends. The Fisher Transform is a mathematical technique that transforms price data into a Gaussian normal distribution, making it easier to identify turning points. It has been normalized to the same scale as the RSI (0-100) for consistency.
Purpose
The goal of this indicator is to identify potential buy and sell opportunities with varying degrees of strength (strong and weak). By combining the RSI, its moving average, and the Fisher Transform, the indicator ensures signals are based on both momentum and reversals, making it highly versatile across different market conditions.
Key Features
This indicator provides strong and weak buy and sell signals. A strong buy occurs when the RSI crosses above its moving average while both the RSI and its moving average are oversold (below the default threshold of 30), and the Fisher Transform reverses direction within the same or prior bar while also being oversold. A weak buy occurs when the Fisher Transform is oversold, and the RSI crosses above its moving average while its value is between the default oversold threshold (30) and 50. A strong sell occurs when the RSI crosses below its moving average while both the RSI and its moving average are overbought (above the default threshold of 70), and the Fisher Transform reverses direction within the same or prior bar while also being overbought. A weak sell occurs when the Fisher Transform is overbought, and the RSI crosses below its moving average while its value is between 50 and the default overbought threshold (70).
The indicator includes customizable thresholds and lengths. Users can adjust the oversold and overbought thresholds to suit their trading style. The RSI length, moving average length, and Fisher Transform length are also customizable. The Fisher Transform is scaled to the RSI’s range of 0-100 to simplify analysis and signal interpretation.
How to Use the Indicator
On the chart, you will see the RSI line in blue, the RSI moving average in orange, and the Fisher Transform in purple. Horizontal lines at the default oversold (30) and overbought (70) levels mark critical zones for signals. Adjust these thresholds in the indicator settings as needed.
Strong buy signals are shown as larger, darker green arrows below the price. Weak buy signals are small lime arrows below the price. Strong sell signals are larger, darker red arrows above the price. Weak sell signals are small fuchsia arrows above the price.
Signal Interpretation
A strong buy indicates a highly favorable buying opportunity. This typically occurs when the asset is in a downtrend but shows signs of reversal, particularly in oversold zones. A weak buy suggests a potential buying opportunity but with less conviction, often when the market is neutral to slightly bearish but showing upward momentum. A strong sell indicates a highly favorable selling opportunity, usually occurring when the asset is in an uptrend but shows signs of reversal, particularly in overbought zones. A weak sell suggests a potential selling opportunity but with less conviction, often in neutral to slightly bullish markets showing downward momentum.
Practical Tips
Avoid using signals in isolation. Combine this indicator with other tools such as trendlines, moving averages, or support/resistance levels for greater accuracy. Adjust the parameters for different assets to match their volatility. For volatile assets, consider wider thresholds like 20/80 for oversold/overbought levels. For less volatile assets, tighter thresholds like 35/65 may be more appropriate. Use higher timeframes to confirm signals before trading on lower timeframes. Be cautious in sideways markets, as both RSI and the Fisher Transform perform better in trending conditions.
Instructions for Adjustments
To change the oversold or overbought levels, open the indicator settings by clicking the gear icon and modify the "Oversold Threshold" and "Overbought Threshold" values. To adjust lengths for RSI and Fisher Transform, update the "RSI Length," "RSI Moving Average Length," and "Fisher Transform Length" settings. If needed, toggle signal visibility by enabling or disabling specific arrows (Strong Buy, Weak Buy, Strong Sell, Weak Sell) in the "Style" tab.
Best Practices
Risk management is essential. Always set appropriate stop-loss levels and position sizes based on your risk tolerance. Backtest the indicator on historical data to understand its performance and behavior for your chosen asset and timeframe. Combining this indicator with volume or volatility analysis (Bollinger Band Width, for example) can help confirm signal validity.
This indicator simplifies decision-making by identifying high-probability trading opportunities using a combination of momentum, trend, and reversals. Follow these instructions to fully utilize its capabilities without needing to analyze the underlying code. Indicator

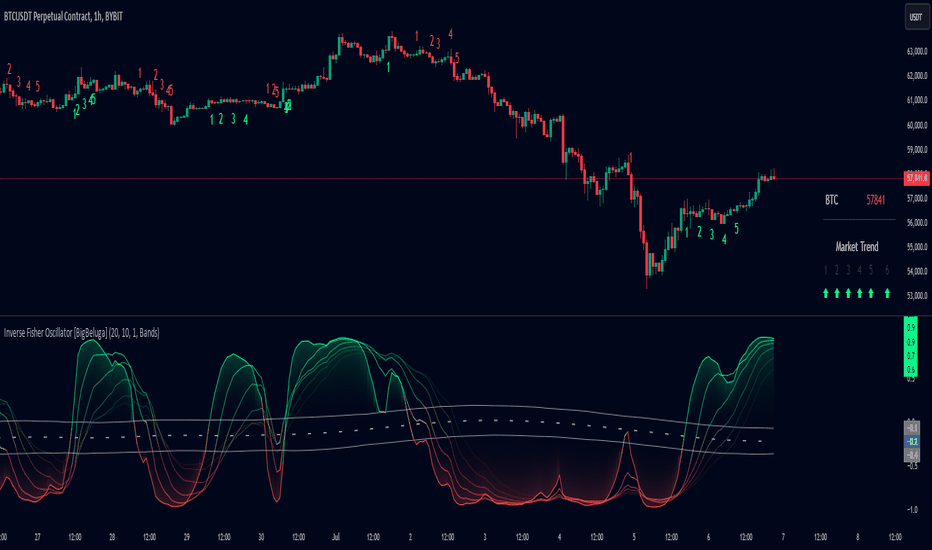
Inverse Fisher Oscillator [BigBeluga]The Inverse Fisher Oscillator is a powerful tool for identifying market trends and potential reversal points by applying the Inverse Fisher Transform to normalized price data. This indicator plots multiple smoothed oscillators, each color-coded to signify their relation to dynamic volatility bands. Additionally, the Butterworth filter is incorporated to further refine trend signals. The Inverse Fisher Oscillator offers traders a visually appealing and insightful approach to trend analysis and market direction detection.
🔵 KEY FEATURES
● Inverse Fisher Oscillator Visualization
Multiple Oscillators : The indicator calculates and plots six different Inverse Fisher Oscillators, each smoothed at increasing levels to provide a layered view of price momentum.
Color-Coded Signals : The oscillator lines are color-coded based on their relation to the volatility bands—green for bullish momentum, red for bearish momentum, and yellow for neutral movements.
● Butterworth Filter Integration
Filtering : The Butterworth filter is applied to mid-line Bands to reduce noise, allowing for clearer trend detection.
// Calculate constants for the Butterworth filter
float piPrd = math.pi / mid_len
float g = math.sqrt(2)
float a1 = math.exp(-g * piPrd)
float b1 = 2 * a1 * math.cos(g * piPrd)
float coef2 = b1
float coef3 = -a1 * a1
float coef1 = (1 - b1 + a1 * a1) / 4
// Source data for the Butterworth filter
float source = ifish // The first inverse Fisher Oscillator is used as the source
// Previous source and butter filter values
var float butter = na // Initialize the 'butter' variable
// Handle null values using the nz function
float prevB1 = nz(butter , source) // Use 'source' as a fallback if butter is null
float prevB2 = nz(butter , source) // Use 'source' as a fallback if butter is null
// Calculate the Butterworth filter value
butter := coef1 * (source + (2 * source ) + source ) + (coef2 * prevB1) + (coef3 * prevB2)
● Numbered Signal Marks
Signal Markers : The indicator plots numbered signals on the chart when an oscillator crosses above the upper volatility band or below the lower volatility band.
Numbered Lines : Numbers correspond to the different oscillators (1-6), helping traders easily identify which smoothing level generated the signal.
Visual Cues : The signals are color-coded—green for bullish crossovers and red for bearish crossunders—providing clear visual cues for trend accumulation phases.
Mid-Line Option : Traders can choose between plotting the Butterworth filter as a dynamic mid-line or simply displaying it as part of the bands.
Volatility Bands : Dynamic volatility bands provide additional context for interpreting the strength and sustainability of trends.
● Dashboard Display
Real-Time Market Trend Overview : The dashboard in the bottom-right corner of the chart displays the market trend based on the Inverse Fisher Oscillator for six different smoothing levels, providing a clear visual summary of market direction.
Direction Symbols : Directional symbols (up, down, or neutral) are displayed in the dashboard, color-coded to represent bullish, bearish, or neutral momentum.
Current Price Display : The dashboard also shows the current price and highlights whether it is above or below the opening price.
🔵 HOW TO USE
● Identifying Trend Reversals
Bullish Reversals : When the oscillators short period lines start to cross above the upper volatility band (green), it indicates potential bullish momentum.
Bearish Reversals : When the oscillator crosses below the lower volatility band (red), it signals potential bearish momentum.
Neutral Signals : When the oscillator remains within the bands (yellow), it suggests that the market is in a neutral or consolidating state. Traders may choose to wait for a clearer trend signal.
● Using the Dashboard for Trend Overview
Market Trend Summary : The dashboard provides a quick overview of market direction across six different smoothing levels. Green arrows indicate bullish momentum, red arrows indicate bearish momentum, and wavy lines suggest neutrality.
Price Context : The dashboard also displays the current price, helping traders quickly assess whether the price is moving in the expected direction relative to their trend analysis.
● Volatility Band Interpretation
Volatility-Based Signals : Pay attention to how the oscillators interact with the volatility bands. Strong trends will often result in oscillators staying above or below the bands, while weaker trends or consolidations will see oscillators hovering within the bands.
🔵 CUSTOMIZATION
Length and Smoothing : Adjust the length and smoothing parameters to fit different market conditions and timeframes.
Bands Multiplier : Customize the multiplier for the volatility bands to make them more or less sensitive to price changes.
Mid-Line Type : Choose whether to display the Butterworth filter as a mid-line or incorporate it into the volatility bands.
Signal Markers : Toggle on or off the number markers for signal crossovers, making it easier to identify key entry and exit points.
🔵 CONCLUSION
The Inverse Fisher Oscillator combines the power of the Inverse Fisher Transform and the Butterworth filter to provide a sophisticated approach to trend and reversal detection. By leveraging volatility-based analysis and visually intuitive signals, this indicator helps traders spot potential entry and exit points with greater clarity. The customizable dashboard display adds further value, offering a real-time summary of market conditions to enhance decision-making. Use this tool in conjunction with other technical analysis methods to develop a well-rounded trading strategy. Indicator
Fisher Transform on RSIOverview
The Fisher Transform on RSI indicator combines the Relative Strength Index (RSI) with the Fisher Transform to offer a refined tool for identifying market turning points and trends. By applying the Fisher Transform to the RSI, this indicator converts RSI values into a Gaussian normal distribution, enhancing the precision of detecting overbought and oversold conditions. This method provides a clearer and more accurate identification of potential market reversals than the standard RSI.
Key/Unique Features
Fisher Transform Applied to RSI : Transforms RSI values into a Gaussian normal distribution, improving the detection of overbought and oversold conditions.
Smoothing : Applies additional smoothing to the Fisher Transform, reducing noise and providing clearer signals.
Signal Line : Includes a signal line to identify crossover points, indicating potential buy or sell signals.
Custom Alerts : Built-in alert conditions for bullish and bearish crossovers, keeping traders informed of significant market movements.
Visual Enhancements : Background color changes based on crossover conditions, offering immediate visual cues for potential trading opportunities.
How It Works
RSI Calculation : The indicator calculates the Relative Strength Index (RSI) based on the selected source and period length.
Normalization : The RSI values are normalized to fit within a range of -1 to 1, which is essential for the Fisher Transform.
Fisher Transform : The normalized RSI values undergo the Fisher Transform, converting them into a Gaussian normal distribution.
Smoothing : The transformed values are smoothed using a simple moving average to reduce noise and provide more reliable signals.
Signal Line : A signal line, which is a simple moving average of the smoothed Fisher Transform, is plotted to identify crossover points.
Alerts and Visuals : Custom alert conditions are set for bullish and bearish crossovers, and the background color changes to indicate these conditions.
Usage Instructions
Trend Identification : Use the Fisher Transform on RSI to identify overbought and oversold conditions with enhanced precision, aiding in spotting potential trend reversals.
Trade Signals : Monitor the crossovers between the smoothed Fisher Transform and the signal line. A bullish crossover suggests a potential buying opportunity, while a bearish crossover indicates a potential selling opportunity.
Alerts : Set custom alerts based on the built-in conditions to receive notifications when important crossover events occur, ensuring you never miss a trading opportunity.
Visual Cues : Utilize the background color changes to quickly identify bullish (green) and bearish (red) conditions, providing immediate visual feedback on market sentiment.
Complementary Analysis : Combine this indicator with other technical analysis tools and indicators to enhance your overall trading strategy and make more informed decisions.
Indicator

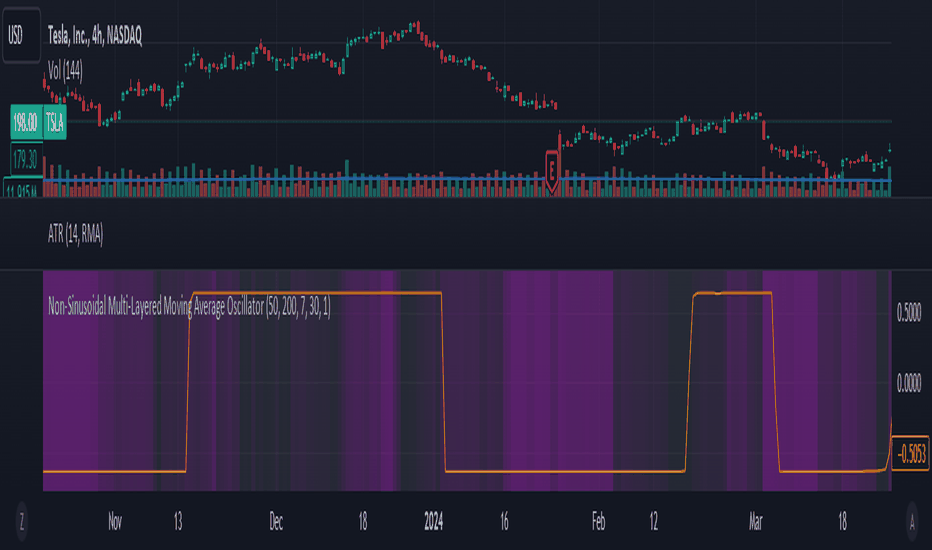
Non-Sinusoidal Multi-Layered Moving Average OscillatorThis indicator utilizes multiple moving averages (MAs) of different lengths their difference and its rate of change to provide a comprehensive view of both short-term and long-term market trends. The output signal is characterized by its non-sinusoidal nature, offering distinct advantages in trend analysis and market forecasting.
Combining the difference between two moving averages with the ROC allows to assess not only the direction and strength of the trend but also the momentum behind it. Transforming these signal in to non-sinusoidal output enhances its utility.
The indicator allows traders to select any one or more of seven moving average options. Larger timeframes (e.g., MA89/MA144) provide a broader identification of the overall trend, helping to understand the general market direction. Smaller timeframes (e.g., MA5/MA8) are more sensitive to price changes and can indicate better entry and exit points, aiding in the identification of retracements and pullbacks. By combining multiple timeframes, traders can get a comprehensive view of the market, enabling more precise and informed trading decisions.
Key Features:
Multiple Moving Averages:
The indicator calculates several exponential moving averages (EMAs) based on different lengths: MA5, MA8, MA13, MA21, MA34, MA55, MA89, and MA144.
These MAs are further smoothed using a secondary exponential moving average, with the smoothing length customizable by the user.
Percentage Differences:
The indicator computes the percentage differences between successive MAs (e.g., (MA5 - MA8) / MA8 * 100). These differences highlight the relative movement of prices over different periods, providing insights into market momentum and trend strength.
Short-term MA differences (e.g., MA5/MA8) are more sensitive to recent price changes, making them useful for detecting quick market movements.
Long-term MA differences (e.g., MA89/MA144) smooth out short-term fluctuations, helping to identify major trends.
Rate of Change (ROC):
The indicator applies the Rate of Change (ROC) to the percentage differences of the MAs. ROC measures the speed at which the percentage differences are changing over time, providing an additional layer of trend analysis.
ROC helps in understanding the acceleration or deceleration of market trends, indicating the strength and potential reversals.
Transformations:
The percentage differences undergo a series of mathematical transformations (either inverse hyperbolic sine transformation or inverse fisher transformation) to refine the signal and enhance its interpretability. These transformations include adjustments to stabilize the values and highlight significant movements.
checkbox allows users to select which mathematical transformations to use.
Non-Sinusoidal Nature:
The output signal of this indicator is non-sinusoidal, characterized by abrupt changes and distinct patterns rather than smooth, wave-like oscillations.
The non-sinusoidal signal provides clearer demarcations of trend changes and is more responsive to sudden market shifts.
This nature reduces the lag typically associated with sinusoidal indicators, allowing for more timely and accurate trading decisions.
Customizable Options:
Users can select which MA pairs to include in the analysis using checkboxes. This flexibility allows the indicator to adapt to different trading strategies, whether focused on short-term movements or long-term trends.
Visual Representation:
The indicator plots the transformed values on a separate panel, making it easy for traders to visualize the trends and potential entry or exit points.
Usage Scenarios:
Short-Term Trading: By focusing on shorter MAs (e.g., MA5/MA8), traders can capture quick market movements and identify short-term trends.
Long-Term Analysis: Utilizing longer MAs (e.g., MA89/MA144) helps in identifying major market trends.
Combination of MAs: The ability to mix different MA lengths provides a balanced view, helping traders make decisions based on both immediate price actions and overall market direction.
Practical Benefits:
Early Signal Detection: The sensitivity of short-term MAs provides early signals for potential trend changes, assisting traders in timely decision-making.
Trend Confirmation: Long-term MAs offer stable trend confirmation, reducing the likelihood of false signals in volatile markets.
Noise Reduction: The mathematical transformations and ROC applied to the percentage differences help in filtering out market noise, focusing on meaningful price movements.
Improved Responsiveness: The non-sinusoidal nature of the signal allows the indicator to react more quickly to market changes, providing more accurate and timely trading signals.
Clearer Trend Demarcations: Non-sinusoidal signals make it easier to identify distinct phases of market trends, aiding in better interpretation and decision-making.
Indicator
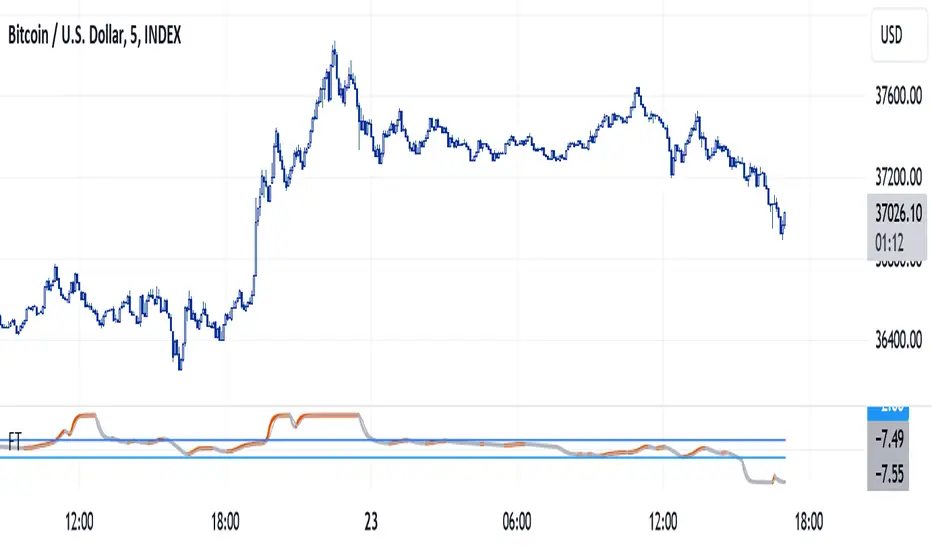
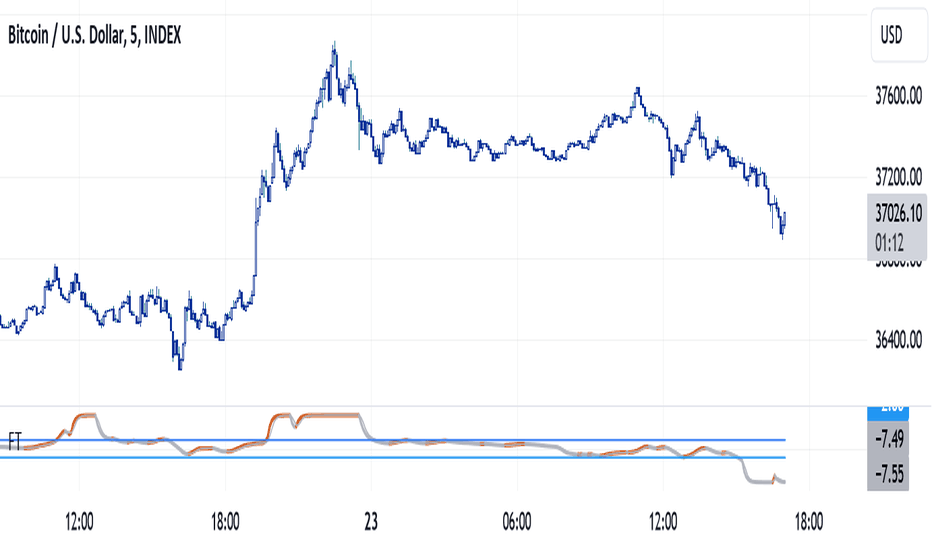
Fisher Transform RevisitedFisher Transform developped by Ehlers is used mostly to detect peaks and troughs, which it does with little lag, but there are many false signals. Looking at its formula and construction, we can revisit it for the purpose of detecting trends and flat market.
How do we want to do that? There are 3 different actions:
Increase the default value from usual 9 or 10 to 30
Show the indicator as seen from upper time frame with synthetic rolling candles
Change the weights in first formula in order to saturate the input signal, push the trend data to the limits, so therefore leaving a good view when market is flat
As can be seen from the chart above, the revisited Fisher is above 2 for uptrend markets, below -2 for downtrending markets and in-between when the market is flat.
Notes
Weights for Fisher transform formula can be changed as parameters. Recommended valeus are 0.6 and 0.6 to saturate signal. You may come back to original formula by setting 0.33 and 0.66.
Parameter n allows view from upper time, a multiple of current time frame. n = 1 for current chart, n = 5 for 5 minutes view on the 1 min chart
Usage
Of course, it should be not be used in standalone mode. Indicator is for trend traders who can stay away when market is flat. Trend start when indicator goes above 2 but like all trade indicators, it will be late; it is therefore a good idea to change n back to 1 to get a timely entry, to be confirmed of course with other elements of technical analysis.
Indicator
Indicator

Gaussian Fisher Transform Price Reversals - FTRHello Traders !
Looking for better trading results ?
"This indicator shows you how to identify price reversals in a timely manner." John F. Ehlers
Introduction :
The Gaussian Fisher Transform Price Reversals indicator, dubbed FTR for short, is a stat based price reversal detection indicator inspired by and based on the work of the electrical engineer now private trader John F. Ehlers.
The Fisher Transform :
It is a common assumption that prices have a gaussian / normal probability density function(PDF), i.e. a sample of n close prices would be normally distributed if the probability of observing a price value say at any given standard deviation range is equal to that probability in the case of the normal distribution, e.g. 68% off all samples fell within one standard deviation around the mean, which is what we would expect if the data was normal.
However Price Action is not normally distributed and thus can not be conventionally interpreted in this way, Formally the Fisher Transform, transforms the distribution of bounded ranging price action (were price action takes values in a range from -1 to 1) into that of a normal distribution, alternatively it may be said the Fisher Transform changes the PDF of any waveform so that the transformed output has n approximately Gaussian PDF, It does so through the following equations. taken directly from the work of John F. Ehlers - Using The Fisher Transform
By substituting price data in the above formulas, bounded ranging price actions (over a given user defined period lookback - this determines the range price ranges in, see the Intermediate formula above) distribution is transformed to that in the normal case. This means when the input, the Intermediate ,(the Midpoint - see formula above) approaches either limit within the range the outputs are greatly amplified, this amplification accentuates /puts more weight on the larger deviations or limits within the range, conversely when price action is varying round the mean of the range the output is approximately equal to unity (the input is approximately equal to the input, the intermediate)
The inputs (Intermediates) are converted to normal outputs and the nonlinear Transfer of the Fisher Transform with varying senesitivity's (gammas) can be seen in the graph / image above. Although sensitivity adjustments are not currently available in this script (I forgot to add it) the outputs may be greatly amplified as gamma (the coefficient of the Fisher Transformation - see Fish equation) approaches 1. the purple line show this graphically, as a higher gamma leads to a greater amplification than in the standard case (the red line which is the standard fisher transformation, the black plot is the Fish with a gamma of 1, which is unity sensativity)
Reversal plots and Breakouts :
- Support lines are plotted with their corresponding Fish value when there is a crossover of the Fish and Fish SMA <= a given standard deviation of Fish
- Resistance lines are plotted with their corresponding Fish value when there is a crossunder of the Fish and Fish SMA >= a given standard deviation of Fish
- Reversals are these support and resistance line plots
Breakouts and Volume bars :
Breakouts cause the reversal lines to break (when the high/low is above the resistance/support), Breakouts are more "high quality" when they occur conditional on high volume, the highlighted bars represent volume standard deviations ranging from -3 to 3. When breakouts occure on high volume this may be a sign of the continutaion of the trend (reversals would signify the start of a new trend).
Hope you enjoy, Happy Trading !
(be sure to rocket the script if you liked it, this helps me know which of my scripts are the most useful)
Indicator

Strategy

Indicator

Indicator