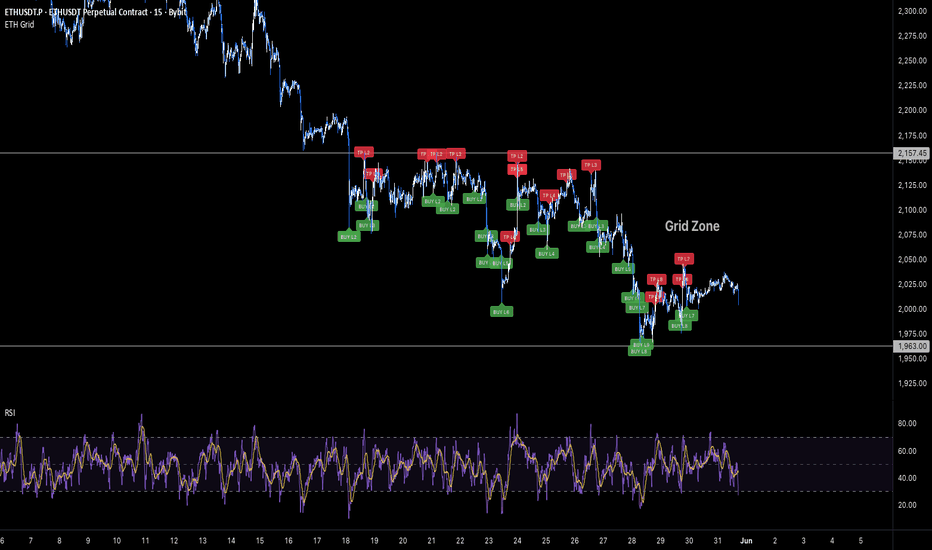
ETH Grid Bot - Long StrategyETH Grid Bot — Long Strategy
🔷 What it does:
This is a long-only price-grid strategy that harvests volatility on ETH / USDT through repeated round-trips on a pre-defined ladder of price levels between two fixed bounds. Each level is an independent slot: when price crosses down through a level, the strategy opens one slot; when price subsequently crosses up through the level immediately above, that slot is closed for a fixed round-trip profit. The grid is generated geometrically by default, so spacing adapts to the price scale.
- Up to 23 simultaneous long slots at default settings, each sized as a fixed fraction of the configured Total Investment.
- No trailing exit, no stop loss — each slot's exit is the level above its entry.
- Per-slot exposure is approximately 4.35% of equity at default settings, comfortably inside the 5–10% per-trade risk band.
- Every fill and close emits a webhook-ready JSON alert payload tagged with the specific grid slot.
🔷 Who is it for:
- Swing traders harvesting volatility on ETH in range-bound regimes.
- Bot operators looking for a chart-driven signal source with per-slot webhook JSON ready to drive a DCA Bot configured for grid execution.
- Traders running a portfolio of low-correlation strategies who want a high-trade-count contributor with bounded per-trade risk.
- Range traders who prefer mechanical execution over discretionary entries.
🔷 How does it work:
Grid Construction: On script load, the strategy computes N price levels between the configured High and Low bounds. In Geometric mode (default), level k is at High × (Low/High)^(k/(N-1)), giving constant percent spacing — approximately 1.0% per step at default settings. In Arithmetic mode, levels are linearly spaced by absolute price.
Per-Slot Logic: Each grid level is an independent slot tracked by a boolean ownership flag. When bar close moves price down through an empty slot's level, a long is opened at that level for one slot's worth of capital (Investment / N). When bar close moves price up through the level immediately above an owned slot, that slot is closed, locking the round-trip profit between the two adjacent levels.
No Trailing, No Stop Loss: By design, each slot has a fixed exit (the level above). The strategy never trails the exit and never stops a slot out for a loss — slots whose entry price is below current market simply wait until price comes back. This is the canonical grid-bot behavior.
Capital Bounds: Total deployed capital cannot exceed the configured Investment. When all 23 slots are filled, no new orders are opened until price rises and starts closing slots. This structural cap is the strategy's primary risk control.
🔷 Why it's unique:
- Per-Level Webhook Ledger: Every fill and close emits a fully-formed JSON alert payload tagged with the specific grid slot ("Grid_BUY_L5" / "Grid_TP_L5"). The strategy can drive a DCA Bot configured for grid emulation without any glue layer.
- Pre-Allocated State: All up to 200 slot ledgers live in fixed-size arrays, so state lookups are constant-time and the chart can render every active slot with no performance overhead.
- Honest Backtest Surface: The avg entry line plotted on the chart and the open PnL displayed in the status table both reflect the actual broker-equivalent position state — derived from fill-by-fill bookkeeping, not synthetic averaging. The status table also reports the cumulative realized net profit (how much the grid has actually earned, in USDT and % of starting capital), so live performance is visible directly on the chart.
- Calibrated for ETH 15m: Default bounds, level count, and step size are set against ETH's recent observed range. The 23-level geometric ladder gives roughly 1.0% per step — wide enough to clear perpetual taker fees on each round-trip, granular enough to keep catching 15m swings inside the range.
🔷 Considerations Before Using the Strategy:
Market Selection & Range Validity: Grid strategies are most profitable in range-bound, mean-reverting markets. On strong directional trends below the configured Low, slots will keep loading as price falls and won't close until price reverses. The default High/Low (2165 / 1734) was set against ETH's recent observed range; update both whenever the regime changes.
Capital Deployment & Drawdown: The default Investment of 10,000 USDT equals 100% of starting capital — high-conviction setting that assumes the configured range holds. Per-slot risk remains low (~4.35% of equity), but if price collapses below the Low bound, aggregate unrealized loss can grow further. Scale the Investment input down to match the worst-case drawdown you are willing to absorb in a range-break scenario.
No Stop Loss Justification: There is no exit on adverse moves below the lowest grid level. The strategy's per-trade risk is structurally capped by the per-slot allocation (Investment / N levels) — at defaults that is ~435 USDT per slot, well inside the conventional 5–10% per-trade band. The aggregate unrealized exposure is controlled separately via the Investment input.
Trade Volume & Fees: Grid bots on 15m generate a high number of round-trips. The ~1.0% step is deliberately wider than a tight scalp grid so each round-trip comfortably clears the perpetual taker fee. The default commission (0.06% per trade) is calibrated for Bybit perpetual taker conditions; any mismatch with your exchange's actual fees will materially shift the results.
Demo Testing: Always demo-test before going live. Past results do not guarantee future performance, especially on a strategy whose profitability is bounded by the chosen High/Low range remaining valid.
🔷 STRATEGY PROPERTIES
Symbol: BYBIT:ETHUSDT.P (Perpetual) — strategy is portable to any ETH / USDT pair.
Timeframe: 15M
Test Period: February 8, 2026 — May 31, 2026 (~3.8 months).
Initial Capital: 10,000 USDT.
Total Investment: 10,000 USDT (100% of capital, high-conviction setting).
Order Size per Slot: Investment / 23 ≈ 435 USDT (~4.35% of equity).
Commission: 0.06% per trade.
Slippage: 3 ticks.
Margin for Long Positions: 100%.
Indicator Settings: Default Configuration.
Grid Bounds: High 2165 / Low 1734 (range −19.91%).
Grid Levels: 23 (Geometric spacing, ~1.0% per step).
Stop Loss: None — per-slot allocation is the structural risk cap.
Trailing: None.
Strategy: Long Only.
🔷 STRATEGY RESULTS
⚠️ Remember, past results do not guarantee future performance.
Net Profit: +1,133.70 USDT (+11.34%)
Max Equity Drawdown: 422.86 USDT (4.08%)
Total Closed Trades: 355
Percent Profitable: 67.32% (239 / 355)
Profit Factor: 2.433
🔷 How to Use It:
🔸 Adjust Settings: Open the strategy inputs and set the High and Low bounds to a range you expect ETH to respect. Pick Geometric for percent-spaced levels (default, recommended) or Arithmetic. Set Grid Levels (7–200) and Total Investment to match your risk profile.
🔸 Results Review: Run a full-period backtest and confirm Max Drawdown stays within your personal risk band. Validate that the trade count is high enough to be statistically meaningful (≥ 100 closed trades is a reasonable floor — at default settings the strategy typically generates several hundred round-trips per 3-month window on ETH 15m).
🔸 Create alerts to trigger the DCA Bot: Add one alert on the strategy using "Any alert() function call". Paste your DCA Bot's webhook URL into the alert's Webhook field, and fill the Bot ID, Email Token, and Pair inputs on the script. Every grid-level buy and grid-level close will emit a dedicated JSON payload tagged with the slot index, so each level can be tracked independently downstream.
🔷 INDICATOR SETTINGS
High Price: Top of the grid. The highest level a slot can be created from.
Low Price: Bottom of the grid. The lowest level a slot can be created from.
Grid Levels: Number of price levels between High and Low (default 23, range 7–200).
Spacing Mode: Geometric (constant percent step) or Arithmetic (constant absolute step).
Total Investment (USDT): Total capital allocated across all slots. Per-slot size = Investment / Grid Levels.
Bot ID / Email Token / Pair: Webhook fields injected into every alert payload.
Visualization: Toggle grid lines, range box, HIGH/LOW labels, avg entry plot, fill labels, status table (shows range, levels, owned slots, investment, per-slot size, open PnL, and cumulative realized net profit).
Brand Watermark: Configurable text, position, size, and transparency.
👨🏻💻💭 We hope this tool helps enhance your trading. Your feedback is invaluable, so feel free to share any suggestions for improvements or new features you'd like to see implemented.
__
The information and publications within the 3Commas TradingView account are not meant to be and do not constitute financial, investment, trading, or other types of advice or recommendations supplied or endorsed by 3Commas and any of the parties acting on behalf of 3Commas, including its employees, contractors, ambassadors, etc. Strategy
Novaque ZAR Research DashboardNovaque ZAR Research Dashboard — Indicator Summary
The Novaque ZAR Research Dashboard is a TradingView indicator designed to help traders analyse South African rand currency pairs such as **USD/ZAR, EUR/ZAR, GBP/ZAR and other ZAR crosses** using a systematic multi-factor framework.
The indicator combines trend, momentum, volatility and risk-pressure signals into a single dashboard view. It is intended to support discretionary and systematic FX analysis by giving traders a clearer view of whether a ZAR pair is showing rand strength, rand weakness, or a mixed/neutral setup.
What the Indicator Shows
The dashboard includes:
* EMA trend structure using 21, 55 and 200-period exponential moving averages.
* Bollinger Bands to assess price extension, compression and mean-reversion zones.
* RSI to measure momentum strength or exhaustion.
* MACD histogram to track directional momentum.
* 20-bar and 60-bar momentum to compare short-term and medium-term price pressure.
* Realised volatility to assess whether market conditions are becoming more unstable.
* ATR percentage to measure current trading range relative to price.
* 20-bar drawdown to show how far price has pulled back from its recent high.
* Bullish/Bearish score that converts the indicator readings into a single market bias.
How to Read the Score
The score ranges from 0 to 100.
For USD/ZAR:
* Score above 70: Bullish USD/ZAR, indicating potential ZAR weakness.
* Score below 30: Bearish USD/ZAR, indicating potential ZAR support or rand strength.
* Score between 30 and 70: Neutral or mixed conditions.
The signal should not be used as a blind buy or sell trigger. It is best used as a market regime and trade-filtering tool.
How to Use It
1. Open a ZAR currency pair on TradingView, such as `OANDA:USDZAR`.
2. Apply the Novaque ZAR Research Dashboard indicator to the chart.
3. Start on the daily or 4-hour timeframe to establish the broader bias.
4. Move down to the 1-hour or 15-minute timeframe to look for execution opportunities.
5. Use the dashboard score to confirm whether price action, momentum and volatility are aligned.
6. Avoid trades when the score is neutral and the chart structure is unclear.
7. Use the EMAs, Bollinger Bands, support/resistance and market structure to define entries, invalidation and risk-reward.
Practical Trading Interpretation
A strong setup usually requires alignment between:
* Price trading above or below key EMAs.
* Momentum confirming the direction.
* MACD histogram supporting the move.
* RSI not showing extreme exhaustion.
* Volatility expanding in the direction of the trade.
* A clear market structure break, pullback or continuation setup.
For example, if USD/ZAR is below the 21, 55 and 200 EMAs, momentum is negative, and the score is below 30, the dashboard is suggesting ZAR support / USD/ZAR downside pressure. A trader could then look for bearish continuation setups, provided the risk-reward and invalidation level are clear.
If USD/ZAR is above the major EMAs, momentum is positive, and the score is above 70, the dashboard is suggesting ZAR pressure / USD/ZAR upside pressure. A trader could then look for long continuation setups after pullbacks or breakouts.
Important Notes
This indicator does not predict the future. It is a structured decision-support tool that helps traders assess whether market conditions are aligned. It should be used alongside macro context, liquidity levels, session timing, risk management and proper position sizing.
The indicator works best when used as part of a repeatable process:
Higher-timeframe bias → lower-timeframe setup → defined entry → clear invalidation → controlled risk.
Best Timeframes
Recommended timeframes:
* Daily: macro and swing bias.
* 4H: directional structure.
* 1H: tactical trade planning.
* 15M: entry refinement.
The dashboard can be applied to any FX pair, but the interpretation is specifically designed for ZAR-related pairs, especially pairs quoted as foreign currency versus rand, such as USD/ZAR, EUR/ZAR and GBP/ZAR.
Indicator

Multi-Tool: Overlays, MAs, Grid & Sessions🛠 Multi-Tool (H1/D1 Overlays, Flexible MAs & Session Grid)
📖 Introduction
The Scalp-Vision Multi-Tool is a professional analysis instrument designed specifically for scalpers and day traders. It combines the structure of higher timeframes (H1/D1) with session time markers and psychological price levels directly within the current chart. The goal is to make market context instantly readable — without having to switch timeframes.
✨ Key Features
📦 Multi-Timeframe Template Overlays (H1 & D1)
H1 Projection: The indicator takes the high and low of the last completed hourly candle and projects this range as a subtle "shadow" (box) over the current hour.
D1 Projection: Yesterday's range is overlaid as a large background frame across the current trading day.
Median Lines: Automatically calculated midlines for both time ranges serve as reference points for mean reversion trades.
Advantage: You can instantly see whether price is trading within the value area of the previous period or whether a breakout is occurring.
📈 Flexible Moving Averages (MA+)
Four MA Slots: Users can activate up to four moving averages simultaneously.
Individual Types: Each MA can be set separately as SMA (Simple), EMA (Exponential), or WMA (Weighted).
Fully Customizable: Length, color, and line width are freely adjustable for each MA, allowing strategies like the 20/200 crossover to be mapped perfectly.
🕒 Manual Session Markers (Vertical Lines)
Session Opens (Green): Vertical solid lines mark the start of the Asia, London, and New York sessions.
Session Closes (Red): Indicate the end of each respective trading session.
Flag Icons: Small icons (🇯🇵, 🇬🇧, 🇺🇸) at the bottom of the chart help with quick time orientation.
Manual Control: To avoid errors caused by timezone shifts, the hours and minutes of each session can be entered directly in the settings.
🏁 Round Numbers Grid (Psychological Levels)
100-Step Lines: Solid horizontal lines at round price levels (e.g. 1.1000, 1.1100).
50-Step Lines: Dashed lines for finer subdivision.
Global Design: The grid extends across the entire chart and helps place take-profit and stop-loss levels at institutionally relevant marks.
⚙️ User Guide & Settings
🛠 Setting Up Sessions
Since TradingView servers run globally, the safest method is manual input:
Look at your local time shown at the bottom of the time axis in the chart.
Enter the desired start and end time (hour and minute) in the fields under "Sessions (Manual Times)".
The lines will adjust to your chart immediately.
🎨 Visual Customization
Overlays: If the H1 boxes overlap the candles too heavily, reduce the opacity in the color settings of the boxes.
Line Styles: All session lines and medians can be switched from Solid to Dashed or Dotted.
💡 Trading Tips
Inside vs. Outside: Is price using the D1 median as support? A bounce is often a sign of strength.
Session Volatility: Watch the green London line (9:00 AM) — this is often where the first real trends of the day emerge.
Grid Magnetism: Round numbers frequently attract price. Use the grid to identify congested order areas. Indicator

PEAD - Post Earnings Announcement Drift* **Entry Logic (Concordant Signal):** The strategy waits for both the fundamental data, namely the earnings surprise, and the market reaction to move in the same direction. If a company reports earnings above expectations and the stock price reacts positively, this is called a **“concordant signal”**, and a long position is opened.
* **Behavior of Institutional Investors:** As noted in the source, institutional investors update their models and adjust their positions not within minutes, but through a process that takes **weeks**. This gradual trading process creates sustained buying pressure on the price, causing it to “drift” upward.
* **Duration of the Rally:** Research shows that this drift can continue for approximately **60 trading days** — around 3 months. For this reason, the strategy recommends holding the position for 60 days without setting any take-profit or stop-loss level.
* **Market Inefficiency:** Under the Efficient Market Hypothesis, all information should normally be reflected in prices immediately. However, PEAD is a **market inefficiency** documented since 1968 that violates this principle due to factors such as the slow reaction of institutions, analysts gradually revising their forecasts, and transaction costs.
In short, because it takes time for large institutional players to update their models and build substantial positions gradually in the market, you are able to benefit from this “slow” information-processing process and ride the rally. Strategy

GFG Daily Levels Auto by AgaamGFG Daily Levels Auto is a clean daily-level overlay that helps avoid a messy chart by hiding distant levels and automatically showing them only when price comes near. It tracks key levels such as premarket high/low, opening ranges, yesterday high/low, pivots, and previous HOD/LOD references while keeping the chart focused on the levels currently relevant to price action.
GFG Daily Levels Auto by Agaam
**GFG Daily Levels Auto** is a chart-overlay indicator designed to automatically display important intraday and daily reference levels on the chart. The goal of this script is to help traders keep the most useful session levels visible without manually drawing them every day.
This indicator focuses on price levels that many intraday traders watch, including premarket high/low, opening range levels, yesterday’s high/low, daily pivot levels, and previous high-of-day / low-of-day reference levels. It also includes an optional “near price” display mode that helps reduce chart clutter by showing selected levels only when price is approaching them.
## What Makes This Script Useful
Many daily-level indicators plot every level all the time, which can make the chart crowded and hard to read. This script is designed to be more flexible by giving traders control over which levels appear, how they look, and whether they should only appear when price is close.
The main idea is to combine daily market structure levels with intraday session levels in one organized overlay. This allows traders to watch important areas of interest without needing separate indicators for premarket levels, opening ranges, yesterday levels, and daily pivots.
## Main Levels Included
### Premarket High and Low
The script tracks the premarket session and records:
* PMH 1: primary premarket high
* PMH 2: secondary premarket high
* PML 1: primary premarket low
* PML 2: secondary premarket low
The second premarket levels are separated using a tick-based distance filter. This helps avoid plotting nearly identical levels too close together.
### 3-Minute Opening Range
The script can plot the high and low of the first 3 minutes after the regular market open.
These levels are labeled:
* 3H
* 3L
The 3-minute opening range is intended to be used only on 3m, 5m, and 15m charts. This keeps the feature more consistent and avoids using it on chart timeframes where the 3-minute range would not be represented clearly.
### 30-Minute Opening Range
The script can also plot the high and low of the first 30 minutes after the regular market open.
These levels are labeled:
* 30H
* 30L
The 30-minute opening range can be useful for traders who watch the first major balance area of the regular session.
### Yesterday High and Low
The indicator plots the prior daily candle’s high and low:
* YH
* YL
These levels can act as important reference areas because traders often watch whether price accepts above, rejects below, or reacts around the previous day’s range.
### Daily Pivot Levels
The script calculates classic daily pivot levels using yesterday’s high, low, and close.
Included levels:
* Pivot Point
* R1 / S1
* R2 / S2
* R3 / S3
These levels give traders a structured daily support and resistance framework based on the prior day’s price range.
### Previous HOD / LOD Reference Levels
The script also tracks previous high-of-day and low-of-day reference levels as price creates new highs or new lows during the session.
These levels are labeled:
* HOD 1
* HOD 2
* LOD 1
* LOD 2
They are designed to show earlier intraday high/low reference areas that may still matter after price has moved beyond them.
## Auto Near Price Mode
One of the key features of this script is the optional **Auto Show Only Near Price** mode.
When enabled, selected levels appear only when price is close to them. The script measures distance using:
* Tick distance
* ATR-based distance
* Actual candle touch of the level
This helps keep the chart cleaner by hiding levels that are far away from current price action. When price comes close to a level, the line and label become visible again.
This feature is useful for traders who want the important levels available, but do not want every daily level displayed across the chart at all times.
## ATR and Tick-Based Approach Distance
The near-price logic can use a fixed tick distance and/or an ATR multiplier.
The tick distance gives a fixed market-based approach zone.
The ATR setting adjusts the approach distance based on current volatility.
Using both allows the indicator to adapt better across different instruments and market conditions.
## Custom Line Styles
Each major level type has its own style controls.
Users can adjust:
* Line style: solid, dashed, or dotted
* Line width
* Line color
* Label visibility
* Label size
* Line extension
* Left and right line length
This makes the indicator flexible for different chart layouts and personal visual preferences.
## Labels
The script includes optional labels for each level. Labels show the level name and price, such as:
PMH 1
PML 1
3H
3L
30H
30L
YH
YL
P
R1
S1
Labels can be turned on or off by category, allowing traders to keep the chart clean while still seeing the level names they care about.
## How Traders Can Use It
This indicator can be used as a daily level map for intraday trading.
Possible uses include:
* Watching reactions at premarket high and low
* Using 3-minute or 30-minute opening range levels as intraday reference areas
* Tracking whether price accepts or rejects yesterday’s high/low
* Watching daily pivot levels for possible support or resistance
* Keeping previous HOD/LOD levels visible as intraday structure
* Reducing clutter with the near-price auto display mode
A possible workflow is:
1. Load the indicator before the session begins.
2. Let the script automatically calculate premarket and opening range levels.
3. Watch how price behaves when it approaches a visible level.
4. Use the level as context, not as an automatic entry signal.
5. Combine the level with price action, volume, trend, and risk management.
## Important Notes
This script is a level-mapping tool, not an automatic buy or sell system.
A level appearing on the chart does not mean price must reverse there. Levels should be treated as areas of interest where traders can watch for reaction, rejection, breakout, retest, or continuation.
Daily levels and pivot levels are based on the prior daily candle data provided by TradingView for the selected symbol. For some instruments, especially futures, daily data may include extended-hours movement depending on the symbol and chart settings.
## Disclaimer
This indicator is for educational and informational purposes only. It is not financial advice, investment advice, or a guaranteed trading system. Trading involves risk, and every trader is responsible for their own decisions. Always use proper risk management.
Indicator

Indicator

Indicator
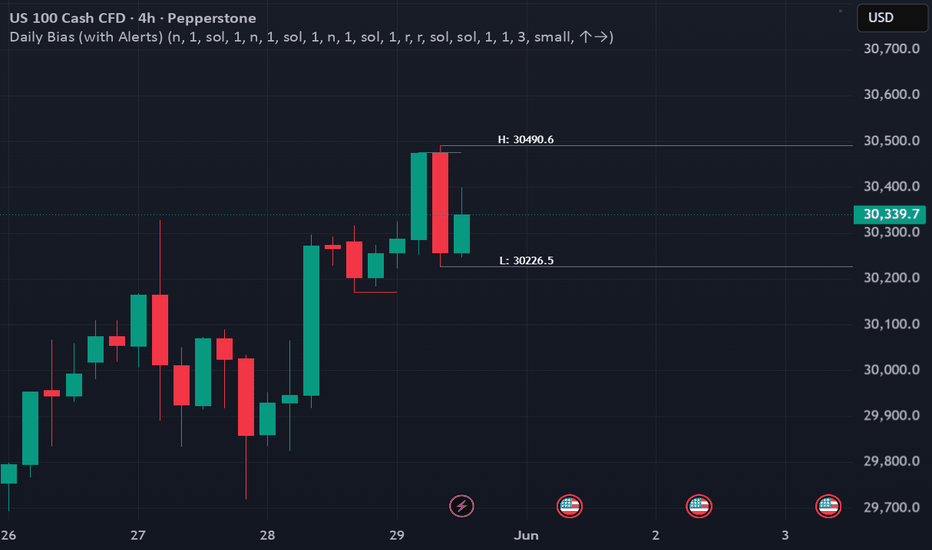
Avg Weekly Move + ImpliedProjects the expected weekly range and the key levels that drive it, anchored to the current week and readable on any timeframe; no repaint.
What it plots
- Average weekly move band — the mean weekly move over a configurable lookback, drawn as upper/lower lines around an anchor (this week's open or prior week's close). Choose Close-to-Close or High-Low Range, and Percent basis (scales to current price) or raw Points.
- Implied move overlay (manual) — enter the expected move from your broker's option chain for the weekly expiry; plots a dashed band and shows the implied-vs-realized ratio so you can see if options are pricing more or less than history.
- Prior-week high / low — the prior week's range edges, the levels price most often reaches for.
- OpEx markers — faded shading on monthly 3rd-Friday expirations, with quad-witching (Mar/Jun/Sep/Dec) in its own color and an optional charm run-in shade.
- Dashboard (bottom-right) — avg move, implied (+ ratio), band "held %" reliability, prior-week levels, next OpEx. date/type/phase, and a per-symbol PWH-reliability flag.
How to read it
- "Held %" tells you how often the band actually contained the week — high = trustworthy, low = the symbol's vol outruns its average (treat the band loosely).
- The PWH flag reads "Reliable here" on broad-index symbols and "Weak" on range-bound names...the prior-high draw is strongest on indices; back-tested this over 3 years.
Notes
- Non-repainting: all weekly values come from completed weeks via higher-timeframe data, so they stay fixed intra-week and read identically on 15m, 1H, or daily.
- The Implied Move is a manual input (Pine can't access options data) — refresh it each week per symbol. I use ThinkOrSwim for finding the Implied Move.
- Works on any symbol; OpEx dates are universal, but the OpEx behavioral context was studied on index products. I imagine, a date or two could be off, but you can save and adjust the code as you see fit. Indicator

Strategy

XMR Grid - Long IndicatorXMR Grid — Long Indicator
🔷 What it does:
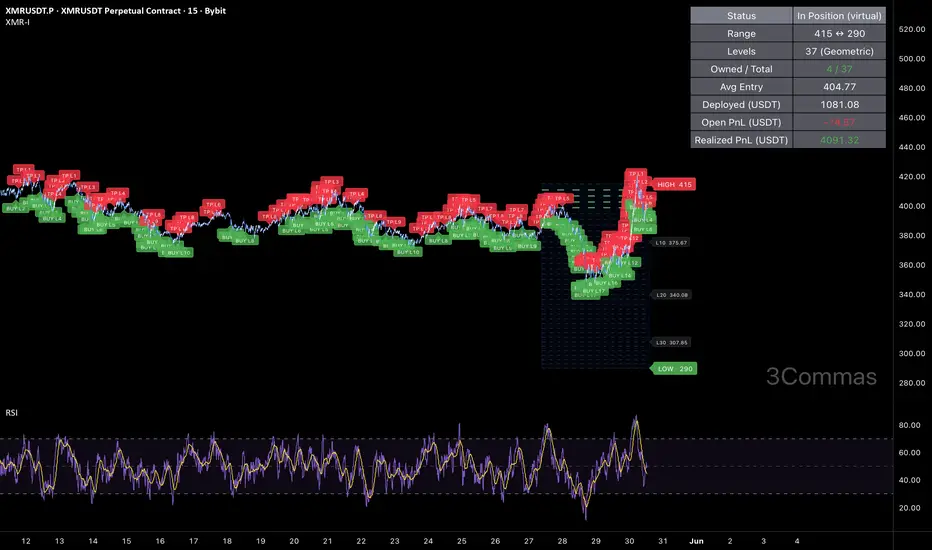
This is a signal-only indicator that mirrors a price-grid long workflow on XMR / USDT between two fixed bounds. It tracks up to 37 independent virtual slots between a configurable High and Low — each slot fires a webhook-ready buy signal when price crosses down through it, and a paired sell signal when price subsequently crosses up through the slot immediately above. The indicator computes a running average entry, total deployed capital, and open PnL from the live slot ledger and renders all of it on the chart.
- Pre-computes 7–200 grid levels in Geometric (default) or Arithmetic spacing.
- Each slot is an independent ownership flag with its own buy/sell webhook payload.
- Avg entry is derived from fill-by-fill bookkeeping — total cost and total qty are updated on every event.
- Every event emits a webhook-ready JSON alert payload tagged with the specific grid slot.
🔷 Who is it for:
- Swing traders harvesting volatility on XMR in range-bound regimes.
- Bot operators looking for a chart-driven signal source that emits per-slot JSON ready for a DCA Bot configured for grid execution.
- Traders who want to monitor a virtual grid state — avg entry, owned slots, deployed capital, open PnL — directly on the chart without a backtest engine.
- Portfolio operators using a high-trade-count contributor alongside directional strategies.
🔷 How does it work:
Grid Construction: On script load, the indicator computes N price levels between the configured High and Low bounds. In Geometric mode (default), level k is at High × (Low/High)^(k/(N-1)), giving constant percent spacing — approximately 1.0% per step at default settings. In Arithmetic mode, levels are linearly spaced by absolute price.
Per-Slot State Machine: Each grid level is an independent slot tracked by a boolean ownership flag. When close price crosses down through an empty slot's level, the slot is marked owned, virtual cost-basis is added, and the BUY webhook payload is dispatched. When close price crosses up through the level immediately above an owned slot, the slot is marked free, virtual cost-basis is subtracted, and the SELL webhook payload is dispatched.
Honest Virtual Bookkeeping: Total cost and total qty are updated incrementally on each event, so the avg entry, deployed capital, and open PnL displayed in the status table reflect the actual broker-equivalent position state — no shortcuts from base entry, no synthetic averaging. The table also accumulates the realized PnL from every closed slot (the exact round-trip profit between adjacent levels), so it shows how much the grid has actually earned over the chart history.
No Trailing, No Stop Loss: By design, each slot has a fixed exit (the level above). The indicator never trails the exit and never signals a slot-out for a loss — slots that fall below their entry stay owned until price comes back. This is the canonical grid-bot behavior.
🔷 Why it's unique:
- Per-Level Webhook Ledger: Every BUY and SELL emits a fully-formed JSON alert payload tagged with the specific grid slot ("Grid_BUY_L5" / "Grid_TP_L5"). The indicator can drive a DCA Bot configured for grid emulation without any glue layer.
- Fill-by-Fill Avg Entry: The orange avg-entry line is derived from running totals updated on every event — what you see is what the broker-equivalent position would actually have.
- Active Slot Highlighting: Owned grid levels are rendered with a thicker green stroke; empty slots stay dashed gray. Slot density and current loading are visible at a glance.
- Range Box & Bounds Labels: A semi-transparent box spans the configured High/Low range, and crisp HIGH/LOW labels mark the bounds — the grid topology is obvious without zooming.
- Calibrated for XMR 15m: Default bounds, level count, and step size are set against XMR's recent observed range. The 37-level geometric ladder gives roughly 1.0% per step — wide enough to clear perpetual taker fees on each round-trip, granular enough to keep catching 15m swings inside the range.
🔷 Considerations Before Using the Indicator:
Market Selection & Range Validity: Grid strategies are most profitable in range-bound, mean-reverting markets. On strong directional trends below the configured Low, slots will keep marking as owned as price falls and won't free until price reverses. The default High/Low (415 / 290) was set against XMR's recent observed range; update both whenever the regime changes.
Capital Deployment: The default Total Investment of 10,000 USDT is a virtual reference used for the avg-entry and open-PnL computation. The real sizing happens on the bot side — match the indicator's per-slot allocation to your bot's grid configuration to keep the avg-entry display honest.
Cross Detection Granularity: Crossings are detected on bar close, comparing the current close to the previous close. A bar that spikes through a level and returns within the same bar may be missed by design — this prevents over-signaling on intra-bar wicks.
Live vs Historical State: The virtual slot ledger is rebuilt from chart history each time the indicator is recompiled. If the indicator is added mid-deployment or the live bot diverges from the signal stream (manual interventions, partial fills), the indicator state may not match the live bot. Toggle the indicator off and on to reset.
No Stop Loss: There is no exit signal on adverse moves below the lowest grid level. Risk is structurally capped on the bot side by the bounded Total Investment configured at the bot. If a hard stop is required, layer it on the bot side.
Backtesting Note: This is an indicator, not a strategy. There is no built-in P&L tester. For performance metrics over a ~3.2-month sample (733 closed trades, 72.71% win rate, 3.59% max drawdown, profit factor 2.48, +14.18% net return), use the companion strategy version on identical parameters.
🔷 How to Use It:
🔸 Add the indicator to a XMR / USDT 15m chart.
🔸 Set the High and Low bounds to a range you expect XMR to respect.
🔸 Pick Geometric (default, recommended) or Arithmetic spacing.
🔸 Set Grid Levels (7–200) and the virtual Total Investment used for avg-entry computation.
🔸 In the DCA Bot Webhook group, paste your Bot ID, Email Token, and Pair (QUOTE_BASE format, e.g., USDT_XMR).
🔸 Create an alert on the indicator with "Any alert() function call". Paste the DCA Bot's webhook URL into the alert's Webhook field. Every grid-level buy and grid-level close will emit a dedicated JSON payload tagged with the slot index, so each level can be tracked independently downstream.
🔷 INDICATOR SETTINGS
High Price: Top of the grid. The highest level a slot can be created from.
Low Price: Bottom of the grid. The lowest level a slot can be created from.
Grid Levels: Number of price levels between High and Low (default 37, range 7–200).
Spacing Mode: Geometric (constant percent step) or Arithmetic (constant absolute step).
Total Investment (USDT): Virtual capital allocated across all slots. Used for the avg-entry and open-PnL computation only.
Bot ID / Email Token / Pair: Webhook fields injected into every alert payload.
Visualization: Toggle grid lines, range box, HIGH/LOW labels, avg entry plot, fill labels, signal triangles, status table (shows status, range, levels, owned slots, avg entry, deployed capital, open PnL, and cumulative realized PnL).
Brand Watermark: Configurable text, position, size, and transparency.
👨🏻💻💭 We hope this tool helps enhance your trading. Your feedback is invaluable, so feel free to share any suggestions for improvements or new features you'd like to see implemented.
__
The information and publications within the 3Commas TradingView account are not meant to be and do not constitute financial, investment, trading, or other types of advice or recommendations supplied or endorsed by 3Commas and any of the parties acting on behalf of 3Commas, including its employees, contractors, ambassadors, etc. Indicator

XMR Grid Bot - Long StrategyXMR Grid Bot — Long Strategy
🔷 What it does:
This is a long-only price-grid strategy that harvests volatility on XMR / USDT through repeated round-trips on a pre-defined ladder of price levels between two fixed bounds. Each level is an independent slot: when price crosses down through a level, the strategy opens one slot; when price subsequently crosses up through the level immediately above, that slot is closed for a fixed round-trip profit. The grid is generated geometrically by default, so spacing adapts to the price scale.
- Up to 37 simultaneous long slots at default settings, each sized as a fixed fraction of the configured Total Investment.
- No trailing exit, no stop loss — each slot's exit is the level above its entry.
- Per-slot exposure is approximately 2.70% of equity at default settings, comfortably inside the 5–10% per-trade risk band.
- Every fill and close emits a webhook-ready JSON alert payload tagged with the specific grid slot.
🔷 Who is it for:
- Swing traders harvesting volatility on XMR in range-bound regimes.
- Bot operators looking for a chart-driven signal source with per-slot webhook JSON ready to drive a DCA Bot configured for grid execution.
- Traders running a portfolio of low-correlation strategies who want a high-trade-count contributor with bounded per-trade risk.
- Range traders who prefer mechanical execution over discretionary entries.
🔷 How does it work:
Grid Construction: On script load, the strategy computes N price levels between the configured High and Low bounds. In Geometric mode (default), level k is at High × (Low/High)^(k/(N-1)), giving constant percent spacing — approximately 1.0% per step at default settings. In Arithmetic mode, levels are linearly spaced by absolute price.
Per-Slot Logic: Each grid level is an independent slot tracked by a boolean ownership flag. When bar close moves price down through an empty slot's level, a long is opened at that level for one slot's worth of capital (Investment / N). When bar close moves price up through the level immediately above an owned slot, that slot is closed, locking the round-trip profit between the two adjacent levels.
No Trailing, No Stop Loss: By design, each slot has a fixed exit (the level above). The strategy never trails the exit and never stops a slot out for a loss — slots whose entry price is below current market simply wait until price comes back. This is the canonical grid-bot behavior.
Capital Bounds: Total deployed capital cannot exceed the configured Investment. When all 37 slots are filled, no new orders are opened until price rises and starts closing slots. This structural cap is the strategy's primary risk control.
🔷 Why it's unique:
- Per-Level Webhook Ledger: Every fill and close emits a fully-formed JSON alert payload tagged with the specific grid slot ("Grid_BUY_L5" / "Grid_TP_L5"). The strategy can drive a DCA Bot configured for grid emulation without any glue layer.
- Pre-Allocated State: All up to 200 slot ledgers live in fixed-size arrays, so state lookups are constant-time and the chart can render every active slot with no performance overhead.
- Honest Backtest Surface: The avg entry line plotted on the chart and the open PnL displayed in the status table both reflect the actual broker-equivalent position state — derived from fill-by-fill bookkeeping, not synthetic averaging.
- Calibrated for XMR 15m: Default bounds, level count, and step size are set against XMR's recent observed range. The 37-level geometric ladder gives roughly 1.0% per step — wide enough to clear perpetual taker fees on each round-trip, granular enough to keep catching 15m swings inside the range.
🔷 Considerations Before Using the Strategy:
Market Selection & Range Validity: Grid strategies are most profitable in range-bound, mean-reverting markets. On strong directional trends below the configured Low, slots will keep loading as price falls and won't close until price reverses. The default High/Low (415 / 290) was set against XMR's recent observed range; update both whenever the regime changes.
Capital Deployment & Drawdown: The default Investment of 10,000 USDT equals 100% of starting capital — high-conviction setting that assumes the configured range holds. Per-slot risk remains low (~2.70% of equity), but if price collapses below the Low bound, aggregate unrealized loss can grow further. Scale the Investment input down to match the worst-case drawdown you are willing to absorb in a range-break scenario.
No Stop Loss Justification: There is no exit on adverse moves below the lowest grid level. The strategy's per-trade risk is structurally capped by the per-slot allocation (Investment / N levels) — at defaults that is ~270 USDT per slot, well inside the conventional 5–10% per-trade band. The aggregate unrealized exposure is controlled separately via the Investment input.
Trade Volume & Fees: Grid bots on 15m generate a high number of round-trips. The ~1.0% step is deliberately wider than a tight scalp grid so each round-trip comfortably clears the perpetual taker fee. The default commission (0.06% per trade) is calibrated for Bybit perpetual taker conditions; any mismatch with your exchange's actual fees will materially shift the results.
Demo Testing: Always demo-test before going live. Past results do not guarantee future performance, especially on a strategy whose profitability is bounded by the chosen High/Low range remaining valid.
🔷 STRATEGY PROPERTIES
Symbol: BYBIT:XMRUSDT.P (Perpetual) — strategy is portable to any XMR / USDT pair.
Timeframe: 15M
Test Period: February 22, 2026 — May 30, 2026 (~3.2 months).
Initial Capital: 10,000 USDT.
Total Investment: 10,000 USDT (100% of capital, high-conviction setting).
Order Size per Slot: Investment / 37 ≈ 270 USDT (~2.70% of equity).
Commission: 0.06% per trade.
Slippage: 3 ticks.
Margin for Long Positions: 100%.
Indicator Settings: Default Configuration.
Grid Bounds: High 415 / Low 290 (range −30.12%).
Grid Levels: 37 (Geometric spacing, ~1.0% per step).
Stop Loss: None — per-slot allocation is the structural risk cap.
Trailing: None.
Strategy: Long Only.
🔷 STRATEGY RESULTS
⚠️ Remember, past results do not guarantee future performance.
Net Profit: +1,418.07 USDT (+14.18%)
Max Equity Drawdown: 375.32 USDT (3.59%)
Total Closed Trades: 733
Percent Profitable: 72.71% (533 / 733)
Profit Factor: 2.48
🔷 How to Use It:
🔸 Adjust Settings: Open the strategy inputs and set the High and Low bounds to a range you expect XMR to respect. Pick Geometric for percent-spaced levels (default, recommended) or Arithmetic. Set Grid Levels (7–200) and Total Investment to match your risk profile.
🔸 Results Review: Run a full-period backtest and confirm Max Drawdown stays within your personal risk band. Validate that the trade count is high enough to be statistically meaningful (≥ 100 closed trades is a reasonable floor — at default settings the strategy typically generates several hundred round-trips per 3-month window on XMR 15m).
🔸 Create alerts to trigger the DCA Bot: Add one alert on the strategy using "Any alert() function call". Paste your DCA Bot's webhook URL into the alert's Webhook field, and fill the Bot ID, Email Token, and Pair inputs on the script. Every grid-level buy and grid-level close will emit a dedicated JSON payload tagged with the slot index, so each level can be tracked independently downstream.
🔷 INDICATOR SETTINGS
High Price: Top of the grid. The highest level a slot can be created from.
Low Price: Bottom of the grid. The lowest level a slot can be created from.
Grid Levels: Number of price levels between High and Low (default 37, range 7–200).
Spacing Mode: Geometric (constant percent step) or Arithmetic (constant absolute step).
Total Investment (USDT): Total capital allocated across all slots. Per-slot size = Investment / Grid Levels.
Bot ID / Email Token / Pair: Webhook fields injected into every alert payload.
Visualization: Toggle grid lines, range box, HIGH/LOW labels, avg entry plot, fill labels, status table.
Brand Watermark: Configurable text, position, size, and transparency.
👨🏻💻💭 We hope this tool helps enhance your trading. Your feedback is invaluable, so feel free to share any suggestions for improvements or new features you'd like to see implemented.
__
The information and publications within the 3Commas TradingView account are not meant to be and do not constitute financial, investment, trading, or other types of advice or recommendations supplied or endorsed by 3Commas and any of the parties acting on behalf of 3Commas, including its employees, contractors, ambassadors, etc. Strategy

Indicator

Indicator

Indicator
Indicator

Indicator

GFG Institutional Pressure Candle Overlay by AgaamGFG Institutional Pressure Candle Overlay by Agaam
This indicator is designed to help identify potential institutional-style buying pressure, selling pressure, and absorption directly on the chart.
The script analyzes each candle using multiple pressure factors, including candle body strength, close location, relative volume, ATR range expansion, VWAP position, and wick rejection. It then assigns a simple 0–10 pressure score and displays clean BUY or SELL labels when pressure conditions are detected.
Main Features:
* BUY and SELL pressure labels with 0–10 scoring
* Candle coloring based on detected pressure
* VWAP control filter
* Relative volume pressure filter
* ATR expansion filter
* Wick-based absorption detection
* Optional labels for all signals or strong signals only
* Status table showing pressure score, volume ratio, range/ATR, body %, close location, and VWAP position
* Alerts for buy pressure, sell pressure, and strong pressure conditions
How It Works:
Bullish pressure is detected when candles show strong body structure, close near the high, volume support, ATR expansion, and VWAP control.
Bearish pressure is detected when candles show strong downside structure, close near the low, volume support, ATR expansion, and VWAP control.
Absorption logic looks for high-volume candles with smaller bodies and larger wicks, which may suggest that one side is absorbing orders near a key level.
Suggested Use:
This indicator works best as a confirmation tool together with market structure, VWAP, supply/demand zones, support/resistance, and multi-timeframe analysis.
Example:
* Demand zone + BUY score = stronger bullish confirmation
* Supply zone + SELL score = stronger bearish confirmation
* High score near liquidity sweep = possible institutional reaction area
This indicator does not predict the future and does not confirm real institutional orders. It is an analytical tool that estimates pressure using price action, volume, volatility, VWAP, and candle behavior.
Disclaimer:
This script is for educational and informational purposes only. It is not financial advice. Trading involves risk, and you are responsible for your own trading decisions. Always use proper risk management.
Indicator

Indicator

Indicator

WSD - Seasonality Pro📈 WSD - Seasonality Pro
Overview
WSD - Seasonality Pro is an advanced asset-class agnostic data-mining tool designed to extract, isolate, and project multi-year seasonal tendencies directly onto your chart. By processing historical daily logs, the engine calculates baseline performance across specific phases of the calendar year, producing an institutional-grade seasonal roadmap. It visualizes both a comprehensive historical benchmark and a forward-looking Forecast Window to help traders align with cyclical market flows.
Key Features
Dual Calculation Engines
Trading Days Mode: Filters out weekends and non-trading periods. Optimized for structured execution environments like Forex, Global Indices (NASDAQ, DAX), and Commodities (Gold, USOIL).
Calendar Days Mode: Tracks a continuous, uninterrupted 365-day loop. Engineered specifically for Crypto markets.
US Presidential Electoral Cycle Filtering
Allows macro-driven traders to isolate historical performance based on the 4-year US political cycle. You can filter the data engine to strictly analyze:
Election Years
Post-Election Years
Midterm Years
Pre-Election Years
Mathematical Detrending & Volatility Scaling
To prevent historical multi-year trends from distorting cyclical data, the script mathematically removes baseline price drift (slope detrending). It then dynamically recalibrates the visual range using the asset's current Average True Range (ATR), ensuring the seasonal curves match today's exact volatility regime.
Optimized Vector Visuals
Utilizes native Pine Script v6 polyline rendering to draw a clean, cohesive, and lag-free interface. The grey curve displays the relative historical pathway up to the current bar, while the blue extension projects the high-probability seasonal outlook for your specified forecast window.
🛠 How to Use It in Your Trading Strategy
⚠️ Important Note: This indicator is a directional roadmap, not an execution trigger. It does not provide immediate entry signals; instead, it establishes structural context.
Macro Bias Alignment: Look at the blue forecast line to see the structural tendency for the next 30 to 60 days. If the seasonal pattern points sharply upward, your structural bias for the asset should be Bullish.
Confluence Trading: Once a seasonal window (bullish or bearish) is identified, drop down to your execution timeframes. Look for technical setups—such as structural breaks, institutional order blocks, or liquidity sweeps—that align with the macro seasonal direction.
Portfolio Rebalancing: Use the Electoral Cycle filters when trading major indices to see if current geopolitical phases are historically prone to specific Q3/Q4 rallies or distribution phases. Indicator

Sector Rotation (Zeiierman)█ Overview
Sector Rotation (Zeiierman) is a relative strength rotation tool designed to compare multiple sectors against a selected benchmark and visualize how leadership shifts across the market over time.
Instead of viewing sector performance as isolated price charts, the script converts each sector into a normalized RS-Ratio and RS-Momentum reading, then plots them inside a four-quadrant rotation map.
The result is a clean visual framework for identifying which sectors are Leading, Weakening, Lagging, or Recovering relative to the broader market.
█ How It Works
⚪ Relative Strength Rotation Engine
Each sector is measured against a benchmark symbol, such as VTI or SPY, by dividing the sector’s price by the benchmark price.
ratio = sc / benchClose
This relative strength ratio is normalized into an RS-Ratio value centered around 100. A second momentum calculation measures the rate of change of that RS-Ratio and normalizes it into RS-Momentum, also centered around 100.
rsr = 100.0 + (ratio - basis) / sd
roc = rsr - rsr
rsm = 100.0 + (roc - mb) / msd
Together, these two values create the X and Y coordinates for each sector:
• RS-Ratio above 100 → relative strength is above average
• RS-Ratio below 100 → relative strength is below average
• RS-Momentum above 100 → relative momentum is improving
• RS-Momentum below 100 → relative momentum is weakening
⚪ Four-Quadrant Rotation Map
The chart is divided into four market rotation phases:
phase(float x, float y) =>
x >= 100 and y >= 100 ? "Leading" :
x < 100 and y >= 100 ? "Recovering" :
x < 100 and y < 100 ? "Lagging" :
"Weakening"
• Leading → strong relative strength and rising momentum
• Weakening → strong relative strength but falling momentum
• Lagging → weak relative strength and falling momentum
• Recovering → weak relative strength but improving momentum
This allows traders to quickly understand where each sector currently sits in the rotation cycle.
⚪ Sector Trails and Movement Directio n
Each sector keeps a synchronized historical trail of recent RS-Ratio and RS-Momentum points.
ax.unshift(x)
ay.unshift(y)
if ax.size() > tailLen
ax.pop()
ay.pop()
The newest point is displayed as the sector head marker, while older points form a fading tail behind it. This makes it easier to see not only where a sector is now, but also how it has been rotating over recent samples.
The table also shows each sector’s current heading, such as RS improving, RS weakening, momentum rising, or momentum falling.
dx = ax.get(0) - ax.get(1)
dy = ay.get(0) - ay.get(1)
⚪ Top-Ranked Sector Filtering
The script includes an optional ranking system that can display only the most important sector rotations.
Sectors can be ranked by:
• Fastest movement
• Movement toward Leading
• Movement toward Recovering
• Movement toward Lagging
• Movement toward Weakening
score(array ax, array ay) =>
rankMode == "Fastest movement"
? speed(ax, ay)
: target(ax, ay, rankMode)
When enabled, only the top-ranked sectors are shown on the chart and in the table, helping reduce clutter and focus attention on the most actionable rotations.
selected(int id, bool en) =>
en and (
not useRanking or
rankOf(id) <= topRankN
)
█ How to Use
⚪ Identify Sector Leadership
Look for sectors positioned in the Leading quadrant. These sectors have both strong relative strength and improving momentum compared to the benchmark. Sectors moving into Leading from Recovering can signal early leadership development.
⚪ Watch Weakening Sectors
Sectors in the Weakening quadrant still have above-average relative strength, but their momentum is declining. This can indicate that prior leaders are beginning to lose strength.
⚪ Track Recovering Rotations
Sectors in the Recovering quadrant have below-average relative strength but improving momentum. These areas may represent early rotation opportunities before relative strength fully turns positive.
⚪ Avoid or Monitor Lagging Sectors
Sectors in the Lagging quadrant show both weak relative strength and weak momentum. These sectors are typically underperforming the benchmark and may remain weak until momentum begins to improve.
⚪ Example: Ranked by Fastest Movement
In this example, the ranking mode is set to Fastest Movement with Only Show Top Ranked enabled and Top X = 5.
The indicator measures how quickly each sector is moving through the rotation cycle by comparing the change in its RS-Ratio and RS-Momentum values between samples. Sectors with the largest movement are ranked highest and displayed on the chart.
As a result, only the five sectors showing the strongest relative movement are visible. In this case, all five sectors are positioned inside the Recovering quadrant, indicating that relative momentum has turned positive while relative strength remains slightly below average.
The upward and rightward trajectory of the trails suggests these sectors are improving versus the benchmark and may continue rotating toward the Leading quadrant if current momentum persists.
⚪ Example: Top 5 Sectors Ranked Toward Leading
In this example, the ranking mode is set to Toward Leading with Only Show Top Ranked enabled and Top X = 5.
Rather than ranking sectors by raw speed, the indicator prioritizes sectors moving most directly toward the Leading quadrant, where both relative strength and relative momentum are above the 100 baseline.
Technology currently holds the highest rank, as it has already entered the Leading quadrant with both RS-Ratio and RS-Momentum above 100. Its trail shows a strong and sustained rotation from weaker relative conditions into market leadership, making it the strongest candidate according to the selected ranking method.
Discretionary and Financials are positioned inside the Recovering quadrant. Although they have not yet reached leadership status, their improving momentum and trajectory toward the upper-right portion of the chart suggest continued relative improvement versus the benchmark.
Meanwhile, Staples and Real Estate remain in the Lagging quadrant. However, they are still included in the ranking because their recent movement is directed toward the Leading quadrant, indicating potential early-stage rotation despite their current relative weakness.
This ranking mode is particularly useful for identifying sectors that are not necessarily the strongest today, but are showing the most meaningful progress toward future leadership. By focusing on directional rotation rather than speed alone, traders can often spot emerging leaders before they fully establish themselves in the Leading quadrant.
⚪ Example: Top 5 Sectors Ranked Toward Recovering
In this example, the ranking mode is set to Toward Recovering with Only Show Top Ranked enabled and Top X = 5.
This ranking method prioritizes sectors moving most directly toward the Recovering quadrant, where relative strength remains below average but relative momentum is improving. The goal is to identify sectors that may be emerging from periods of relative underperformance and beginning a new rotation cycle.
Communication Services holds the highest rank in this example. Its trail shows a strong upward movement from the Lagging quadrant into Recovering, indicating a significant improvement in relative momentum while still trading below the relative strength baseline.
Consumer Staples and Real Estate also display characteristics of sectors transitioning toward recovery. Their recent movement suggests momentum is improving despite their relative strength remaining below average.
Technology appears in the Leading quadrant, while Energy remains in Lagging. Although they occupy different quadrants, both are included because their recent directional movement aligns with the path toward the Recovering quadrant based on the ranking algorithm.
This ranking mode is particularly useful for traders seeking early rotation opportunities. Rather than focusing on sectors that are already leading, it highlights areas of the market where momentum is beginning to improve and where relative strength may eventually follow if the recovery continues.
⚪ Example: Top 5 Sectors Ranked Toward Lagging
In this example, the ranking mode is set to Toward Lagging with Only Show Top Ranked enabled and Top X = 5.
This ranking method prioritizes sectors moving most directly toward the Lagging quadrant, where both relative strength and relative momentum fall below the 100 baseline. It helps identify sectors that are losing leadership, weakening relative to the benchmark, or entering periods of sustained underperformance.
Technology and Health Care are currently positioned inside the Weakening quadrant. Both sectors still maintain above-average relative strength, but their declining momentum suggests they are rotating away from leadership and moving closer toward Lagging conditions.
Meanwhile, Staples, Utilities, and Real Estate remain within the Recovering quadrant. Although momentum is still positive, their relative strength remains below average. Their inclusion in the ranking reflects the direction of their recent movement rather than their current location, indicating they are rotating toward weaker relative conditions.
The trails highlight this transition clearly, with several sectors showing movement away from stronger quadrants and toward areas associated with declining performance.
This ranking mode is useful for identifying sectors that may be losing institutional sponsorship, weakening relative to the broader market, or approaching the later stages of the relative strength cycle. Traders can use it to spot deteriorating leadership and monitor sectors that may continue underperforming if current trends persist.
⚪ Example: Top 5 Sectors Ranked Toward Weakening
In this example, the ranking mode is set to Toward Weakening with Only Show Top Ranked enabled and Top X = 5.
This ranking method prioritizes sectors moving most directly toward the Weakening quadrant, where relative strength remains above average but relative momentum has begun to deteriorate. These sectors often represent former leaders that are losing momentum before potentially transitioning into the Lagging quadrant.
Technology holds the highest rank in this example. While its relative strength remains above the 100 baseline, its momentum has fallen below 100, placing it firmly inside the Weakening quadrant. Its recent trail illustrates a loss of momentum despite previously strong relative performance, making it a textbook example of a sector rotating away from leadership.
Health Care remains in the Leading quadrant but is also ranked highly because its recent movement is directed toward Weakening. Although it continues to outperform the benchmark, the decline in momentum suggests its leadership position may be starting to fade.
Materials is already positioned within the Weakening quadrant, while Energy and Real Estate remain in Recovering. Their inclusion reflects the direction of their recent movement rather than their current location, indicating they are rotating toward conditions associated with weakening relative performance.
This ranking mode is useful for identifying sectors that may be nearing the end of their leadership cycle. Traders often monitor these sectors for signs of continued momentum deterioration, profit-taking activity, or a potential transition into the Lagging quadrant if relative strength begins to weaken further.
█ Settings
Benchmark: Selects the symbol each sector is compared against.
Calculation Timeframe: Defines the timeframe used for all relative strength and momentum calculations.
RS-Ratio Lookback: Controls the normalization period for relative strength.
RS-Momentum Lookback: Controls how quickly momentum responds to changes in RS-Ratio.
Tail Length: Sets how many historical samples are shown behind each sector.
Sample Every N Bars: Controls how frequently new trail points are recorded.
Show Sector Table: Shows or hides the summary table with phase, heading, RS, and momentum values.
Only Show Top Ranked: Enables filtering so only the strongest ranked sectors are displayed.
Top X: Defines how many ranked sectors remain visible.
Rank By: Selects how sectors are ranked, either by speed or movement toward a selected quadrant.
Sector Inputs: Allows each sector to be enabled, disabled, customized, or replaced with another symbol.
Canvas Width: Controls the horizontal size of the rotation map.
Canvas Height: Controls the vertical size of the rotation map.
Symmetric Bounds Around 100: Keeps the chart balanced around the 100 baseline.
Minimum Axis Span: Prevents small movements from being visually exaggerated.
-----------------
Disclaimer
The content provided in my scripts, indicators, ideas, algorithms, and systems is for educational and informational purposes only. It does not constitute financial advice, investment recommendations, or a solicitation to buy or sell any financial instruments. I will not accept liability for any loss or damage, including without limitation any loss of profit, which may arise directly or indirectly from the use of or reliance on such information.
All investments involve risk, and the past performance of a security, industry, sector, market, financial product, trading strategy, backtest, or individual's trading does not guarantee future results or returns. Investors are fully responsible for any investment decisions they make. Such decisions should be based solely on an evaluation of their financial circumstances, investment objectives, risk tolerance, and liquidity needs.
Indicator

LTC RSI Oversold Doubling DCA - Long IndicatorLTC RSI Oversold Doubling DCA - Long Indicator
🔷 What it does:
This is a signal-only indicator that mirrors a high-conviction LTC dip-buying workflow with an aggressive doubling-martingale safety ladder. It tracks one virtual long position at a time, opened only when LTC prints a deep oversold reading on 4-hour RSI AND trades below a configurable price ceiling. Four safety orders fire at fixed deviations from base entry (−2.5%, −5%, −10%, −20%) with sizes doubling on every rung. Exit is a wide 35% Take Profit from average entry. The indicator computes running average entry, deployed capital, open PnL, and lifetime realized PnL — all derived from honest fill-by-fill bookkeeping. Every event emits a webhook-ready JSON alert payload for direct DCA Bot consumption.
- Extremely selective dual-filter entry: 4h RSI < 29 AND close below price ceiling (default $61).
- Non-uniform fixed-deviation safety ladder: −2.5%, −5%, −10%, −20% from base entry.
- Doubling safety-order sizes: 2k / 4k / 8k / 16k USDT.
- Wide 35% Take Profit — built for deep-oversold recoveries, not scalp profit.
- Honest virtual bookkeeping: Open PnL and lifetime Total PnL displayed live on the chart.
🔷 Who is it for:
- Patient swing traders running a DCA Bot on LTC who want to ride deep oversold reversals.
- Bot operators who want a chart-driven signal source that emits per-event JSON ready for a DCA Bot.
- Traders who can absorb a doubling martingale up to 31% of equity deployed per trade in exchange for a wide 35% profit target.
- Operators tracking long-cycle position management — entry, four staged safety fills, and a single exit — directly on the chart without the strategy-tester overhead.
🔷 How does it work:
Entry Filter (Dual Gate): A 4-hour RSI(14) is sampled via request.security with lookahead disabled. The entry gate requires TWO conditions simultaneously at host-bar close: RSI must be below 29 (deep oversold) AND the close price must be below the configurable ceiling (default $61). Both gates filter out shallow dips and price moves above the strategy's "value zone".
Base Entry: When both gates align, the indicator marks a virtual long entry, captures the base entry price, and seeds the cost-basis ledger with the configured base order size (default 1,000 USDT).
Safety Order Ladder (Fixed Deviations, Doubling Sizes): After base fill, the indicator monitors price deviation against the position. Each safety order has its own fixed deviation from base entry — not a cumulative ladder. AO1 fills at close ≤ base × 0.975 (−2.5%); AO2 at −5%; AO3 at −10%; AO4 at −20%. USDT sizes double from a 2,000 first AO: 2,000 / 4,000 / 8,000 / 16,000. Each fill updates the running cost-basis and dispatches its own webhook payload.
Honest Virtual Bookkeeping: Total cost and qty are updated incrementally on every event, so the avg entry, deployed capital, Open PnL, and Total PnL displayed in the status table reflect the actual broker-equivalent position state — no shortcut from base entry, no synthetic averaging.
Lifetime Total PnL: When the position closes for profit, the realized PnL from that cycle accumulates into a lifetime counter. The status table displays both Open PnL (current cycle, resets on exit) and Total PnL (lifetime, persists across the chart history) — giving traders a real-time read on cumulative performance without a backtest engine.
Exit: A fixed 35% Take Profit above the running average entry. When close hits the TP target, the close webhook fires, realized PnL accumulates, and the virtual position resets.
🔷 Why it's unique:
- Extremely Selective Entry: Most DCA indicators fire frequently. This one is gated by two independent filters (deep RSI oversold + price ceiling) that almost never align — the companion strategy's backtest produced 11 closed trades across 4 years of LTC history.
- Non-Uniform Fixed-Deviation Ladder: Most published DCA tools use formula-based ladders (step × multiplier). This one exposes each AO deviation as a direct input, allowing asymmetric ladders like 2.5% / 5% / 10% / 20% — deeper safety orders trigger only on serious adverse moves.
- Doubling Martingale: 1 / 2 / 4 / 8 / 16 size progression scales position capital exponentially if the position runs adverse, but only inside the defined price ceiling.
- Lifetime PnL Tracking: Open PnL and Total PnL are displayed live on the chart — Open resets per cycle, Total persists across the entire chart history. The indicator gives strategy-tester-equivalent insight without running a backtest.
- Per-Event Webhook Ledger: Six discrete events per cycle (entry + 4 AO fills + TP), each with its own JSON alert payload. One TradingView alert with "Any alert() function call" drives a DCA Bot end-to-end.
🔷 Considerations Before Using the Indicator:
Selectivity & Sample Size: The companion strategy fires roughly 2–3 times per year on LTC. This is an extremely low-frequency setup by design — the entry filter is built to fire only on deep oversold prints inside the configured price ceiling. The 4-year backtest produced 11 trades with a 100% win rate and profit factor of 1,661 — these metrics reflect the entry filter's discipline, not a deterministic edge. Treat them as an indication that the setup is high-quality, not a forward-performance guarantee.
Aggressive Capital Deployment: If all four safety orders fill, total deployed capital reaches 31,000 USDT = 31% of the default reference equity. The doubling martingale amplifies both upside on recovery and risk if the lower bound breaks. Match the indicator's per-AO allocation to your bot's grid configuration to keep the avg-entry display honest.
No Stop Loss: There is no exit signal on adverse moves below AO4 (−20% from base). If price keeps falling, the virtual position holds unhedged until either price recovers to the 35% TP target or the user intervenes. Risk is structurally capped on the bot side by the bounded position ladder; if a hard exchange-side stop is required, configure it on the bot directly.
Price Ceiling Configuration: The default $61 ceiling was set against LTC's historical accumulation range. Update this input if LTC enters a new structural price regime — the indicator will not fire above the ceiling regardless of RSI readings.
Wide Profit Target: The 35% Take Profit is large by DCA standards. Position holding times can stretch into months or longer as the indicator waits for the recovery.
Cross Detection Granularity: Entries and AO fills are evaluated on bar close. A bar that spikes through a level and returns within the same bar may be missed by design — this matches realistic polling behavior and avoids over-signaling on intra-bar wicks.
Live vs Historical State: The virtual position state is rebuilt from chart history each time the indicator is recompiled. If the indicator is added mid-deployment or the live bot diverges from the signal stream (manual interventions, partial fills), the indicator state may not match the live bot. Toggle the indicator off and on to reset.
Backtesting Note: This is an indicator, not a strategy. There is no built-in P&L tester — but the live Total PnL counter in the status table gives a running approximation. For full metrics over a 4-year sample (~11 closed trades, 100% win rate, 6.50% max drawdown, profit factor 1,661, +13.91% net return), use the companion strategy version on identical parameters.
🔷 How to Use It:
🔸 Add the indicator to a LTC / USD or LTC / USDT chart on 4h.
🔸 Review the entry filters (RSI level + price ceiling), the four AO deviations and sizes, and the Take Profit percentage. Defaults are calibrated for LTC 4h — recalibrate the price ceiling whenever LTC's structural range shifts.
🔸 Set Base Order Size and AO sizes to match your bot's grid configuration (the indicator's avg-entry display becomes meaningful when virtual sizing matches real sizing).
🔸 In the DCA Bot Webhook group, paste the Bot ID, Email Token, and Pair (QUOTE_BASE format, e.g., USDT_LTC).
🔸 Create an alert on the indicator with "Any alert() function call". Paste the DCA Bot's webhook URL into the alert's Webhook field. The indicator will emit JSON payloads for entry, each safety order, and TP exit — formatted for direct DCA Bot consumption.
🔷 INDICATOR SETTINGS
Base Order Size (USDT): Virtual order size for the avg-entry / open-PnL computation.
AO1 / AO2 / AO3 / AO4 Deviation (%): Fixed distance from base entry where each safety order becomes eligible. Non-uniform by design.
AO1 / AO2 / AO3 / AO4 Size (USDT): Virtual USDT amount of each safety order. Doubles at each rung by default.
RSI Timeframe / Length / Less Than: Lower-timeframe RSI filter for the base entry.
Price Below ($): Absolute price ceiling — entry only fires below this level.
Take Profit (%): Fixed distance above the running average entry where the virtual long closes.
Active Window: Optional date filter — when ON, the indicator only fires signals between From and To dates.
DCA Bot Webhook: Bot ID, Email Token, and Pair fields injected into every alert payload.
Visualization: Toggle AO Ladder, Price Ceiling line, Avg / TP plot lines, fill labels, signal triangles, status table.
Brand Watermark: Configurable text, position, size, and transparency.
👨🏻💻💭 We hope this tool helps enhance your trading. Your feedback is invaluable, so feel free to share any suggestions for improvements or new features you'd like to see implemented.
__
The information and publications within the 3Commas TradingView account are not meant to be and do not constitute financial, investment, trading, or other types of advice or recommendations supplied or endorsed by 3Commas and any of the parties acting on behalf of 3Commas, including its employees, contractors, ambassadors, etc. Indicator

Indicator