Indicator

Strategy

Indicator

Indicator

Indicator

Strategy

Indicator

Indicator

Indicator

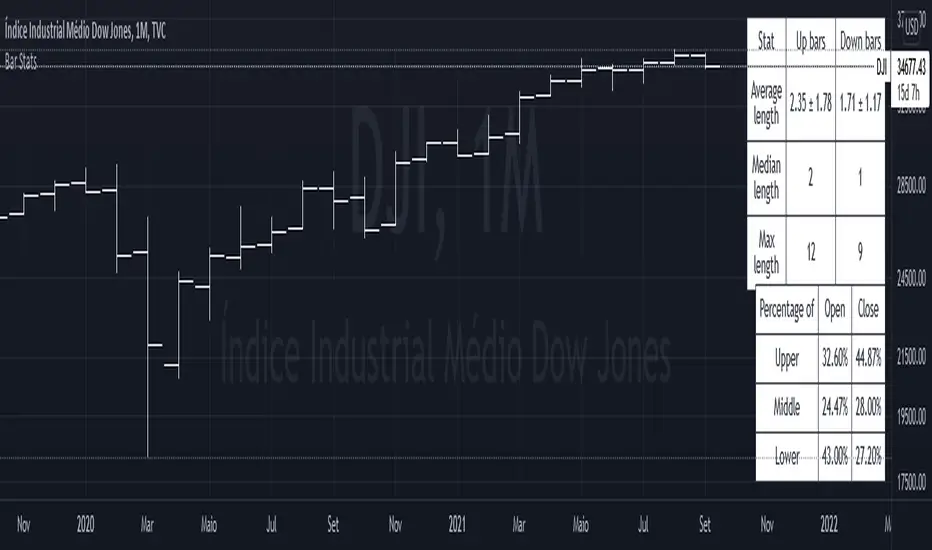
Bar StatisticsThis script calculates and displays some bar statistics.
For the bar length statistics, it takes every length of upper or lower movements and calculates their average (with SD), median, and max. That way, you can see whether there is a bias in the market or not.
Eg.: If for 10 bars, the market moved 2 up, then 1 down, then 3 up, then 2 down, and 2 up, the average up bars length would be at 2.33, while the average for the down length would be at 1.5, showing that upper movements last longer than down movements.
For the range statistics, it takes the true range of each bar and calculates where the close of the bar is in relation to the true low of it. So if the closing of the bar is at 10.0, the low is at 9.0, and the high is at 10.2, the candle closed in the upper third of the bar. This process is calculated for every bar and for both closing prices and open prices. It is very useful to locate biasses, and they can you a better view of the market, since for most of the time a bar will open on an extreme and close on another extreme.
Eg.: Here on the DJI, we can see that for most of the time, a month opens at the lower third (near the low) and closes at the upper third (near the high). We can also see that it is very difficult for a month to open or close on the middle of the candle, showing how important the first and the last day are for determining the trend of the rest of the month. Indicator

Indicator

pricing_tableThis script helps you evaluate the fair value of an option. It poses the question "if I bought or sold an option under these circumstances in the past, would it have expired in the money, or worthless? What would be its expected value, at expiration, if I opened a position at N standard deviations, given the volatility forecast, with M days to expiration at the close of every previous trading day?"
The default (and only) "hv" volatility forecast is based on the assumption that today's volatility will hold for the next M days.
To use this script, only one step is mandatory. You must first select days to expiration. The script will not do anything until this value is changed from the default (-1). These should be CALENDAR days. The script will convert to these to business days for forecasting and valuation, as trading in most contracts occurs over ~250 business days per year.
Adjust any other variables as desired:
model: the volatility forecasting model
window: the number of periods for a lagged model (e.g. hv)
filter: a filter to remove forecasts from the sample
filter type: "none" (do not use the filter), "less than" (keep forecasts when filter < volatility), "greater than" (keep forecasts when filter > volatility)
filter value: a whole number percentage. see example below
discount rate: to discount the expected value to present value
precision: number of decimals in output
trim outliers: omit upper N % of (generally itm) contracts
The theoretical values are based on history. For example, suppose days to expiration is 30. On every bar, the 30 days ago N deviation forecast value is compared to the present price. If the price is above the forecast value, the contract has expired in the money; otherwise, it has expired worthless. The theoretical value is the average of every such sample. The itm probabilities are calculated the same way.
The default (and only) volatility model is a 20 period EWMA derived historical (realized) volatility. Feel free to extend the script by adding your own.
The filter parameters can be used to remove some forecasts from the sample.
Example A:
filter:
filter type: none
filter value:
Default: the filter is not used; all forecasts are included in the the sample.
Example B:
filter: model
filter type: less than
filter value: 50
If the model is "hv", this will remove all forecasts when the historical volatility is greater than fifty.
Example C:
filter: rank
filter type: greater than
filter value: 75
If the model volatility is in the top 25% of the previous year's range, the forecast will be included in the sample apart from "model" there are some common volatility indexes to choose from, such as Nasdaq (VXN), crude oil (OVX), emerging markets (VXFXI), S&P; (VIX) etc.
Refer to the middle-right table to see the current forecast value, its rank among the last 252 days, and the number of business days until
expiration.
NOTE: This script is meant for the daily chart only. Indicator

Indicator

Indicator

Indicator

Indicator

Indicator

Indicator
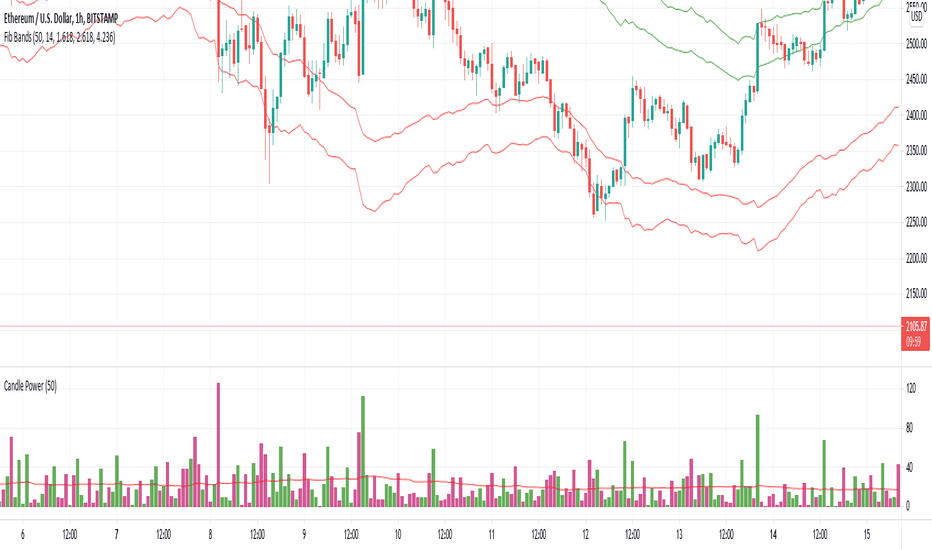
Indicator

Indicator

Indicator

Indicator

Indicator