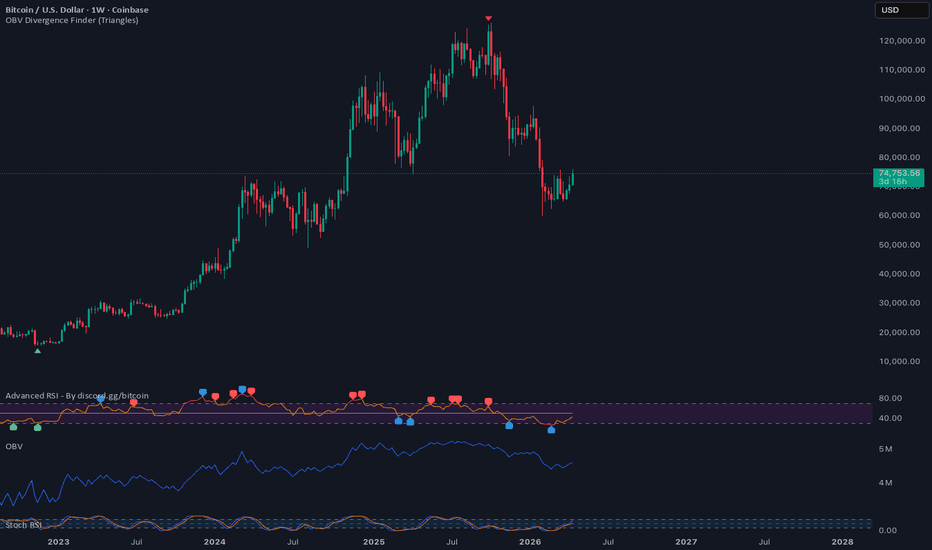
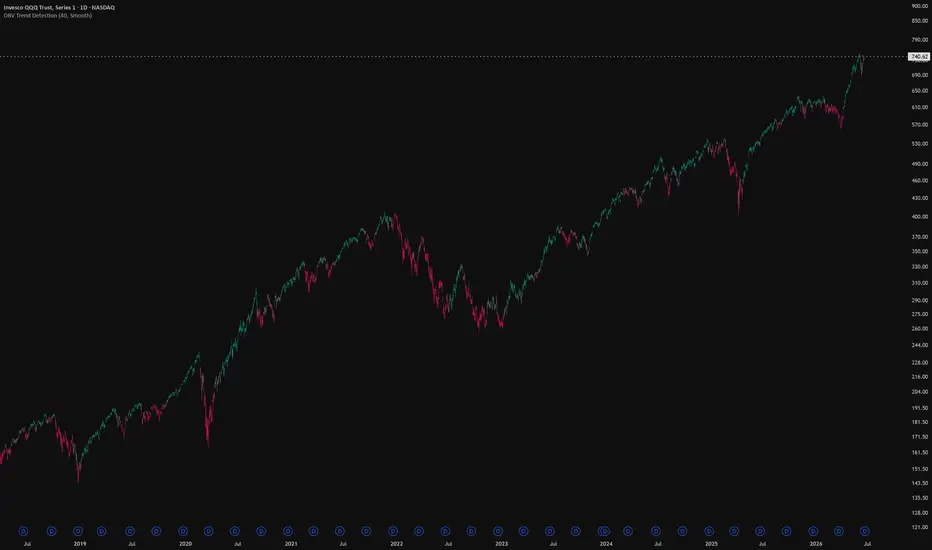
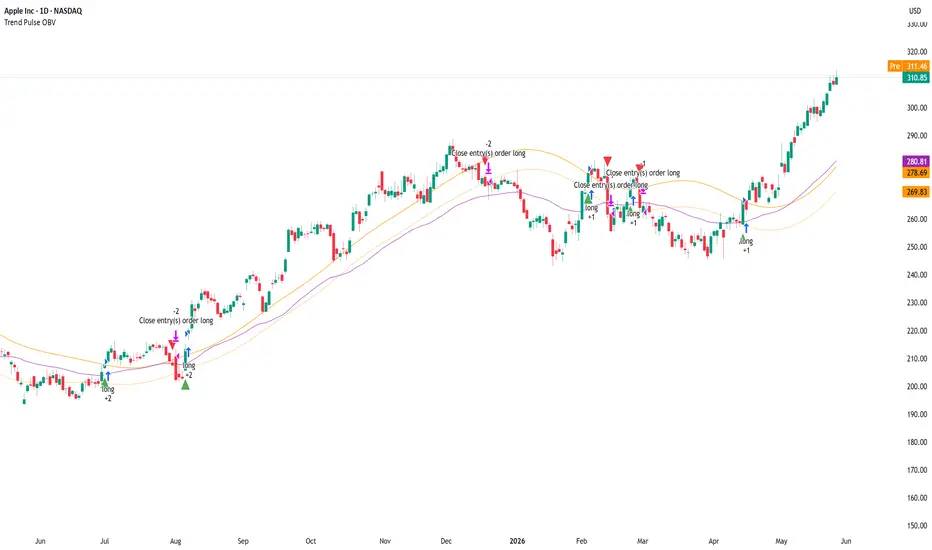
On Balance VolumeOverview
This indicator is based on On Balance Volume (OBV) and is designed to analyze the relationship between price and volume, helping traders identify potential accumulation, distribution, trend confirmation, and changes in volume flow.
In addition to the traditional OBV, the indicator allows users to apply different moving-average types to smooth the OBV and, optionally, add Bollinger Bands around the smoothed OBV.
The indicator also uses dynamic colors, making it easier to visually identify the direction of both the OBV and its moving average.
1. On Balance Volume (OBV)
OBV accumulates or subtracts volume according to price movement:
If the current closing price is higher than the previous close, volume is added to OBV.
If the current closing price is lower than the previous close, volume is subtracted from OBV.
If there is no change in price, OBV remains unchanged.
Interpretation
Rising OBV:
May indicate increasing buying pressure, accumulation, or confirmation of an uptrend.
Falling OBV:
May indicate increasing selling pressure, distribution, or confirmation of a downtrend.
OBV should not be used in isolation. Combining it with price action, trend structure, support and resistance, and other technical factors may improve the quality of the analysis.
2. OBV Dynamic Colors
The main OBV line uses three colors:
🟢 Green
OBV is increasing compared with the previous period.
This indicates positive volume flow.
🔴 Red
OBV is decreasing compared with the previous period.
This indicates negative volume flow.
🟡 Yellow
OBV has not changed compared with the previous period.
3. Smoothing
The Type setting allows users to apply a moving average to the OBV.
Available options:
None
SMA
SMA + Bollinger Bands
EMA
SMMA (RMA)
WMA
VWMA
Smoothing can be used to reduce short-term fluctuations and make the underlying direction of OBV easier to identify.
4. Moving Average Type
None
No moving average is applied.
Only the original OBV is displayed.
Useful for:
Faster analysis;
Immediate identification of OBV changes;
Traders who prefer raw volume-flow information.
SMA — Simple Moving Average
Calculates the arithmetic average of OBV over the selected number of periods.
Characteristics:
Smoother than the raw OBV;
Slower to react to sudden changes;
Useful for identifying the broader direction of volume flow.
SMA + Bollinger Bands
Applies an SMA to OBV and adds Bollinger Bands.
This option displays:
A central moving average;
An upper Bollinger Band;
A lower Bollinger Band.
The bands help identify periods when OBV is moving relatively far from its recent average.
EMA — Exponential Moving Average
The EMA gives greater weight to recent OBV values.
Characteristics:
Responds faster to changes in OBV;
Useful for short- and medium-term analysis;
Generally more responsive than an equivalent SMA.
SMMA (RMA)
The SMMA/RMA is a smoother moving average designed to reduce short-term fluctuations.
It can be useful for traders who want a more stable view of the underlying OBV trend.
WMA — Weighted Moving Average
The WMA assigns greater weight to more recent values.
It generally responds faster to changes in OBV than an equivalent SMA.
VWMA — Volume Weighted Moving Average
The VWMA weights values according to volume.
Because OBV itself is already volume-based, this option may produce a different smoothing behavior compared with traditional moving averages and should be evaluated according to the trader's strategy.
5. Length
The Length parameter determines the number of periods used to calculate the moving average.
The default value is:
14 periods
Shorter Length
Examples: 5, 9, or 10.
The moving average becomes faster and more sensitive.
Potentially useful for:
Short-term trading;
Faster detection of changes in volume flow;
Scalping and intraday strategies, depending on the market.
However, shorter lengths can also generate more noise and false signals.
Longer Length
Examples: 20, 50, or 100.
The moving average becomes slower and smoother.
Potentially useful for:
Trend analysis;
Swing trading;
Identifying the dominant volume-flow direction.
The longer the length, the greater the delay in reacting to changes in OBV.
6. Moving Average Dynamic Colors
The OBV moving average also changes color dynamically.
🟢 Green
The moving average is rising.
🔴 Red
The moving average is falling.
🟡 Yellow
The moving average is unchanged.
This allows traders to quickly identify the direction of the smoothed OBV.
7. Bollinger Bands
Bollinger Bands are available only when:
Type = SMA + Bollinger Bands
The bands are calculated using the standard deviation of OBV.
The indicator displays:
Upper Bollinger Band
SMA / Middle Band
Lower Bollinger Band
The distance between the bands expands or contracts according to changes in OBV volatility.
8. BB StdDev
The BB StdDev parameter controls the distance of the Bollinger Bands from the moving average.
Default value:
2.0
Lower value
Example: 1.0–1.5.
The bands become narrower.
This increases sensitivity and causes OBV to reach the bands more frequently.
Higher value
Example: 2.5–3.0.
The bands become wider.
This reduces the frequency of band touches and can help highlight more extreme OBV movements.
9. How to Interpret the Indicator
The indicator can primarily be used for four types of analysis:
1. Trend Confirmation
During an uptrend:
Price rising + OBV rising
may indicate volume confirmation of the bullish trend.
During a downtrend:
Price falling + OBV falling
may indicate confirmation of selling pressure.
2. Bullish Divergence
A potential bullish divergence occurs when:
Price makes lower lows while OBV makes higher lows.
This may indicate weakening selling pressure and a possible loss of bearish momentum.
3. Bearish Divergence
A potential bearish divergence occurs when:
Price makes higher highs while OBV makes lower highs.
This may indicate weakening buying pressure.
Important: Divergences do not guarantee a reversal. They should be considered warning signals and ideally confirmed by price action or other technical factors.
10. Using Bollinger Bands on OBV
When Bollinger Bands are enabled, they can help identify unusual movements in volume flow.
OBV near or above the Upper Band
May indicate an unusually strong positive OBV movement relative to its recent average.
OBV near or below the Lower Band
May indicate an unusually strong negative OBV movement.
However, touching or crossing a Bollinger Band does not automatically mean buy or sell.
During strong trends, OBV may remain near one of the bands for extended periods.
11. Suggested Settings
There is no universally optimal configuration. The appropriate settings depend on the asset, timeframe, volatility, and trading strategy.
Short-Term Analysis
A possible starting configuration:
Type: EMA
Length: 9 or 14
This provides a faster response to changes in OBV.
Medium-Term Analysis
A possible starting configuration:
Type: SMA
Length: 20
This provides a balance between responsiveness and smoothing.
Longer-Term Trend Analysis
A possible starting configuration:
Type: SMA
Length: 50
This provides greater smoothing and reduces sensitivity to short-term fluctuations.
Bollinger Band Analysis
A possible starting configuration:
Type: SMA + Bollinger Bands
Length: 20
BB StdDev: 2.0
These settings are reference points for testing and are not investment recommendations.
12. Practical Usage
One possible approach is to use the indicator together with price structure.
Potential Bullish Setup
Look for a combination such as:
Price showing a bullish market structure;
OBV rising;
OBV moving average turning green;
OBV confirming upward price movements;
A breakout or recovery of an important price level.
Potential Bearish Setup
Look for a combination such as:
Price showing a bearish market structure;
OBV falling;
OBV moving average turning red;
OBV confirming downward price movements;
A breakdown or rejection of an important price level.
The indicator is best used as a confirmation tool, rather than as the sole reason to enter a trade.
13. Recommended Starting Configuration
For traders who are new to the indicator, a simple starting configuration is:
Type: SMA
Length: 14
Then compare it with:
Type: EMA
Length: 14
Observe which configuration better represents the behavior of the asset and timeframe being analyzed.
For Bollinger Band analysis:
Type: SMA + Bollinger Bands
Length: 20
BB StdDev: 2.0
14. Important Notes
OBV is a cumulative indicator. Therefore, its absolute values can vary significantly depending on the available historical data and the asset being analyzed.
Signals should be interpreted in the context of:
Market trend;
Price structure;
Support and resistance;
Volume;
Volatility;
Timeframe;
Overall market conditions.
No parameter should be considered universally superior.
It is recommended to test different configurations using historical data, Bar Replay, and paper trading before applying any strategy to live trading.
This indicator is a technical analysis tool and does not constitute financial, investment, or trading advice. Indicator

OBV Attention Consensus Ribbon [FibonacciFlux]An experiment in reading On-Balance Volume across four timeframes at once. Published with what the measurement actually found, including the part that says the previous default could not work.
WHAT IT DOES
Inside each of four timeframes (15m, 1H, 4H, 1D by default) it builds OBV, takes the per-bar slope as the difference of two linear regressions, and standardizes that slope by the rolling standard deviation of OBV over the same timeframe. The result is a z sensor per timeframe. OBV is cumulative, so its level depends on where the chart's history begins - the slope difference and the standard deviation are both invariant to that origin, which is what makes the four timeframes comparable at all.
The white line is the weighted mean of the four z sensors. The ribbon is the weighted dispersion around that mean, so it narrows when the timeframes agree and widens when they do not. Its colour is a geometric mean of three terms: concentration (how tight the dispersion is), side agreement (how much weight sits on one sign), and acceleration agreement (how much weight is moving further in that direction). An audit table prints every sensor's z, its one-bar change, its weight, the consensus, the dispersion, the concentration, both strengths and the current state.
WHAT THE MEASUREMENT FOUND
Two things, both on 6,000 bars of BINANCE:BTCUSDT 15m (5,949 bars after warm-up, 2026-06-17 01:15Z to 2026-08-18 13:00Z), repeated identically on ETHUSDT.
First: the previous default threshold could never be reached. The strength is a geometric mean of three fractions, and the acceleration term keeps it small. Measured over the whole window, the strength peaks at 34.5 on BTCUSDT and 36.0 on ETHUSDT, with a median of 20.1 and a 99th percentile of 31.0. The shipped threshold was 60. So the coloured ribbon never appeared on a single bar, both alerts fired zero times, and the branch that paints the ribbon was unreachable code. That is a calibration error, not a conservative setting, and it is fixed here: the default is now 30, where the coloured state covers 137 of 5,949 bars on BTCUSDT and 173 of 5,949 on ETHUSDT - roughly one bar in forty.
Second: the whole scale is far smaller than the script's own furniture suggested. The consensus never leaves ±0.141 and the dispersion never exceeds 0.132, while the sensor clips at ±3 and the pane drew guide lines at ±1.5. The clip has never once bound. The guides are now at ±0.10, just above the 99th percentile of |consensus| (0.114 on BTCUSDT, 0.116 on ETHUSDT), so they mark something the series actually reaches.
Neither of those is a claim about returns. There is none here: no forward-return figure, no hit rate, no edge. What the indicator offers is a picture of whether four OBV slopes are pointing the same way and how tightly, and the honest reading of the numbers above is that the picture is a low-amplitude one.
HOW THE NUMBERS WERE CHECKED
The whole computation was reimplemented outside Pine and cross-checked against this chart's Data Window: eight quantities on ten bars, with the individual sensors switched on so nothing was left as na. All 80 values round-trip to the exact three decimals TradingView printed. The worst raw disagreement is 4.9e-4, which is the rounding floor of indicator(precision = 3) rather than a modelling error.
That check discriminates. Near-miss variants a careless port would land on fail loudly against the same 80 values: reading the higher timeframes in developing rather than confirmed mode misses 79 of 80, a slope length of 21 instead of 20 misses 73 of 80, and a flipped regression orientation is off by two orders of magnitude more than the tolerance.
SETTINGS
The HTF data mode is the one that changes the meaning rather than the tuning. Confirmed only reads the last closed bar of each requested timeframe, which is why the higher-timeframe sensors are step functions that hold their value across the chart bars inside one higher-timeframe bar. Developing HTF reacts earlier and changes until that bar closes.
The four attention weights are normalized onto a simplex, so only their ratios matter, and an all-zero entry falls back to 0.10 / 0.20 / 0.40 / 0.30.
WHAT CHANGED IN THIS VERSION
The threshold and the guide lines were recalibrated against the measured output range, as described above. The audit table that the settings already promised did not exist in the code - the helper functions for it were written and left unused - and it is now implemented. An MPL header and a leftover compile sentinel plot were added and removed respectively. No computation was changed: every plotted series is identical to the version the 80-value cross-check was run against, which is why the figures above still apply.
Open source under MPL 2.0. Nothing here is a forecast, a signal service, or a claim of profitability. Indicator

Volume DNA [StrixEDGE]📊 WHAT IT DOES
StrixEDGE Volume DNA produces a single score from 0-100 that reveals whether the current price movement has genuine volume support. It synthesizes four independent volume metrics — OBV slope, Chaikin Money Flow, Relative Volume, and Volume-Price Alignment — into one easy-to-read composite. Think of it as a health check for any price move.
🔬 WHY IT'S DIFFERENT
Individual volume indicators each tell part of the story. OBV shows cumulative flow. CMF shows bounded pressure. RVOL shows participation levels. None alone gives the full picture. Volume DNA combines all four with equal weighting into a normalized 0-100 score — something no existing public indicator does. The optional breakdown mode lets you see exactly which component is driving the overall score.
⚙️ HOW IT WORKS
Four components, each scored 0-25 points:
• OBV Slope (0-25): Linear regression slope of On-Balance Volume, normalized by ATR. Rising OBV = accumulation = high score.
• CMF Score (0-25): Chaikin Money Flow mapped to 0-25 range. Positive CMF = buying pressure.
• RVOL Score (0-25): Current volume vs 20-period average. Above-average volume = higher conviction.
• Volume-Price Alignment (0-25): Are price and volume moving together? Rising price + rising volume = healthy. Rising price + falling volume = dangerous divergence.
The composite is smoothed with a 3-period EMA to reduce noise.
📈 HOW TO USE
• Score 80-100 (GREEN): Price move is well-supported — hold positions, trail stops
• Score 60-80: Adequate support — normal trading
• Score 40-60 (YELLOW): Mixed signals — reduce position size, tighten stops
• Score 20-40 (ORANGE): Weak support — avoid new entries in move direction
• Score 0-20 (RED): Critical — the move is unsupported and likely to reverse
• Enable "Show Breakdown" to identify which specific component is weak
🎛️ INPUTS & DEFAULTS
OBV Regression: 14 | CMF Period: 20 | RVOL Baseline: 20
Price Alignment LB: 5 | Smoothing: 3 | Breakdown: OFF
═══════════════════════════════════════════════════════
🔧 CUSTOMIZATION
All parameters are fully adjustable through the indicator settings panel. Inputs are grouped logically:
• ⚙️ Core Parameters — main calculation settings
• 📊 Table Settings — table size (Tiny to Huge), position (4 corners), visibility toggle
• 🎨 Visual Settings — colors, show/hide elements
• 🔔 Alert Settings — threshold values for notifications
📊 DATA TABLE
A built-in data table displays all key metrics in real-time. Adjust the table size from Tiny to Huge to match your chart layout. Position it in any corner. Toggle visibility on/off.
🔔 ALERTS
Pre-built alert conditions for all major signals. Set up alerts via TradingView's alert dialog — select this indicator and choose from the available conditions.
⏱️ RECOMMENDED TIMEFRAMES
Works on all timeframes. Recommended: 1H, 4H, Daily for best signal quality. Lower timeframes produce more signals but with higher noise. Weekly/Monthly for position trading context.
✅ COMPLIANCE
• No repainting — all signals based on confirmed bar close data
• No future data references
• Open-source code — verify the logic yourself
⚠️ DISCLAIMER
This indicator is a technical analysis tool, not financial advice. It does not predict future price movements. Past patterns and signals do not guarantee future results. Trading involves substantial risk of loss. Always use proper risk management, including stop losses and appropriate position sizing. Never risk more than you can afford to lose. Indicator

OBV Price Confirmation Chronology - On Balance VolumeOBV Price Confirmation Chronology is a price-volume research indicator that compares the timing of rolling record events in price and classical On-Balance Volume (OBV).
A standard OBV line shows how directionally signed volume has accumulated. This script adds a different analytical layer: when price and OBV establish corresponding upper or lower records, which one occurred first, did both occur on the same bar, or did one remain unmatched beyond the selected tolerance?
The purpose is to help users study whether the available volume series is confirming, leading, lagging, or failing to match new price records.
This is a descriptive context tool. It is not a trading system and does not generate buy or sell instructions, entries, exits, targets, stops, position sizes, probability estimates, or performance claims.
CORE IDEA
The script separately observes two event families:
- High-side records
- Low-side records
A high-side event occurs when price or classical OBV establishes a new upper record relative to its selected rolling lookback.
A low-side event occurs when price or classical OBV establishes a new lower record relative to its selected rolling lookback.
Price and OBV events are then paired within a configurable number of chart bars.
The resulting chronology state describes the order in which the matching records occurred:
- OBV led
- Price led
- Synchronized
- Price only
- OBV only
High-side and low-side states are calculated independently.
"High" and "Low" describe the direction of the rolling record. They are not long or short recommendations.
WHAT MAKES IT DIFFERENT
The classical OBV calculation itself is a standard technical-analysis foundation. The original contribution of this script is the chronology engine built around it.
The script does not simply plot OBV, detect an OBV moving-average crossover, or mark a one-sided OBV breakout.
Its distinguishing features include:
- Symmetrical high-side and low-side record analysis
- Independent price-record and OBV-record detection
- Bar-by-bar measurement of which record occurred first
- Synchronized-event classification when both records occur together
- Pending-event storage within a configurable pairing tolerance
- Unpaired-event classification when the tolerance expires
- Deterministic oldest-first event pairing
- Breakout-sequence compression to reduce repeated record events
- Optional sampled-record mode for more frequent research events
- A normalized OBV-versus-price range-position gap
- Compact historical markers
- Separate latest high-side and low-side labels
- A concise current-state table
- Confirmed-bar event handling by default
This is not a classic pivot-divergence indicator.
It does not wait for confirmed swing pivots, draw divergence lines between historical pivots, or classify regular and hidden divergence. It instead studies the chronology of rolling price and OBV records.
CLASSICAL OBV CALCULATION
Classical OBV is calculated from the selected Direction source.
When the source rises from the previous bar:
- The current available volume is added.
When the source falls from the previous bar:
- The current available volume is subtracted.
When the source is unchanged:
- Zero is added.
Close is the default Direction source.
The chronology engine always uses classical cumulative OBV, regardless of the selected visual display mode.
PRICE RECORDS
The Price record source can use:
- High / Low
- Close
With High / Low selected:
- High-side records are calculated from price highs.
- Low-side records are calculated from price lows.
With Close selected:
- Both upper and lower price records are calculated from closing prices.
A price record must exceed the previous rolling record by the configured Minimum price record extension.
The default extension is one minimum tick. This helps avoid treating insignificant floating-point or feed-level differences as meaningful new price records.
Setting the extension to zero accepts any strictly higher or lower value.
OBV RECORDS
A high-side OBV record occurs when classical OBV exceeds its previous rolling maximum.
A low-side OBV record occurs when classical OBV falls below its previous rolling minimum.
A usable positive volume input is required for a new OBV record event.
EVENT SAMPLING MODES
Breakout sequence start is the default event mode.
This mode groups a sustained run of repeated rolling records into a cleaner event sequence. A new event is allowed only after the selected number of reset bars has separated it from the preceding record run.
This reduces repeated markers during a continuous expansion.
Sampled rolling records is an alternative research mode.
It allows record events to appear more frequently, subject to the selected minimum number of bars between sampled events.
PAIRING LOGIC
High-side and low-side events maintain separate pending states.
When a price record occurs without a matching OBV record, the price event waits for the configured Pair tolerance bars.
When an OBV record occurs without a matching price record, the OBV event waits in the same way.
If the opposite record occurs within the tolerance, the events form a completed pair.
The script gives priority to the oldest valid unmatched event. A new event from the same source does not overwrite an older valid pending event.
The classifications are:
OBV led
The OBV record occurred first and the matching price record occurred later within the tolerance.
Price led
The price record occurred first and the matching OBV record occurred later within the tolerance.
Synchronized
The price and OBV records occurred on the same chart bar when no older opposite-source pending event had priority.
Price only
A price record remained unmatched after the tolerance expired.
OBV only
An OBV record remained unmatched after the tolerance expired.
The tolerance is measured in chart bars, not clock time.
A setting of eight therefore means eight bars on the active chart timeframe.
READING THE +N VALUE
A compact label such as:
OBV +3
means that the matching OBV record occurred three chart bars before the price record.
A compact label such as:
Price +2
means that the matching price record occurred two chart bars before the OBV record.
The number is not:
- Signal strength
- Price distance
- Volume percentage
- Expected return
- Reversal probability
- Continuation probability
It is only the number of chart bars separating the two record events.
VISUAL LANGUAGE
The default visual structure keeps the OBV series as the primary layer.
Default line colors:
- Cyan: displayed OBV series
- Yellow: selected smoothing line
Historical event markers:
- Diamond: completed price-OBV pair
- X: pending event expired without a matching event
Default marker colors:
- Blue: OBV led
- Gold: Price led
- White: Synchronized
- Gold X: Price only
- Violet X: OBV only
Marker position identifies the event side:
- Markers above the displayed OBV line represent high-side events.
- Markers below the displayed OBV line represent low-side events.
The latest high-side state is shown with a green label.
The latest low-side state is shown with a pink label.
Only one latest high-side label and one latest low-side label are maintained. Older event history remains available through the smaller markers.
All primary colors, line widths, label sizes, table settings, and visual layers can be customized.
STATUS TABLE
The default Compact table contains four rows:
High
Shows the latest completed or expired high-side chronology state.
Low
Shows the latest completed or expired low-side chronology state.
Pending
Shows whether a price or OBV record is currently waiting for a matching event.
A pending value such as:
H Price 3/8
means that a high-side price record has waited three bars out of an eight-bar tolerance.
Gap
Shows which series currently occupies the stronger relative position inside its own recent range.
The table can be moved to any corner of the indicator pane.
A Detailed table mode is also available for users who want additional state and environment information.
RANGE-POSITION GAP
Price and classical OBV are independently normalized to positions from 0 to 100 inside their respective recent ranges.
The calculation is:
OBV range position - Price range position
A positive result means OBV is positioned higher inside its own recent range than price is positioned inside its price range.
A negative result means price is positioned higher inside its own recent range than OBV is positioned inside its OBV range.
In Compact mode, the table displays the stronger side and the absolute difference.
For example:
OBV 22.5
means OBV is 22.5 normalized range-position points above price.
Price 31.0
means price is 31.0 normalized range-position points above OBV.
The Gap value is not a price percentage, volume percentage, probability, forecast, or signal-strength score.
An optional subtle background tint can highlight larger positive or negative gaps. It is disabled by default to preserve visual clarity.
DISPLAY MODES
Classic OBV
Displays classical cumulative OBV.
This is the default mode because it matches the series used by the chronology engine.
Rolling zero-base OBV
Displays the current classical OBV value minus its value a selected number of bars ago.
This can make recent movement easier to compare visually, but it does not change chronology calculations.
Directional balance %
Measures net directionally signed volume relative to gross directionally signed volume over the selected lookback and displays the result on a scale from -100 to +100.
This mode changes only the visible pane series.
Chronology events always remain based on classical cumulative OBV.
SMOOTHING
An optional smoothing line is enabled by default.
Available methods:
- EMA
- SMA
- RMA
- WMA
The smoothing line is a visual reference only. It does not change price-record detection, OBV-record detection, pairing, pending events, expiration, or alert conditions.
ALERTS
The script provides separate alert conditions for:
- High-side OBV led
- High-side Price led
- High-side Synchronized
- Low-side OBV led
- Low-side Price led
- Low-side Synchronized
- Unpaired chronology expiration
The unpaired alert is disabled by default.
All alerts are restricted to confirmed bar closes.
Alert events describe completed chronology conditions only. They are not trade instructions.
LIVE AND HISTORICAL BEHAVIOR
Evaluate confirmed bars only is enabled by default.
With this setting enabled:
- Persistent chronology states update only when the current chart bar closes.
- Pending records do not pair or expire during an unfinished bar.
- Historical and realtime event handling remain aligned around confirmed chart bars.
The displayed OBV line, smoothing line, and range-position gap can still update while the current bar is forming because their underlying price and volume values are live.
If confirmed-bar evaluation is disabled, chronology events become a provisional intrabar preview. Those states can change before the bar closes.
Alerts remain confirmed-bar events even when intrabar preview is enabled.
The script uses the current chart timeframe only.
It does not request higher-timeframe or lower-timeframe data, does not use lookahead, and does not use future bars.
An unpaired X marker appears on the bar where the expiration becomes knowable, not retrospectively on the original pending-event bar.
NON-STANDARD CHARTS
Chronology-event processing is paused by default on non-standard chart types, including synthetic price constructions such as:
- Heikin Ashi
- Renko
- Kagi
- Point & Figure
- Range
- Line Break
Standard candlestick or bar charts are recommended.
INPUTS AND CUSTOMIZATION
Users can adjust:
- OBV Direction source
- Visible display mode
- Rolling zero-base length
- Directional-balance length
- Smoothing method and length
- Price record source
- Record lookback
- Record event mode
- Sequence reset bars
- Sampled-event spacing
- Pair tolerance
- Minimum price-record extension
- Confirmed-bar behavior
- Non-standard-chart behavior
- Historical markers
- Latest labels
- Label style and size
- Table position
- Compact or Detailed table density
- Table text size and formatting
- OBV and smoothing line widths
- Range-position lookback
- Gap threshold and optional tint
- Primary colors
- Alert availability
Visual settings do not change the underlying chronology calculations.
SUGGESTED WORKFLOW
1. Use a standard candlestick chart with a consistent and meaningful volume series.
2. Begin with Classic OBV so the displayed series matches the chronology basis.
3. Review the High and Low rows separately. They represent different record directions and can show different chronology states at the same time.
4. Use the historical diamonds to locate completed price-OBV pairs.
5. Use the historical X markers to locate events that expired without confirmation.
6. Read the +N value only as a bar-count lead or lag.
7. Review Pending to see whether a price or OBV record is still waiting for a counterpart.
8. Use Gap as secondary range-position context, not as a trade trigger.
9. Adjust Record lookback, Sequence reset bars, and Pair tolerance for the timeframe and research horizon.
10. Combine the observations with independent price structure, trend, volatility, liquidity, and risk analysis.
LIMITATIONS
OBV is derived from the volume series supplied for the selected symbol and data provider.
Depending on the market, the available series may represent:
- Exchange trade volume
- Exchange-specific crypto volume
- Broker-specific volume
- Tick volume
- Limited volume
- No usable volume
The interpretation and quality of all OBV-based calculations therefore depend on the symbol and feed.
If no usable volume is available, the OBV series may remain flat or the chronology may not provide meaningful events.
The absolute numerical level of cumulative OBV is not directly comparable between unrelated symbols.
Large isolated volume events can affect the cumulative OBV path for an extended period.
Corporate actions, session changes, market gaps, futures contract rolls, and provider-specific data changes can affect price and volume records.
Record events depend on the selected lookback and price source.
Pairing results depend on the selected tolerance.
Lower timeframes can produce more frequent and noisier events.
Higher timeframes generally produce fewer events and require more elapsed time for pending states to complete or expire.
Price-only and OBV-only states do not predict reversal or continuation.
OBV leadership does not guarantee that price will follow.
Price leadership does not guarantee that OBV will confirm.
Synchronized records do not guarantee trend persistence.
Range-position Gap does not represent a trading edge or future probability.
Default parameters are research starting points and are not optimized for any symbol, timeframe, market, or trading method.
This indicator should be used as one descriptive price-volume perspective within a broader analytical process. Indicator

OBV Signal Confluence [MarkitTick]💡 This advanced technical utility provides a comprehensive evaluation of market momentum by synthesizing cumulative volume flow with structural trend dynamics and dynamic support levels. Designed for rigorous market analysis, it evaluates directional shifts by demanding strict confluence across multiple dimensions, including momentum divergence, historical trend validation, and volatility expansion. Rather than relying on isolated price action, this tool builds a holistic profile of market participation, delivering a complete framework for structured trade management and robust signal verification.
● ✨ Originality and Utility
Most traditional momentum oscillators evaluate price velocity in a vacuum, completely ignoring the underlying participation required to sustain a trend. This utility stands apart by merging volume-weighted momentum with strict filtering mechanisms to evaluate the true strength of a market move. By integrating a multi-tiered filtration system, it effectively isolates high-probability directional shifts while filtering out low-participation market noise.
The utility is entirely self-contained, projecting dynamic trade management levels directly onto the chart when momentum alignment is confirmed. It seamlessly bridges the gap between raw data analysis and actionable trade management. By establishing precise entry, invalidation, and multiple target zones based on current market volatility, it transforms raw volume data into a structured operational blueprint.
Furthermore, the inclusion of a comprehensive heads-up display ensures that all underlying metrics—from momentum strength to historical trend states—are continuously aggregated and visually accessible, allowing for rapid contextual assessment without cluttering the primary analytical workspace.
● 🔬 Methodology and Concepts
This tool operates on a sophisticated, multi-layered evaluative engine. To protect the integrity of the underlying architecture, the methodology is described conceptually:
Cumulative Volume Flow: The primary engine evaluates the continuous flow of market volume, categorizing buying and selling pressure based on specific price action thresholds. This cumulative data is then smoothed against a dynamic, user-selectable baseline to establish the core momentum trajectory.
Higher Timeframe Confluence: To prevent acting on insignificant intraday fluctuations, the engine references the structural momentum of a higher timeframe. Signals are strictly gated unless the localized momentum aligns with this broader, macro-level directional bias.
Momentum Divergence Detection: The utility continuously scans for structural discrepancies between price pivot extremes and the corresponding extremes in the volume flow. When price establishes new structural boundaries without validating volume participation, the system flags these areas as potential exhaustion or reversal zones.
Volatility and Participation Filters: Trend strength and volume ratios are continuously measured against established historical averages. The engine requires both a minimum threshold of directional strength and a surge in relative volume participation to validate any momentum shift, ensuring that structural breaks are supported by actual market activity.
Dynamic Risk Profiling: Upon signal confirmation, the tool automatically calculates an invalidation level utilizing a multiplier of the underlying asset's average true volatility. Profit targets are then extrapolated from this established risk parameter, ensuring that every projected setup adheres to strict, predefined risk-to-reward ratios.
● 🎨 Visual Guide
The visual interface is designed to provide immediate contextual awareness while maintaining a clean charting environment:
Momentum Histogram: Plotted as columns, this visualizes the delta between the cumulative volume flow and its dynamic baseline. Color intensity shifts dynamically to reflect both the direction and the immediate acceleration or deceleration of the momentum.
Heat Candles: When enabled, this feature overrides the native chart candles, painting the price action to match the underlying volume momentum state, allowing for rapid visual confirmation of the current trend environment.
Divergence Markers: Distinct upward and downward triangular shapes are plotted directly on the chart to indicate areas where structural price action has diverged from the supporting volume flow.
Trade Management Levels: Upon a confirmed momentum shift, dashed horizontal lines appear to project the Entry, Stop Loss (SL), and three tiered Take Profit (TP) zones.
Risk/Reward Shading: Shaded background zones visually map the risk parameters, contrasting the invalidation zone against the projected reward territory to provide an immediate assessment of the trade's structural viability.
Heads-Up Dashboard: A customizable table anchored to the chart corner. It provides a real-time aggregate readout of all critical internal metrics, including current trend state, raw momentum values, divergence status, participation ratios, and active trade progression percentages.
● 📖 How to Use
Establish Context: Monitor the Heads-Up Dashboard to evaluate the current macro trend state and participation ratios. Wait for the dashboard to indicate alignment between directional momentum, volume participation, and trend strength.
Identify Confluence: Look for structural momentum shifts indicated by the histogram crossing its zero-line, strictly validated by the alignment of the Heat Candles. Divergence markers appearing prior to these shifts serve as early warning signs of an impending structural rotation.
Signal Confirmation: Wait for the current bar to close. The utility is engineered to execute calculations on confirmed data to ensure structural stability. A confirmed signal will instantly plot the dynamic trade management levels.
Execute and Manage: Utilize the projected Entry, Stop Loss, and Take Profit levels to structure your position. The Risk/Reward shading and the progress tracker on the dashboard will provide continuous feedback as the price action develops toward the established targets.
Alert Integration: For automated tracking, configure the built-in alert conditions which generate structured data payloads for long entries, short entries, position closures, and individual target strikes.
● ⚙️ Inputs and Settings
Core: Define the source data for momentum calculations and select the preferred baseline calculation method and lookback length. This also includes the pivot length for divergence detection.
Filters: Activate and calibrate the higher timeframe alignment constraints. Set the specific lengths and minimum thresholds for directional strength and volume participation multipliers to strictly define what constitutes a valid breakout.
Trade: Toggle the visibility of the dynamic management levels. Adjust the volatility lookback, the invalidation multiplier, and customize the exact risk-to-reward ratios for all three projected profit targets.
Vis: Control the visual clutter by toggling the histogram, zero line, divergence signals, and heat candles on or off according to personal preference.
Dash: Enable or disable the Heads-Up Dashboard and anchor it to any of the four chart corners for optimal workspace organization.
Alerts: Define custom action strings and dynamic payload identifiers to integrate seamlessly with external execution engines or tracking software.
Colors: Fully customize the aesthetic profile of the indicator. Modify the specific hex values and opacities for the histogram states, trade levels, risk shading, divergence markers, and the internal dashboard elements to match your charting theme.
● 🔍 Deconstruction of the Underlying Scientific and Academic Framework
The foundation of this utility is deeply rooted in the principles of Auction Market Theory and the Law of Effort versus Result. In any financial market, price discovery is driven by the continuous auction process between buyers and sellers. However, price alone is a one-dimensional metric. Volume represents the actual energy or "effort" expended to move that price. By systematically analyzing the relationship between price displacement and volume flow, this tool effectively maps the true liquidity absorption within the market.
When a market establishes a new structural price extreme, fundamental market mechanics dictate that this move must be supported by an equivalent expansion in volume participation. If the aggregate volume flow begins to decelerate while price continues to advance, a structural divergence is formed. This indicates a severe lack of liquidity supporting the current auction, highlighting an area where the prevailing trend is highly vulnerable to mean reversion or a complete structural failure.
Furthermore, the integration of volatility-based risk profiling adheres to established quantitative risk management principles. Market volatility is not static; it constantly expands and contracts in cyclical phases. By anchoring invalidation levels to a dynamic multiplier of average true volatility, the utility ensures that risk parameters adapt to the current market environment. This prevents premature invalidation during periods of high liquidity expansion while maintaining tight structural constraints during periods of market consolidation.
⚠️ Disclaimer
All provided scripts and indicators are strictly for educational exploration and must not be interpreted as financial advice or a recommendation to execute trades. We expressly disclaim all liability for any financial losses or damages that may result, directly or indirectly, from the reliance on or application of these tools. Market participation carries inherent risk where past performance never guarantees future returns, leaving all investment decisions and due diligence solely at your own discretion. Indicator

Multi-Oscillator Divergence Scanner [Quantum Algo]Multi-Oscillator Divergence Scanner
====================================================
🔶 OVERVIEW
Multi-Oscillator Divergence Scanner is a confluence-based divergence indicator that scans up to seven classic oscillators simultaneously — Relative Strength Index, Moving Average Convergence Divergence, Stochastic Oscillator, Commodity Channel Index, On Balance Volume, Money Flow Index, and Momentum — and displays the result on two synchronized canvases at once. Divergence lines, graded labels, and reaction zones are drawn directly on the price chart, while a dedicated pane below plots a Composite Oscillator built from every enabled engine, with the same divergence lines mirrored onto the composite itself. You see both slopes of every divergence — price disagreeing with momentum — in one glance.
The problem this script solves is selective divergence trading. Any single oscillator produces frequent divergences, and most of them fail. Requiring multiple mathematically independent engines — momentum-based, volume-based, and volatility-normalized — to diverge at the same confirmed swing filters the noise down to setups where disagreement between price and participation is broad, not incidental.
🔶 WHAT IS A DIVERGENCE?
A divergence occurs when price prints a new extreme but an oscillator refuses to confirm it. A regular bullish divergence forms when price makes a lower low while the oscillator makes a higher low — a classic reversal condition. A regular bearish divergence forms when price makes a higher high while the oscillator makes a lower high. Hidden divergences are the continuation counterparts: price makes a higher low while the oscillator makes a lower low (hidden bullish), or price makes a lower high while the oscillator makes a higher high (hidden bearish). This scanner detects all four types on confirmed swing pivots.
🔶 WHAT IS THE COMPOSITE OSCILLATOR?
The Composite Oscillator is the consensus reading of every engine you enable. Bounded oscillators (Relative Strength Index, Stochastic, Money Flow Index) contribute their native zero-to-one-hundred values; unbounded engines (Moving Average Convergence Divergence histogram, On Balance Volume, Momentum) are range-normalized over a configurable lookback; the Commodity Channel Index is rescaled onto the same axis. The average of all enabled engines plots as a single gradient line with overbought and oversold guides, a midline fill, and divergence lines drawn directly on it — so the pane shows aggregate momentum from the same engines that vote on every signal, not a separate calculation.
🔶 WHY THIS SCRIPT IS ORIGINAL
1. True multi-engine confluence. Divergences are not detected on one oscillator and decorated with others. All seven engines are evaluated independently at every confirmed pivot, and a signal only exists when the minimum confluence count you set is reached.
2. Dual-canvas mirroring. Every qualified divergence is drawn twice: on price, and on the Composite Oscillator in the pane, connected at the same two pivots. Both slopes of the disagreement are visible simultaneously — the visual proof that defines a divergence.
3. Consensus composite pane. The pane line is not one more oscillator; it is the averaged, normalized voice of the exact engines doing the scanning, colored by a gradient between the oversold and overbought guides.
4. Full transparency on every label. Each signal prints its strength as a diamond meter and lists the exact oscillators that diverged (for example: RSI · OBV · MFI). You always know why a signal exists — nothing is a black box.
5. Strength-scaled visuals. Divergence lines thicken with confluence on both canvases, and signals reaching the Strong threshold upgrade to the accent color, so chart hierarchy communicates quality instantly.
6. Reaction zones with a life cycle. Every regular divergence projects a volatility-sized zone around its pivot (measured in Average True Range). Zones gray out automatically the moment price invalidates them, so the chart always distinguishes live zones from dead ones.
7. Divergence pressure gauge. A decaying pressure model accumulates bullish and bearish divergence weight over time, giving a one-glance read on which side has been stacking disagreement with price.
🔶 HOW IT WORKS
Pivot scanning: Swing highs and swing lows are confirmed with a symmetric pivot lookback. All divergence checks are evaluated on closed bars at pivot confirmation, so historical signals do not repaint. Confirmation lag equals the right-side pivot length by design.
Confluence evaluation: At each confirmed pivot, every enabled oscillator's value at that pivot is compared against its value at the previous same-side pivot. The four divergence types are tested independently per oscillator, and contributions are counted.
Signal grading: Signals meeting the Minimum Oscillator Confluence print with strength diamonds (one per contributing oscillator). Signals reaching the Strong Signal Threshold upgrade to the accent color and thicker geometry on both the price chart and the composite pane.
Composite rendering: The pane plots the consensus line with a gradient fill to the midline, dashed overbought and oversold guides, tinted extreme bands, triangle marks at divergence bars, and the mirrored divergence lines.
Reaction zones: Each regular divergence projects a box around its pivot sized by Average True Range, extended a configurable number of bars. A bullish zone grays out when price closes below it; a bearish zone grays out when price closes above it.
Dashboard: A fully themeable panel on the price chart shows the last signal, a live divergence pressure meter, and one row per engine with its live value — color-coded for overbought, oversold, or directional state — plus each engine's most recent divergence side. Text size (four steps), position, and every color (title band, background, frame, grid, header, body, muted) are adjustable.
Chart hygiene: The number of divergences kept is capped by input, on both canvases. Older lines, labels, and zones are deleted automatically, keeping the chart readable and the auto-scale anchored to current price.
🔶 HOW TO USE IT
1. Works on any market — cryptocurrency, forex, gold, indices, stocks, futures — and any timeframe. Higher timeframes produce fewer, larger-structure signals.
2. Start with Minimum Oscillator Confluence at 2 and the Strong threshold at 4. Raise the minimum to 3 for a strict, low-frequency reversal tool; lower it to 1 to study single-oscillator behavior.
3. Read the pane and the chart together: a valid signal shows price sloping one way and the composite sloping the other, connected at the same pivots.
4. Regular divergences are reversal-oriented: treat them as exhaustion evidence at swing extremes, strongest when the composite is also inside an overbought or oversold band.
5. Hidden divergences are continuation-oriented: treat them as trend re-entry evidence during pullbacks, and do not read them like reversal signals.
6. Use the reaction zone as the decision area: a live zone holding on retest supports the signal; a grayed zone means the divergence failed.
7. The pressure meter is context, not a trigger — persistent one-sided pressure alongside fresh strong signals is the highest-quality condition.
🔶 SETTINGS
- Pivot Left / Right Length — swing size; larger values scan bigger structures.
- Independent toggles and lengths for all seven oscillator engines.
- Composite pane: normalization lookback, overbought and oversold levels, pane marks, and mirrored divergence lines toggle.
- Regular and hidden divergence toggles, minimum confluence, strong threshold.
- Reaction zone height (Average True Range ratio) and extension.
- Divergences To Keep — caps historical drawings on both canvases for chart cleanliness and stable auto-scale.
- Dashboard with adjustable text size, position, live oscillator values, and full color theming.
- Full color customization for all chart drawings and pivot markers.
🔶 ALERTS
- Bullish Divergence / Bearish Divergence — a regular divergence met the confluence minimum.
- Hidden Bullish Divergence / Hidden Bearish Divergence — a continuation divergence met the minimum.
- Strong Divergence — a regular divergence reached the strong threshold.
🔶 FREQUENTLY ASKED QUESTIONS
Does the indicator repaint? No. Divergences are evaluated only on confirmed pivots at bar close. The trade-off is intentional confirmation lag equal to the right-side pivot length.
Why does a pane divergence line sometimes start slightly off the composite's visual peak? Divergence is measured at price structure points. The line connects the composite's values at the two confirmed price pivots, which is the correct comparison even when the composite made its own extreme a bar or two away.
Why do some obvious divergences not print? Either the confluence minimum was not reached, the oscillator involved is disabled, or the swing did not confirm as a pivot under the current lengths.
Which oscillators should I enable? The default set mixes momentum and volume perspectives, which is the point of confluence: independent evidence, not seven copies of the same math.
Is a Strong signal a guaranteed reversal? No. Strength counts agreement between engines; it is a transparency measure, not a probability of profit.
🔶 CREDITS
This script builds its scanning and composite engine on classic, public-domain oscillators, and gratefully credits their creators: the Relative Strength Index by J. Welles Wilder Jr. (1978), Moving Average Convergence Divergence by Gerald Appel, the Stochastic Oscillator popularized by George C. Lane, the Commodity Channel Index by Donald Lambert (1980), On Balance Volume by Joseph Granville (1963), and the Money Flow Index by Gene Quong and Avrum Soudack. All oscillator calculations use standard built-in formulas. Drawing divergence lines on an oscillator is a long-established charting convention popularized by many community authors, acknowledged here as shared prior art. The multi-engine confluence scanner, the consensus Composite Oscillator, the dual-canvas mirroring, transparency labeling, strength grading, reaction zone life cycle, pressure model, and all code in this script are original work — no third-party or open-source script code was reused.
🔶 LIMITATIONS
Divergence can persist or fail entirely during strong trends; regular divergences against a powerful trend are the weakest application. Volume-based engines (On Balance Volume, Money Flow Index) are less meaningful on symbols with unreliable volume reporting. The composite's normalized components depend on the normalization lookback. Pivot confirmation introduces intentional delay. No indicator replaces independent analysis.
🔶 DISCLAIMER
This script is provided strictly for educational and informational purposes. It is not financial advice, an investment recommendation, or a solicitation to buy or sell any financial instrument. Past behavior of any signal does not guarantee future results. Trading involves substantial risk. Always do your own research and manage risk independently.
Indicator

EMA + Supertrend + OBV [StrixEDGE]Trend Engine EMA + Supertrend + OBV is a multi-timeframe trend scoring system that combines EMA structure, Supertrend direction, and OBV volume flow into a single overlay with a detailed heatmap dashboard. It evaluates four timeframes simultaneously and presents the results in a color-coded, section-organized table directly on the chart.
The indicator answers three questions per timeframe: Is the structure bullish or bearish? Is the directional signal confirmed? Is volume supporting the move? It then aggregates these into a confluence score and cross-timeframe alignment reading.
Components
EMA Stack (21 / 50 / 200)
Three exponential moving averages forming a structural hierarchy. The scoring logic evaluates both the EMA order and price position:
| Condition | Score | Label |
|---|---|---|
| 21 > 50 > 200, price above all | +2 | FULL BULL ▲▲ |
| 21 > 50 > 200 | +1 | BULLISH ▲ |
| Price above 200 but EMAs not ordered | +1 | BULLISH ▲ |
| No clear alignment | 0 | MIXED ◆ |
| Price below 200 but EMAs not ordered | −1 | BEARISH ▼ |
| 21 < 50 < 200 | −1 | BEARISH ▼ |
| 21 < 50 < 200, price below all | −2 | FULL BEAR ▼▼ |
The 200 EMA is separately tracked as "Price/200" in the heatmap, since institutional participants widely use this level as the dividing line between bull and bear regimes.
On the chart, all three EMAs turn green when bull-stacked and red when bear-stacked. A ribbon fill between the fast and mid EMA visualizes alignment strength. Golden Cross (50 above 200) and Death Cross events are marked with "GC" and "DC" labels.
Supertrend (10, 3)
An ATR-based trailing stop that produces a binary directional signal. When the Supertrend line is below price, it scores +1 (BULLISH). When above, it scores −1 (BEARISH). The line also serves as a dynamic stop-loss level. Triangle markers appear at each flip point.
OBV with 20-period SMA
On Balance Volume is calculated cumulatively — adding volume on up-closes, subtracting on down-closes. The heatmap evaluates two dimensions independently: OBV position relative to its SMA (above or below) and the SMA slope direction (rising, falling, or flat). This produces six distinct flow states:
| OBV vs MA | Slope | Label | Meaning |
|---|---|---|---|
| Above | Rising | ACCUM ▲ | Active accumulation — institutional buying |
| Above | Flat | ABOVE MA | Holding above average — neutral positive |
| Above | Falling | WEAKENING | Position eroding despite being above MA |
| Below | Rising | BUILDING | Recovery underway — improving flow |
| Below | Flat | BELOW MA | Holding below average — neutral negative |
| Below | Falling | DISTRIB ▼ | Active distribution — institutional selling |
OBV scores +1 when above MA and rising, −1 when below MA and falling, and 0 for all intermediate states.
The MTF Heatmap
The heatmap table is organized into four color-coded sections:
STRUCTURE (blue header) — EMA Stack alignment and Price vs EMA 200 for each timeframe. Shows whether the market's structural foundation is bullish, bearish, or mixed.
DIRECTION (purple header) — Supertrend signal per timeframe. A clean binary reading of whether the trailing stop is bullish or bearish.
VOLUME FLOW (teal header) — OBV flow state per timeframe. Shows whether volume is confirming the price trend, diverging from it, or transitioning.
CONFLUENCE (gold header) — The aggregated output:
- Score: total from −4 to +4 per timeframe
- Strength: visual dot bar (● ● ● ● ○) representing signal intensity
- Regime: classification label (STRONG BULL BULLISH NEUTRAL BEARISH STRONG BEAR )
At the bottom, an MTF Alignment summary shows how many timeframes agree (e.g., "▲ 3/4 BULLISH — Strong alignment www.tradingview.com or "◆ SPLIT 2/2 — No clear bias www.tradingview.com).
Every cell uses heatmap coloring — bright green for strong bullish, through gray for neutral, to deep red for strong bearish — providing an instant visual scan of market conditions.
| Component | Max bullish | Neutral | Max bearish |
|---|---|---|---|
| EMA Stack | +2 | 0 | −2 |
| Supertrend | +1 | — | −1 |
| OBV Flow | +1 | 0 | −1 |
| **Total** | +4 | 0 | −4 |
Classification per timeframe:
- +3 to +4 → STRONG BULL
- +1 to +2 → BULLISH
- 0 → NEUTRAL
- −1 to −2 → BEARISH
- −3 to −4 → STRONG BEAR
Reading the heatmap
The heatmap's primary value is showing cross-timeframe agreement at a glance:
All columns green — Full alignment across timeframes. This is the highest-probability environment for trend-following trades.
Higher TFs green, lower TFs red — A pullback within a larger uptrend. The structural trend is intact; the short-term weakness may represent an entry opportunity.
Lower TFs green, higher TFs red — A rally within a larger downtrend. Unless the higher timeframes are shifting, this is likely a counter-trend bounce.
Mixed colors — No clear directional edge. Reduce position size or wait for alignment to develop.
Section-level reading — If STRUCTURE and DIRECTION are green but VOLUME FLOW is red, the trend lacks volume confirmation and may be fragile. If VOLUME shows ACCUM but DIRECTION is bearish, smart money may be accumulating before a reversal.
Alerts
Seven alert conditions are available:
- Strong bullish trend detected (current TF)
- Strong bearish trend detected (current TF)
- Golden Cross — EMA 50 crosses above EMA 200
- Death Cross — EMA 50 crosses below EMA 200
- Supertrend flip bullish
- Supertrend flip bearish
- Any trend classification change
Disclaimer: This indicator is a technical analysis tool for educational and informational purposes. It does not constitute financial advice or a recommendation to buy or sell any security. No trading indicator can predict future price movements. Past performance is not indicative of future results. Always conduct your own analysis and consider your risk tolerance before making trading decisions. Indicator

Divergence Hunter [Proozac]# Divergence Hunter — RSI · MACD · OBV
**Pine Script v5 — Overlay Indicator**
---
## What It Does
Scans three oscillators simultaneously — RSI, MACD, and OBV — and draws labelled lines directly on the price chart whenever a divergence is detected between price action and oscillator momentum.
Two divergence types are covered per oscillator:
- **Regular divergence** — signals a potential trend reversal
- **Hidden divergence** — signals a potential trend continuation
---
## Divergence Types Explained
### Regular Bullish Divergence
```
Price: Lower Low (LL)
Oscillator: Higher Low (HL)
Signal: Potential reversal UP
```
Price is making lower lows but the oscillator is making higher lows — sellers are losing momentum. The downtrend is weakening.
### Regular Bearish Divergence
```
Price: Higher High (HH)
Oscillator: Lower High (LH)
Signal: Potential reversal DOWN
```
Price is making higher highs but the oscillator is making lower highs — buyers are losing momentum. The uptrend is weakening.
### Hidden Bullish Divergence
```
Price: Higher Low (HL) ← trend is up
Oscillator: Lower Low (LL)
Signal: Continuation UP
```
Price holds higher lows (uptrend structure intact) while the oscillator dips lower — a temporary oscillator pullback during a healthy uptrend. A continuation signal.
### Hidden Bearish Divergence
```
Price: Lower High (LH) ← trend is down
Oscillator: Higher High (HH)
Signal: Continuation DOWN
```
Price is making lower highs (downtrend structure intact) while the oscillator makes higher highs — a temporary oscillator bounce during a healthy downtrend.
---
## The Three Oscillators
| Oscillator | What it measures | Why it diverges |
|-----------|-----------------|-----------------|
| **RSI** | Relative momentum of closes | Classic divergence tool — very reliable at extremes |
| **MACD** | Trend + momentum combined | Useful in trending markets, less noise than RSI |
| **OBV** | Cumulative volume flow | Measures whether volume confirms the price move |
Each oscillator runs through the same `detect_divs()` function. You can enable or disable each one independently. When multiple oscillators show the same divergence simultaneously, that is a high-conviction signal.
---
## Detection Logic
The indicator uses `ta.pivothigh` and `ta.pivotlow` on the **price** series to find swing points, then reads the **oscillator value at that same bar** to compare:
```
For each new pivot high in price:
Compare price level vs previous pivot high price
Compare oscillator vs previous pivot high oscillator
→ Regular Bear: price HH + osc LH
→ Hidden Bear: price LH + osc HH
For each new pivot low in price:
Compare price level vs previous pivot low price
Compare oscillator vs previous pivot low oscillator
→ Regular Bull: price LL + osc HL
→ Hidden Bull: price HL + osc LL
```
When detected, a **line** is drawn connecting the two price pivot points and a **label** marks the divergence type and oscillator name.
---
## Inputs
| Input | Default | Description |
|-------|---------|-------------|
| **RSI Divergence** | true | Enable RSI divergence scanning |
| **RSI Length** | 14 | RSI calculation period |
| **MACD Divergence** | true | Enable MACD line divergence scanning |
| **MACD Fast** | 12 | MACD fast EMA length |
| **MACD Slow** | 26 | MACD slow EMA length |
| **MACD Signal** | 9 | MACD signal line length |
| **OBV Divergence** | true | Enable OBV divergence scanning |
| **Pivot Lookback (left bars)** | 5 | Bars to the left required to confirm a swing point |
| **Pivot Lookback (right bars)** | 5 | Bars to the right required to confirm a swing point |
| **Show Hidden Divergences** | true | Toggle hidden divergence lines on/off |
| **Bullish Regular** | Bright green | Line/label color for regular bullish divergences |
| **Bearish Regular** | Bright red | Line/label color for regular bearish divergences |
| **Bullish Hidden** | Faded green | Line/label color for hidden bullish divergences |
| **Bearish Hidden** | Faded red | Line/label color for hidden bearish divergences |
---
## Visual Output
| Element | Meaning |
|---------|---------|
| Solid bright green line + label `"RSI Bull Div"` | Regular bullish divergence on RSI |
| Solid bright red line + label `"RSI Bear Div"` | Regular bearish divergence on RSI |
| Dashed faded green line + label `"RSI Hid Bull"` | Hidden bullish divergence on RSI |
| Dashed faded red line + label `"RSI Hid Bear"` | Hidden bearish divergence on RSI |
| Same patterns with `"MACD"` or `"OBV"` prefix | Divergence from that oscillator |
| Green background flash | Any bullish regular divergence firing |
| Red background flash | Any bearish regular divergence firing |
Lines connect the **two price swing points** that form the divergence, making it immediately clear which highs or lows are being compared.
---
## How to Use
**Entry logic:**
- Regular divergence → look for a reversal entry after the divergence confirms (pivot right bars have closed).
- Hidden divergence → look for a continuation entry in the direction of the main trend.
- Always wait for the pivot to fully confirm — the signal appears `pivot_rb` bars after the actual swing point.
**Confluence filter:**
A divergence is most reliable when:
1. Two or more oscillators show the same divergence simultaneously
2. Price is at a key structural level (support/resistance, Order Block, session high/low)
3. The MTF Dashboard (indicator 02 in this suite) confirms the higher timeframe trend
**Reducing noise:**
- Increase `Pivot Lookback` (left/right bars) to 8–10 for cleaner, less frequent signals
- Disable OBV if trading Forex (OBV is volume-dependent and FX volume data is tick-based)
- Disable hidden divergences if you only want reversal signals
---
## Configuration Tips
| Scenario | Recommended settings |
|----------|---------------------|
| Fast scalping (1–5m) | Pivot: 3/3, RSI only |
| Day trading (15m–1H) | Pivot: 5/5, RSI + MACD |
| Swing trading (4H–D) | Pivot: 8/8, all three oscillators |
| Crypto (high volatility) | Pivot: 7/7 to filter noise |
---
## Alerts
Two built-in `alertcondition` entries:
- `Bullish Divergence` — fires when any enabled oscillator confirms a regular bullish divergence
- `Bearish Divergence` — fires when any enabled oscillator confirms a regular bearish divergence
Set up in TradingView: Alerts → Condition → Divergence Hunter → select the desired condition.
Indicator

RSI Divergence (Bull/Bear) RSI Divergence (Bull/Bear) is an advanced momentum analysis indicator that automatically detects bullish and bearish RSI divergence between price action and the Relative Strength Index (RSI). These divergence signals can help traders identify potential market reversals, trend exhaustion, and high-probability trading opportunities across multiple financial markets.
The indicator continuously analyzes swing highs and swing lows in both price and RSI, highlighting areas where momentum no longer confirms the current price movement. These conditions often appear before significant trend reversals or corrective moves.
Features
• Automatic Bullish RSI Divergence Detection
• Automatic Bearish RSI Divergence Detection
• Swing High & Swing Low Analysis
• Visual Buy & Sell Signal Labels
• Divergence Confirmation Zones
• Optional RSI Sensitivity Settings
• Clean & Lightweight Chart Layout
• Multi-Timeframe Compatible
• Non-Repainting Divergence Detection
• Customizable Signal Display
How It Works
The indicator monitors price swings alongside RSI momentum.
When price forms a **Lower Low** while RSI forms a **Higher Low**, a **Bullish Divergence** is detected, suggesting weakening selling pressure and a possible bullish reversal.
When price forms a **Higher High** while RSI forms a **Lower High**, a **Bearish Divergence** is detected, indicating weakening buying momentum and a potential bearish reversal Signals are displayed directly on the chart, allowing traders to quickly identify possible turning points.
Signal Types
🟢 Bullish Divergence
• Price makes a Lower Low
• RSI makes a Higher Low
• Possible bullish reversal
• Momentum strengthening
🔴 Bearish Divergence
• Price makes a Higher High
• RSI makes a Lower High
• Possible bearish reversal
• Momentum weakening
Best Markets
• Forex • Gold (XAUUSD) • Silver (XAGUSD)
• Crypto • Indices • Stocks • Futures
Recommended Timeframes
Scalping • M5 • M15
Intraday • M30 • H1
Swing Trading • H4 • Daily
Indicator Highlights
• Automatic RSI Divergence Detection
• Early Reversal Identification
• Visual Buy & Sell Signals
• High-Probability Momentum Analysis
• Non-Repainting Logic
• Adjustable RSI Parameters
• Beginner Friendly
• Professional Trading Tool
• Works in Trending and Ranging Markets
Suggested Trading Workflow
1. Identify the overall market trend.
2. Wait for a Bullish or Bearish RSI Divergence signal.
3. Confirm the setup using market structure, support/resistance, or candlestick confirmation.
4. Enter the trade with proper risk management and position sizing.
Notes
This indicator is designed to assist traders in identifying potential momentum shifts through RSI divergence analysis. It should be used alongside market structure, price action, and sound risk management principles. Like all technical analysis tools, it does not predict future price movements or guarantee profitable trades. Indicator

OBV Trend CandlesOBV Trend Candles
This indicator colors your candles based on the relationship between On-Balance Volume (OBV) and a moving average of OBV. It's a simple way to keep volume-based trend context visible directly on the price chart, without having to watch a separate OBV pane.
How it works
OBV accumulates volume on up-closes and subtracts it on down-closes, so a rising OBV means volume is flowing into the asset and a falling OBV means it's flowing out. This script takes that OBV line and compares it to a simple moving average of itself:
When OBV is above its SMA, volume momentum is building → candles are painted green.
When OBV is below its SMA, volume momentum is fading → candles are painted red.
The idea is that volume often shifts before or alongside price, so the color flips can give you a read on whether the current move is backed by participation.
The Sensitivity input
The single setting that matters is Sensitivity, which is the length of the SMA applied to OBV. Lower values make the indicator react faster to changes in volume flow (more color flips, more noise), while higher values smooth things out and only flip on more established shifts. Tune it to your timeframe and trading style — there's no universally "correct" value.
Notes
It works on any timeframe and any asset, as long as that asset reports volume data. On symbols without volume (some forex pairs and certain indices), OBV can't be calculated and the script will let you know. Colors are fully customizable in the settings.
This is a context/confirmation tool, not a standalone signal — it tells you about volume flow, not where to enter or exit. Use it alongside your own analysis. Indicator

RSI Overpowered [Cartel Console]# RSI Overpowered
RSI Overpowered is a momentum and volume-pressure analysis tool designed to provide a broader view of market strength by combining multiple volume-based market internals into a single composite oscillator framework.
Instead of relying solely on traditional price-based RSI calculations, this indicator incorporates Relative Strength Index calculations derived from Positive Volume Index (PVI), Negative Volume Index (NVI), and On-Balance Volume (OBV). These components are blended into a Composite RSI that aims to highlight shifts in participation, accumulation, distribution, and momentum conditions.
The indicator includes multiple layers of analysis:
• Composite RSI built from PVI, NVI, and OBV RSI values
• Smoothed signal line for trend and momentum comparison
• Secondary RSI oscillator derived from the composite calculation
• Configurable overbought and oversold zones
• Trend filtering using Supertrend methodology
• Bullish and bearish momentum signals with trend confirmation
• Divergence detection between price and the Composite RSI
• Dynamic area fills and visual momentum shading
• Built-in alert conditions for key events
### How It Works
The script first calculates three independent volume-based indexes:
• Positive Volume Index (PVI)
• Negative Volume Index (NVI)
• On-Balance Volume (OBV)
An RSI is then calculated for each component. The average of these values forms the Composite RSI, which is subsequently smoothed to reduce noise and improve readability.
A secondary RSI oscillator is generated from the Composite RSI itself, creating an additional layer of momentum analysis that can help identify shifts in directional strength.
### Trend Confirmation
To reduce counter-trend signals, the indicator incorporates a Supertrend-based trend filter.
Bullish momentum signals are generated only when the trend filter indicates a bullish environment.
Bearish momentum signals are generated only when the trend filter indicates a bearish environment.
This approach helps align momentum events with broader directional market conditions.
### Divergence Detection
The indicator automatically searches for potential divergences between price action and the Composite RSI.
Bullish divergence may occur when price forms a lower low while the Composite RSI forms a higher low.
Bearish divergence may occur when price forms a higher high while the Composite RSI forms a lower high.
Divergence signals are visualized directly on the oscillator using pivot-based detection logic.
### Visualization Features
• Composite RSI line
• Smoothed signal line
• Dynamic momentum fills
• Overbought and oversold markers
• Trend-filtered signal circles
• Divergence labels and connecting lines
• Momentum gradient visualization
### Alerts Included
• Bullish Momentum Signal
• Bearish Momentum Signal
• Overbought Event
• Oversold Event
### Notes
This indicator is intended for market analysis and educational purposes only. Signals, divergences, trend filters, and oscillator conditions should be used alongside a complete trading plan and appropriate risk management techniques.
No indicator can guarantee future market outcomes, and all market decisions remain the responsibility of the user.
Indicator

Booker - Relative Volume SignalsBooker RVOL is a momentum breakout indicator designed to identify stocks experiencing unusual buying pressure during the regular trading session.
The indicator looks for a very specific setup often seen in high-momentum small-cap stocks:
* Trading between a user-defined price range (default: $1–$20)
* Up significantly on the day (default: +30% or greater)
* Trading with meaningful liquidity (default: 500,000+ shares)
* Relative Volume (RVOL) above a minimum threshold (default: 4x normal volume)
* Price trading above both VWAP and the 9 EMA
* A breakout above the premarket high
* A bullish “drop-and-pop” pattern, where a red candle is immediately followed by a breakout candle
When all conditions align, the indicator generates an LB RVOL signal and marks the chart.
Included Features
* Relative Volume (RVOL) calculation
* Premarket high tracking
* VWAP and 9 EMA trend confirmation
* Daily gain and volume filtering
* Customizable price range filters
* Entry markers and RVOL labels
* Alert support for automated notifications
Default Philosophy
The default settings are optimized for identifying explosive small-cap momentum stocks that are:
* Gapping higher
* Trading heavy volume
* Holding above key intraday support levels
* Breaking through important resistance levels
Rather than generating frequent signals, LB RVOL focuses on finding rare, high-conviction momentum setups where multiple bullish factors are aligned at the same time.
Signal Interpretation
A signal does not guarantee a successful trade. Instead, it highlights a stock exhibiting:
1. Exceptional relative volume
2. Strong intraday trend structure
3. A breakout above premarket resistance
4. Evidence of continued buying pressure
Many traders use these signals as a starting point for further analysis, including risk management, dilution risk assessment, chart pattern review, and broader market context.
LB RVOL was built to help traders quickly identify stocks attracting institutional and speculative attention before significant intraday moves develop. Indicator
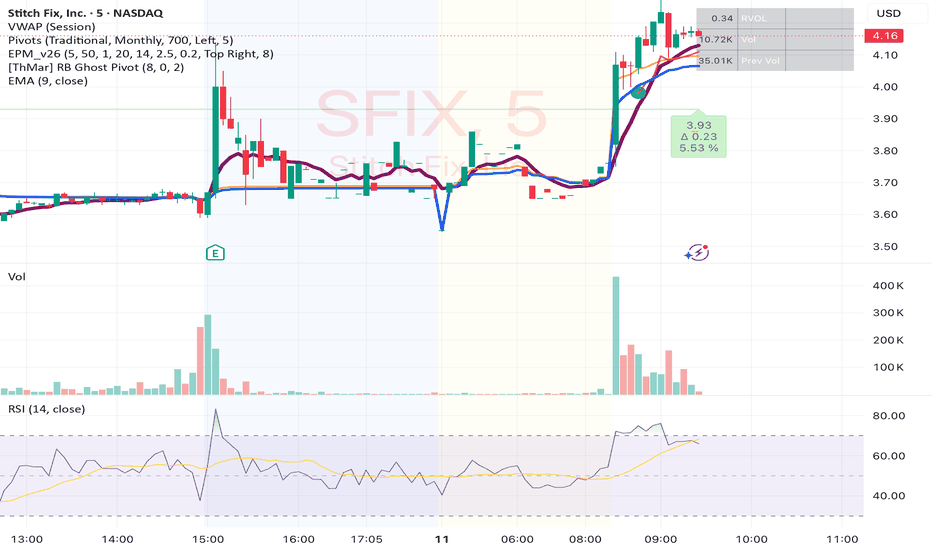
Smart Market Dashboard PRO Gap Trader EditionA comprehensive intraday dashboard designed specifically for Borsa Istanbul (BIST) equity traders. This indicator focuses on opening gap analysis, combining volume, delta, and price action to help traders make informed decisions at market open.
Key Features:
Gap Detection & Classification – Automatically identifies and labels opening gaps (Full Gap Up/Down, Partial Gap Up/Down) with configurable minimum gap % threshold
Volume & Delta Analysis – Displays real-time cumulative delta, buy/sell volume ratio, and VWAP deviation
Multi-Timeframe Data – Fetches previous day’s OHLCV data to calculate gap reference levels accurately
Visual Dashboard – A clean on-chart table showing key metrics: gap size, volume trend, delta direction, and gap fill probability
Smart Alerts – Configurable alerts for gap setups, gap fill events, and volume anomalies
How It Works:
Gap levels are calculated using End-of-Day (previous session close) as the reference price
All calculations are based on confirmed bar data (barmerge.lookahead_off) to prevent repainting on historical bars
Recommended Usage:
Timeframe: 1–15 minute charts
Market: BIST stocks (optimized for Turkish market open at 10:00 AM)
Works best during the first 30–60 minutes of the trading session
Disclaimer: This indicator is for educational and informational purposes only. It does not constitute financial advice. Always manage your risk accordingly.
Note: As with all intraday indicators, values may update within the current live bar until it closes Indicator

Indicator

Indicator

P&D Short Signal v4.0 [4H]═══════════════════════════════════════════════════════════
TRADINGVIEW PUBLISH — P&D Short Signal v4.0
Author: Kevko87 | Open Source
═══════════════════════════════════════════════════════════
TITLE:
P&D Short Signal v4.0 — Pump & Dump Distribution Detector
───────────────────────────────────────────────────────────
SHORT DESCRIPTION (shown in search):
───────────────────────────────────────────────────────────
Detects post-pump distribution phases on crypto futures using
OBV, RSI divergence, MFI, and Delta-Volume across 4H / 1H / Daily.
Generates Tier 1 and Tier 2 short signals with auto TP/SL levels.
───────────────────────────────────────────────────────────
FULL DESCRIPTION:
───────────────────────────────────────────────────────────
## P&D Short Signal v4.0
This indicator identifies **post-pump distribution phases** on crypto
perpetual futures, designed to catch the dump after a Pump & Dump cycle.
Built and validated on Bitget Futures over 30+ live trading sessions.
---
### How it works
The indicator uses a **multi-timeframe confluence approach**:
- **4H** — Base timeframe (OBV slope, RSI, MFI, Delta-Volume)
- **1H** — OBV confirmation
- **Daily** — Gate-keeper: coins with Daily OBV > 500M are skipped
(high OBV = genuine buying pressure = no short)
A signal fires only when multiple conditions align simultaneously,
filtering out noise and false setups.
---
### Signal Tiers
**🔴 TIER 1 — High Confidence (≥85%)**
- Daily OBV < 500M (gate-keeper passes)
- 4H OBV falling + 1H OBV falling (distribution confirmed)
- RSI > 65 AND (bearish divergence OR below MA)
- MFI > 75 AND falling for 2+ bars
- Delta-Volume negative (optional, toggleable)
**🟠 TIER 2 — Moderate Confidence (~70%)**
- Daily OBV < 500M
- 4H OBV falling
- RSI > 65
- MFI > 65 AND falling
**🔴 MFI Extreme Background Alert**
- MFI ≥ 85 and falling with valid Daily OBV
- Precursor warning — check OBV manually
---
### Auto TP / SL
On every signal, the indicator automatically plots:
- **SL**: Entry High + ATR × 3 (default)
- **TP1**: −15% | **TP2**: −25% | **TP3**: −40% | **TP4**: −60%
All levels fully adjustable via inputs.
---
### Status Table (top right)
Live dashboard showing the current state of all filters:
D-OBV · OBV 4H · OBV 1H · RSI · MFI · Delta · D-RSI · Signal · Trade
---
### Alerts
Three built-in alert conditions:
- 🔴 TIER 1 SHORT
- 🟠 TIER 2 SHORT
- ⚠️ MFI EXTREME
Set alerts via TradingView's alert manager on any ticker.
---
### Recommended Usage
- **Market**: Crypto perpetual futures (Bitget, Bybit, Binance)
- **Timeframe**: 4H (indicator is built for 4H, do not use on other TFs)
- **Best targets**: Low-cap coins after +30–50% pumps within 24h
- **Risk management**: Always use the auto-generated SL. DCA entries
recommended for high-ATR setups.
---
### Key Filter: Daily OBV Gate
The most important filter in this system. If Daily OBV > 500M,
the move has genuine buying pressure behind it — shorting against
that is high risk. The indicator automatically skips these coins.
---
### Inputs
| Parameter | Default | Description |
|-----------|---------|-------------|
| Daily OBV Max | 500M | Skip coins above this OBV |
| OBV Slope Bars | 3 | Lookback for OBV direction |
| RSI Length | 14 | Standard RSI period |
| RSI Min for Entry | 65 | Minimum RSI for overbought |
| Divergence Lookback | 5 | Bars for price/RSI divergence |
| MFI Length | 14 | Standard MFI period |
| MFI Min Tier 1 | 75 | MFI threshold for Tier 1 |
| MFI Min Tier 2 | 65 | MFI threshold for Tier 2 |
| MFI Extreme | 85 | Background alert level |
| SL ATR Multiplier | 3.0 | Stop loss distance |
| TP1–TP4 | 15/25/40/60% | Take profit levels |
---
### Changelog
**v4.0**
- Base timeframe changed from 1H to 4H (higher win rate in backtesting)
- 5 bars on 4H = 20h = one full pump cycle captured
- Tier 1: RSI divergence OR below MA (previously required both)
- MTF structure: 4H base / 1H confirmation / Daily gate-keeper
- Status table added
---
*Open source. Use at your own risk. Not financial advice.*
*Built by Kevko87 — validated on live crypto futures trading.*
Indicator

Trend Pulse OBVTrend Pulse OBV Strategy
Trend Pulse OBV is an educational long-only strategy designed to study trend-channel breakouts that are confirmed by volume flow and a higher-level regime filter.
The strategy combines three main ideas:
1. A Trend Pulse Channel breakout.
2. OBV confirmation using On-Balance Volume relative to its EMA.
3. A regime filter using price relative to an EMA.
The purpose of the script is to test whether upside breakouts above an adaptive channel are more selective when confirmed by both volume accumulation and broader trend direction.
This is a strategy script for research, backtesting, and forward-testing only. It is not financial advice, does not predict future price movement, and does not guarantee profitable results. Historical strategy results are hypothetical and can differ significantly from live trading because of slippage, commissions, liquidity, spread, execution quality, timeframe selection, and market regime changes.
Core concept
The strategy is built around a Trend Pulse Channel. The channel uses a smoothed filter based on the selected source price and a filtered true-range calculation to create an upper breakout band.
A long entry can occur when price crosses above the Trend Pulse Channel upper band, but only if the selected confirmation filters are satisfied.
The strategy does not open short positions.
Entry logic
A long entry occurs when all selected conditions are satisfied:
* Price crosses above the Trend Pulse Channel upper band.
* Price is within the selected date range.
* The regime filter is satisfied, if enabled.
* The OBV confirmation filter is satisfied, if enabled.
* No long position is already open.
The strategy is designed to avoid entering every channel breakout. Instead, it requires confirmation that price is breaking out while broader trend and volume conditions support the move.
Trend Pulse Channel
The Trend Pulse Channel is calculated from:
* A selected source price, default HLC3.
* A multi-pole smoothing filter.
* A filtered true-range stream.
* A range multiplier used to define the upper band.
The upper channel band is used as the breakout trigger.
The midline is used as a possible exit reference when the midline exit is enabled.
OBV confirmation filter
The OBV filter compares On-Balance Volume to an EMA of OBV.
When the filter is enabled, long entries are allowed only when OBV is above its EMA. This is intended to require evidence that volume flow supports the upside breakout.
This does not guarantee continuation. It only adds a volume-based confirmation condition to the channel breakout.
Regime filter
The regime filter compares price to a selected EMA.
When enabled, long entries require price to be above the regime EMA. This is intended to reduce long entries during weaker or downward market environments.
The regime EMA can also be used as an exit condition if the regime exit is enabled.
Lag Mode
Lag Mode applies a zero-lag style pre-transform to both the price source and the true-range stream before they are filtered.
This can make the Trend Pulse Channel respond faster to new price movement, but it can also increase sensitivity and may create more false signals in choppy markets.
Exit logic
The strategy has multiple exit mechanisms:
1. ATR stop
At entry, the script calculates a fixed stop price using the previous bar’s ATR multiplied by the selected ATR stop multiplier. This stop remains fixed after entry.
2. Midline exit
When enabled, the strategy exits if price closes below the Trend Pulse Channel midline.
3. Regime EMA exit
When enabled, the strategy exits if price closes below the regime EMA.
The first active exit condition to trigger can close the position.
Risk and position sizing
The default strategy uses percent-of-equity position sizing.
Users should review the default order size carefully before publishing or relying on backtest results. A large percent-of-equity allocation can make historical results look stronger or weaker than they would under more conservative risk assumptions.
For public publication, users should use realistic position sizing, commission, and slippage assumptions that match the market being tested.
Default strategy properties
The script uses the following strategy properties:
* Initial capital: 1,000
* Position sizing: percent of equity
* Default order size: 70% of equity
* Commission: 0.1%
* Slippage: defined in the strategy settings
* Pyramiding: 1
* Fill orders on standard OHLC: enabled
* Calculate on every tick: disabled
* Calculate on order fills: disabled
* Bar magnifier: disabled
* Process orders on close: disabled
* Long-only execution
These values are provided for testing and can be changed by the user. They should not be interpreted as recommended risk settings.
Important backtesting note
TradingView strategy results are simulations based on historical chart data. They are not live trading results.
Backtest results can change significantly depending on:
* Symbol.
* Timeframe.
* Date range.
* Liquidity.
* Spread.
* Commission.
* Slippage.
* Position size.
* Trend Pulse period.
* Number of poles.
* Range multiplier.
* Lag Mode setting.
* OBV EMA length.
* Regime EMA length.
* ATR length.
* ATR stop multiplier.
* Exit settings.
* Market regime.
Users should test the strategy on a sufficiently large number of trades and across different market conditions before drawing conclusions. A small sample of trades is not enough to evaluate a strategy reliably.
How to use it
A practical workflow is:
1. Select the symbol and timeframe to test.
2. Use a realistic date range that includes different market regimes.
3. Confirm that the strategy produces a sufficient number of trades.
4. Adjust commission and slippage to reflect the market being tested.
5. Review whether the percent-of-equity order size is suitable.
6. Compare results with the OBV filter on and off.
7. Compare results with the regime filter on and off.
8. Compare exits using the midline exit, regime exit, and ATR stop behavior.
9. Forward-test before considering any real-world use.
Inputs
Date Range
* Start Date: first date included in the backtest.
* End Date: last date included in the backtest.
Trend Pulse Channel
* Source: price source used in the channel calculation.
* Poles: smoothing pole count used by the filter.
* Period: main channel smoothing period.
* Range Multiplier: controls the distance of the upper channel band.
* Lag Mode: applies the zero-lag pre-transform before filtering.
OBV Confirmation Filter
* Require OBV > EMA(OBV, N): enables or disables OBV confirmation.
* OBV EMA Length: EMA length applied to OBV.
Regime Filter
* Require close > regime EMA: enables or disables the regime filter.
* Regime EMA Length: EMA length used for the regime filter.
Exit Logic
* Exit on close < TPC midline: exits when price closes below the channel midline.
* Exit on close < regime EMA: exits when price closes below the regime EMA.
Risk — ATR Stop
* ATR Length: ATR period used for stop calculation.
* ATR Stop Multiplier: ATR multiplier used to set the fixed stop distance at entry.
Visual elements
The strategy plots:
* Trend Pulse Channel upper band.
* Trend Pulse Channel midline.
* Regime EMA.
* Long entry markers.
* Long exit markers.
Limitations
This strategy is long-only and does not evaluate short trades.
The strategy can underperform during sideways, choppy, low-volume, or news-driven conditions.
OBV confirmation can reduce some weak breakouts, but it cannot eliminate false breakouts.
The regime EMA is a lagging trend filter and may delay entries or exits.
The ATR stop is fixed at entry and may not adapt to changing volatility after the trade opens.
A breakout above the channel does not guarantee trend continuation.
No backtest can guarantee future performance.
Recommended use
Trend Pulse OBV is used as an educational framework for studying channel breakout behavior with volume-flow confirmation and regime filtering.
It should be used with realistic backtesting assumptions, conservative position sizing, and independent validation before any trading decision.
Strategy
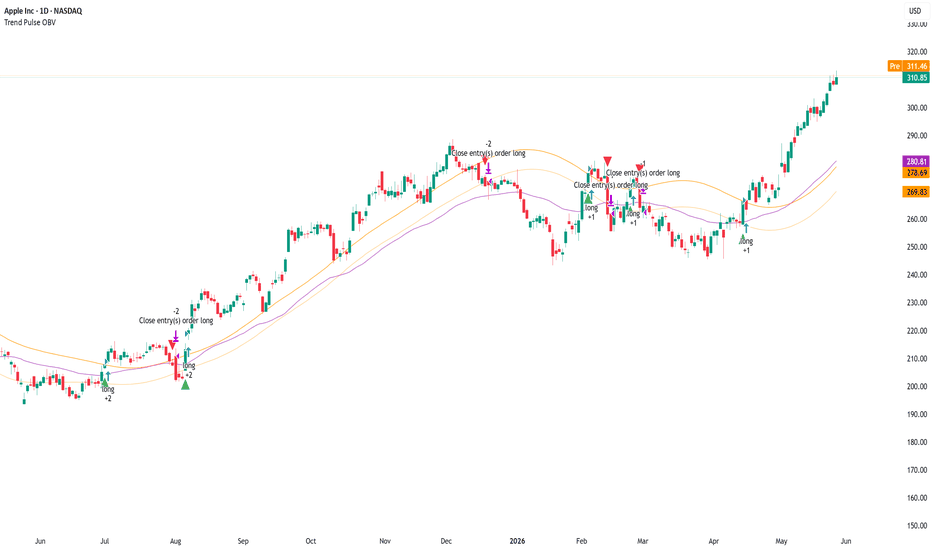
Compass | AnonycryptousCompass | Anonycryptous
Description & user manual
Credits
The weekly psychological level calculation in this indicator is based on open-source code originally published on TradingView. The original script was created by plasmapug. Continued development was done by infernixx, Peshocore, and xtech5192 in collaboration with TradersReality. Significant modifications have been made to integrate this component into the Compass framework.
Why this indicator is different
Most indicators answer one question. A moving average tells you the trend direction. An oscillator tells you momentum. A session box tells you the time. A volume indicator tells you participation. Each one is useful. None of them tells you where you are.
Before placing a trade, a trader needs to answer several questions simultaneously. What session is active and what does that mean for the type of price action to expect? Where does the macro trend stand? Is volume confirming the move or contradicting it? Are there open imbalances nearby that price may return to? How much of the day's expected range has already been consumed? Where are the key structural levels — pivots, the daily open, prior week references?
Answering each of these questions separately requires stacking tool after tool until the chart becomes unreadable. Compass answers all of them at once.
It is not a signal indicator. It does not fire arrows or tell you when to buy or sell. What it does is something more fundamental: it gives you a complete read of the market environment before any decision is made. Sessions, trend, volume, imbalances, range levels, pivots, psychological references — all in one overlay, all configurable, all on one chart.
The design philosophy is orientation first. Decision second. Compass tells you where you are. What you do with that is your responsibility.
Important notice
Compass does not generate trading signals.
It does not tell you when to buy or sell.
It does not predict market direction.
It does not replace your trading strategy or your own analysis.
All illustrative examples in this manual are for educational purposes only and are not trading recommendations.
All trading decisions remain entirely with the user.
Always apply your own judgment and manage your own risk.
1. Overview
Compass is a comprehensive market context indicator that combines eleven independent analysis frameworks into one unified overlay. Every component is individually toggleable. Six presets are included for different trading styles, from fast scalping to full multi-component analysis.
What it includes:
- Five-EMA suite with adaptive cloud around the EMA 50
- EMA crossover system with configurable signals and candle coloring
- Stochastic RSI background alerts with four alert types and RSI divergence detection
- PVSRA volume vector candle analysis with zone tracking and configurable thresholds
- Eight global market sessions with automatic DST awareness
- Average daily, weekly, and monthly range levels with 50% midpoints
- Classic pivot points with mid-point levels
- Daily open reference line with historical opens
- Fair value gap detection with partial absorption tracking
- Weekly psychological level tracking
- Live dashboard with eighteen data points across all active components
2. EMA suite
Five exponential moving averages are plotted simultaneously: EMA 5, EMA 13, EMA 50, EMA 200, and EMA 800. Together they cover short-term momentum, medium-term trend direction, macro trend, and long-term structural bias.
The EMA 50 is wrapped in a dynamic cloud calculated from two standard deviations of price. The cloud expands during volatility and contracts during consolidation. A widening cloud indicates active price discovery. A thinning cloud indicates equilibrium or compression before a directional move.
The EMA 200 is the primary macro bias filter. Price above it defines a broadly bullish environment. Price below it defines a broadly bearish environment. This is shown in the dashboard at all times.
The EMA 800 provides long-term structural context, particularly useful on mid to higher timeframes where it marks the gravitational center of multi-month price structure.
All five EMA lengths are configurable. Each has individual color and transparency controls. An EMA label option displays the current value at the right edge of each line.
3. EMA cross system
The EMA cross tracks a configurable fast EMA crossing a configurable slow EMA and marks the crossover bar. All candles after a cross continue in the direction of that cross until the opposite cross fires.
Three display modes are available: show both the fast and slow EMA lines, show a single consolidated EMA line, or hide the EMA lines entirely while keeping the crossover signals visible.
This component is a trend state indicator, not a trade trigger. A bull cross does not mean buy. It means the short-term trend has shifted upward relative to the medium-term average.
Signals and candle coloring can be toggled independently.
4. Stochastic RSI
The stochastic RSI component runs a standard stochastic RSI calculation and generates background color alerts based on crossover conditions at configurable band levels.
Four alert types are available, each independently toggleable:
Middle band crossover — K line crosses D line near the 50 level. Indicates a possible trend shift in momentum.
Overbought/oversold crossover — K line crosses D line from overbought or oversold territory. Indicates a potential reversal from an extreme.
Entering overbought — K line crosses above the upper band. Indicates that momentum has moved into overbought territory.
Entering oversold — K line crosses below the lower band. Indicates that momentum has moved into oversold territory.
The dashboard displays the current stochastic RSI state and the RSI value. RSI appears in green when above the midline and in red when below. Regular bullish and bearish divergence is detected automatically and shown in the dashboard as a directional label. When divergence is active, a thin reference line appears on the price chart marking the divergence candles.
5. PVSRA volume vector analysis
PVSRA analysis colors candles based on volume relative to the 10-bar average and the relationship between volume and candle spread.
Four vector types:
Green vector — bullish bar where volume is at or above the green/red threshold (default 200% of the 10-bar average), or where volume multiplied by spread is the highest of the last 10 bars. Indicates strong bullish institutional participation.
Red vector — same conditions on a bearish bar. Indicates strong bearish institutional participation.
Blue vector — bullish bar where volume is at or above the blue/violet threshold (default 150% of average). Indicates elevated bullish volume below the institutional threshold.
Violet vector — same conditions on a bearish bar. Indicates elevated bearish volume.
Grey — no vector conditions met. Normal volume.
Both thresholds are configurable directly from the settings panel. Blue and violet signals are strictly exclusive from green and red — a bar cannot qualify for both simultaneously.
Vector candle zones draw boxes at each vector candle location and remain active until price moves through the zone, marking areas where elevated institutional activity was detected at the time the candle formed.
The PVSRA override input allows a different symbol to be used for the volume calculation. This is useful when the charted instrument has unreliable volume data, such as CFDs, perpetual swaps, or instruments where the primary volume is on a related market.
6. Market sessions
Eight global trading sessions are tracked simultaneously, each with automatic DST awareness. Sessions are displayed as expanding boxes with high and low lines and a real-time label showing the session open.
Sessions included:
- London: 08:00–16:30 UTC
- New York: 14:30–21:00 UTC
- Tokyo: 00:00–06:00 UTC
- Hong Kong: 01:30–08:00 UTC
- Sydney: 22:00–06:00 UTC
- EU brinks: 08:00–09:00 UTC
- US brinks: 14:00–15:00 UTC
- Frankfurt: 07:00–16:30 UTC
DST is handled automatically for London, New York, and Sydney. No manual adjustment is needed. Each session can be toggled individually, and box color, transparency, and label color are fully configurable per session.
Session context matters because market behavior differs significantly depending on which participants are active. London and New York overlap produces the highest volume and fastest price movement. Tokyo and Sydney sessions tend to consolidate. The brinks windows mark the transition periods where session highs and lows often form.
7. Range levels
Three statistical range frameworks measure the expected price range for the current period based on historical averages.
Average daily range (ADR) — the expected high and low for the current trading day. When price reaches the ADR level, the day's expected range has been consumed. Moves beyond the ADR are extension moves that occur with lower statistical probability and often mean-revert. The dashboard shows ADR % used — how much of today's expected range has already been consumed. Above 80% indicates the day is approaching its expected limit.
Average weekly range (AWR) — the same concept applied to the current week. Useful for assessing how much room the week has left to move.
Average monthly range (AMR) — the same concept applied to the current month. Provides macro context for position sizing and target expectations.
Each framework includes a 50% midpoint level marking the center of the expected range. The ADR measure from daily open option calculates the range starting from that day's open price rather than the statistical high, making the levels static for the entire day.
All three frameworks have individual lookback period inputs, color controls, line styles, and label toggles.
8. Pivot points
Classic pivot points are calculated from the prior day's high, low, and close. Levels include PP, R1/S1, R2/S2, R3/S3, and M mid-point levels between each major level.
Pivot points provide structural reference for the current session. Price above PP defines a broadly bullish day structure. R levels act as potential resistance targets. S levels act as potential support targets. M levels provide intermediate precision references between major pivots.
All levels can be toggled individually. Lines extend rightward from the prior session and can optionally extend in both directions. Each level has individual color and line style controls.
9. Daily open
A horizontal line marks the current day's opening price. This is one of the most referenced structural levels among short-term traders because it defines the starting point for the day's price discovery.
Price above the daily open reflects a bullish session bias. Price below reflects a bearish session bias. When price oscillates around the daily open without committing direction, the session is in balance — a lower probability environment for trend trades.
Historical daily opens can optionally be shown as reference for prior day context.
10. Fair value gaps
A fair value gap is a three-bar imbalance where price moved through a range without leaving two-sided trade — the low of the upper candle is above the high of the lower candle (bullish gap) or vice versa (bearish gap). These areas represent unfinished business where the market may return to achieve balance.
Gaps are filtered by a minimum width threshold expressed as a multiple of ATR. Gaps narrower than the threshold are excluded. Partial absorption is tracked — as price returns into the gap, the fill color changes to show how much of the imbalance has been recovered.
Fully mitigated gaps can be kept on the chart as historical reference or deleted automatically to maintain a clean view.
11. Psychological levels
Weekly psychological levels mark the prior week's high and low as calculated by a specific session-anchored method. These levels represent deliberate structural references where participants have previously committed size — breakouts and rejections around these levels tend to be more intentional than random price noise.
Three GMT offset options accommodate the session anchor calculation for different global market structures. Two mode options are available: crypto (weekly reset on Saturday Sydney open) and forex (weekly reset on Monday Tokyo open).
12. Settings reference
Preset
- Custom: full manual control over all settings.
- Clean scalper: sessions, EMA suite, FVG, subtle candle coloring. Low noise.
- Full context: everything on, medium transparency. Best for analysis.
- Signal focus: EMA cross, stoch RSI background, PVSRA bar color prominent. Rest subtle.
- Minimal: sessions, daily open, ADR only. No signals.
- PVSRA pro: PVSRA and vector candle zones central. EMA 200 and 800 only.
Global settings
- Master opacity offset (custom preset only): shifts all transparency values simultaneously.
- Show bull/bear label text: shows or hides text on EMA cross signal triangles.
EMA suite
- Show EMA suite and labels
- Individual EMA color and transparency controls
- EMA cloud fill and border transparency
- EMA line width
EMA cross
- Show EMA cross signals
- Fast EMA, slow EMA, and consolidated EMA lengths
- Show both EMAs or consolidated only
- Bull, bear, and neutral colors and transparency
- Cross EMA line width
Stochastic RSI
- Show stochastic RSI background alerts
- RSI length and stochastic length
- Overbought and oversold band levels
- Individual alert type toggles (four types)
- Alert colors and transparency
- RSI divergence lookback period
- Divergence line color and width
PVSRA
- Vector colors (red, green, violet, blue, regular up/down)
- Green/red threshold (× average volume, default 2.0)
- Blue/violet threshold (× average volume, default 1.5)
- Include spread filter for green/red classification
- Override symbol toggle and input
- Show vector candle zones with transparency and width settings
Candle coloring
- Enable candle coloring
- Coloring mode: EMA cross / PVSRA / EMA 200 / off
- Bull and bear candle color and transparency
Market sessions
- Show market sessions
- Session timezone
- Show sessions on weekends
- Session high/low line style and width
- Per session: toggle, box color, transparency, label color
Range levels
- Show ADR, AWR, AMR (individual toggles)
- Lookback periods for each
- Show 50% midpoint levels
- Measure from daily open (ADR only)
- Color, transparency, line width, line style, labels
Pivot points
- Show PP, R1/S1, R2/S2, R3/S3, M levels individually
- Show labels
- Extend lines both directions
- Individual level colors and line styles
- Pivot line width
Daily open
- Show daily open
- Show label
- Show historical daily opens
- Color, transparency, line width
Fair value gaps
- Show fair value gaps
- Width filter (ATR multiplier)
- Extend to current bar
- Bullish and bearish FVG colors
- Mitigation fill colors
- Keep historical FVGs after mitigation
Psychological levels
- Show psy levels and labels
- Show historical psy levels
- GMT offset (GMT+1, GMT+2, GMT+3)
- Psy type: crypto or forex
- High and low colors and transparency
Dashboard
- Show dashboard
- Position: top left, top right, bottom left, bottom right
- Size: tiny, small, normal
13. Dashboard reference
The dashboard provides eighteen live data points across all active components:
Session — the currently active market session.
EMA cross — current EMA cross direction: bull or bear.
EMA 200 — whether price is above or below the EMA 200.
Stoch RSI — current stochastic RSI condition.
RSI — current RSI value, colored green above midline and red below.
RSI divergence — active bullish or bearish divergence, or none.
PVSRA — current candle vector type.
ADR % used — how much of today's expected daily range has been consumed.
FVG active — count of open unmitigated fair value gaps and mitigation percentage.
Psy level — whether price is above or below the prior week's psychological level.
Timezone — active session timezone setting.
VCZ active — count of active vector candle zones above and below current price.
Pivot PP — current pivot point value.
Daily open — current daily open price and direction.
14. How to use
14.1 Initial setup
Select a preset that matches your primary trading style. Adjust the session timezone to match your location or your primary exchange. If you trade an instrument with unreliable volume data, enable the PVSRA override and set it to a correlated liquid instrument. Set the ADR lookback period to your preference — 14 days is a standard starting point. For FVGs, set the width filter to 0.5 or higher to exclude minor gaps.
14.2 Reading the dashboard
The dashboard is the fastest way to orient yourself on a new chart or a new session. Check session, EMA cross direction, EMA 200 position, stoch RSI state, and ADR consumed before anything else. Five seconds to a full picture of where the market stands.
14.3 Reading the chart
Check EMA alignment. When EMA 13, EMA 50, and EMA 200 are stacked in the same direction, the trend is more significant than a single crossover. Divergence between them reflects a transition or competing timeframe pressures.
Check ADR percentage. Below 50% means the day has statistical room to move. Above 80% means the day is near its expected limit and extension moves are less probable.
Look for open FVGs near current price. An unmitigated FVG in the direction of the prevailing trend is a precision reference area where price has historically returned.
Check the psy level. If price is approaching the prior week's high or low, be aware that participant behavior around those references tends to be deliberate.
14.4 Timeframe guide
1 minute to 3 minutes — clean scalper preset, candle coloring set to EMA cross.
5 minutes to 15 minutes — clean scalper or signal focus preset.
30 minutes to 1 hour — full context preset, use ADR and pivot points.
4 hours to daily — full context or minimal preset.
14.5 Tips
PVSRA override — use when your broker's volume data is unreliable, when you trade a CFD or derivative with synthetic volume, or when you want spot market volume for a futures chart.
Master opacity offset — adding 10 to 20 increases overall transparency and dims the chart if it feels cluttered. Subtracting 10 to 20 makes all elements more prominent. This shifts all transparency values simultaneously without changing individual settings. Only active in custom preset.
Not every component needs to be active at once. Most traders will find three to four components provide the context they need for their specific setup.
15. Disclaimer
This indicator is provided for educational and informational purposes only.
Nothing in this document constitutes financial advice or any form of trading recommendation.
Trading financial instruments involves substantial risk of loss.
Past performance is not indicative of future results.
You may lose all of your invested capital.
All trading decisions are made entirely by the user.
Use at your own discretion.
Indicator

MTF Market State DashboardA multi-timeframe market context dashboard designed to classify market conditions using three independent analytical layers: Trend direction, Trend strength and Participation / Volume flow
Instead of relying on a single indicator or isolated signal, this script combines multiple forms of market information into a structured decision framework intended to help traders evaluate the quality and maturity of a market condition.
The goal of the dashboard is not to predict tops or bottoms, but to help identify:
• aligned market conditions
• conflicting conditions
• strengthening trends
• weakening trends
• and low-conviction environments
Core Idea Behind The Script
Many indicators work well in certain environments and poorly in others.
For example:
• Trend indicators may continue showing bullish conditions during weakening momentum.
• Momentum indicators may react aggressively inside consolidations.
• Volume indicators may show temporary spikes without broader trend confirmation.
This script was built to reduce that fragmentation by separating market behavior into three independent layers:
1. Direction
Defines where the market is currently biased.
2. Strength
Measures whether the move has enough momentum to sustain itself.
3. Participation
Evaluates whether price movement is supported by broader volume-flow behavior.
The dashboard then combines these layers into a unified market-state classification system.
What The Dashboard Tracks
1. Trend Structure Layer
The script evaluates directional bias using:
EMA 200
Used as the higher-level directional filter.
Typical interpretation:
• Price above EMA 200 → bullish macro bias
• Price below EMA 200 → bearish macro bias
EMA 50
Tracks intermediate trend behavior and shorter-term structural changes.
Supertrend
Used as a dynamic trend confirmation layer.
Unlike a static moving average, the Supertrend adapts to volatility and helps identify directional transitions more quickly.
Each trend component is displayed as:
• BULL
• BEAR
along with an “age” value showing how many bars have passed since the last state change.
This allows traders to distinguish between:
• fresh transitions
• mature trends
• and potentially exhausted conditions
2. Trend Strength Layer
ADX (via DMI)
ADX is used to measure trend strength, not trend direction.
Typical interpretation:
• Low ADX → weak or ranging environment
• Rising / high ADX → stronger directional environment
This distinction matters because bullish conditions inside weak trend environments often behave differently from bullish conditions inside expanding trends.
The script uses ADX as a confirmation filter inside the Market State logic.
3. Participation & Volume-Flow Layer
This layer attempts to measure whether directional movement is being supported by participation and flow behavior.
CMF (Chaikin Money Flow)
CMF estimates buying versus selling pressure by evaluating closing location relative to range and volume.
General interpretation:
• Positive CMF → accumulation pressure
• Negative CMF → distribution pressure
CDV (Cumulative Delta Volume Proxy)
Pine Script does not provide true bid/ask delta data.
This script therefore uses a candle-based directional volume proxy to estimate cumulative directional participation.
The CDV layer classifies conditions as:
• Rising
• Falling
• Neutral
Adaptive filtering is included to reduce minor fluctuations and noise.
OBV Breakout Detection
The script also evaluates whether On-Balance Volume is breaking above or below recent ranges.
This is used to identify:
• expanding participation
• weakening participation
• or neutral flow conditions
The OBV component is not intended as a standalone signal generator, but rather as an additional confirmation layer inside the broader market-state framework.
Market State Classification
One of the main purposes of the script is to convert multiple independent readings into a simplified market-state output.
The dashboard derives a “Market State” by combining:
• Trend direction
• Trend strength
• Participation / flow confirmation
Possible classifications include:
• Strong Bull Context
• Bull Context
• Mixed / Wait
• Bear Context
• Strong Bear Context
The classification is not predictive and should not be interpreted as financial advice.
Instead, it is intended to provide a structured summary of current market conditions.
How Market State Is Derived
The logic combines three internal scoring groups:
Trend Score
Built from:
• EMA 200 state
• EMA 50 state
• Supertrend state
Participation Score
Built from:
• CMF bias
• CDV direction
• OBV breakout state
Strength Filter
Built from:
• ADX threshold validation
Example:
• bullish trend structure
• bullish participation
• and strong ADX
→ may classify as “Strong Bull Context”
Whereas:
• bullish trend structure
• weak participation
• and weak ADX
→ may classify as “Mixed / Wait”
This allows the dashboard to identify agreement and disagreement between independent analytical layers.
Multi-Timeframe Logic
The script supports:
• single timeframe mode
• dual timeframe mode
Typical usage example:
• Lower timeframe → execution context
• Higher timeframe → broader directional context
This allows traders to compare:
• local conditions
• against higher timeframe structure
without switching charts repeatedly.
Age Tracking
Each directional state includes an “age” measurement representing the number of bars since the last directional transition.
This is included because newer transitions and older trends may behave differently.
Example:
• Low age → newer condition
• High age → more mature condition
The script does not assume older trends will reverse, but age can provide additional context about trend maturity.
Practical Interpretation
Example: Higher-Conviction Bullish Environment
Possible characteristics:
• EMA structure bullish
• Supertrend bullish
• ADX elevated
• CMF positive
• CDV rising
• OBV breakout bullish
This may indicate alignment between:
• trend
• momentum
• and participation
Example: Mixed Environment
Possible characteristics:
• bullish EMA structure
• falling CDV
• weak ADX
• neutral OBV behavior
This may indicate:
• weakening momentum
• transition behavior
• or lower-conviction conditions
Intended Usage
The script is designed as:
• a context tool
• a filtering framework
• and a market-state dashboard
It is not intended to replace:
• risk management
• execution models
• or broader trading plans
The dashboard is generally most useful when combined with:
• breakout systems
• pullback systems
• trend-following models
• or discretionary execution methods
Customization Options
The script includes:
• 1TF / 2TF modes
• configurable EMA lengths
• Supertrend settings
• ADX threshold controls
• CDV sensitivity adjustment
• OBV breakout lookback settings
• Table themes
• Text sizing
• Dashboard positioning
Notes
• CDV uses a candle-based proxy because true bid/ask delta data is unavailable in Pine Script.
• The dashboard focuses on contextual interpretation rather than direct entry signals.
• The Market State classification is derived from internal scoring logic and should be interpreted as a contextual summary, not a prediction engine.
Summary
This dashboard was designed to organize multiple forms of market information into a single structured framework.
Rather than treating trend, momentum, and participation separately, the script attempts to evaluate how they interact with each other across one or more timeframes.
The result is a compact market-context tool intended to help traders:
• identify alignment
• recognize conflict
• filter weaker conditions
• and evaluate overall market structure more efficiently.
Indicator

Flow-RegimeFlow-Regime
A multi-source flow oscillator. It normalizes three independent measures of
market flow to a unified ±100 scale and combines them into a conviction-
weighted composite line, so you can see at a glance whether OBV, A/D, and
price flow are agreeing or diverging.
▌ What's plotted
Three normalized lines, each computed through the same pipeline
(CCI → percentrank → linear map to ±100):
• OBV-Flow — On-Balance Volume (signed cumulative volume)
• AD-Flow — Chaikin Accumulation/Distribution
• Price-Regime — price flow (ohlc4)
Plus a Fitted composite — the average of the three, amplified by |conviction|,
where conviction = average ÷ mean(|x|, |y|, |z|). When all three lines agree
the composite is amplified; when they conflict it is suppressed toward zero.
The Fitted line uses 5-tier coloring driven by how many of the three exceed
the neutral threshold (default ±20): solid green/red = all three agree, lighter
shades = two of three, gray = no consensus.
▌ Two lookback modes
Linear (default) — TF-specific lookback with sensible per-timeframe defaults
(1m=60, 5m=24, 15m=16, 1h=24, 4h=18, 1d=7, 1w=12, 1M=12), all editable.
Anchored — pick an anchor timestamp; the percentrank window grows from 0 at
that bar to (current_bar − anchor_bar) at the right edge of the chart. Use
this to lock the statistical baseline to a specific event — a regime start,
a major breakout, a news release. The anchor bar is marked with a yellow
diamond at fitted = 0.
▌ How to read it
The OB zone (≥ +70) and OS zone (≤ −70) are shaded — these are statistically
stretched conditions. Bars where the Fitted line reaches ±99 get a soft red/
green background tint as an "at the extreme" warning. Two corresponding alert
conditions are exposed for use with TV alerts.
This indicator does NOT emit trade signals. Per-line reversal dots and
confluence triangles are intentionally absent: those patterns can fit
historical noise convincingly without generalizing forward. Treat extremes
as flags to investigate, not entries to take.
Useful interpretive frames:
• All three lines extreme in the same direction = strongest evidence of
flow consensus.
• One or two lines diverging from the others at extremes = a divergence
worth examining on the chart.
• Fitted approaching ±99 = statistical extreme, regardless of direction.
▌ Notes
In Anchored mode, the first few bars after the anchor have very few historical
points to rank against, so percentrank values can swing to ±100 from sparse
data — read these bars with caution. CCI itself always uses the full real
price history regardless of mode, so its 20-bar internal window is never
distorted by the anchor.
Enable the Debug label in settings to verify which mode and lookback are
currently active on the chart. Indicator

Conflux Engine | AnonycryptousConflux Engine | Anonycryptous
Description & user manual
Why this indicator is different?
Most signal indicators work the same way. One condition triggers. One signal fires. The trader either takes it or does not.
The problem is that a single condition — a crossover, a level break, a momentum read — is almost never enough to define a genuinely high-quality trade. Markets are too complex and too noisy for that.
Conflux Engine works differently.
It does not fire on one condition. It requires multiple independent market forces to align simultaneously before a signal appears. Structure has to agree. Volume has to confirm. Momentum has to support. Volatility has to be in the right zone. Session positioning has to be favorable. And optionally, the higher timeframe trend and the ribbon have to be aligned too.
Only when enough of these forces agree — and agree clearly — does the indicator produce a signal.
This is what confluence means in practice. Not one thing being right. Multiple independent things being right at the same time.
The result is fewer signals. But the signals that do appear carry more weight than anything a single-condition system can produce.
Important notice
Conflux Engine generates trading signals based on a multi-factor scoring engine.
These signals are not financial advice.
They do not predict the future.
They do not guarantee profitability.
They are a systematic read of current market conditions across multiple dimensions.
All trading decisions are made entirely by the user.
Always manage your own risk. Always apply your own judgment.
1. Overview
Conflux Engine is a scoring-based signal indicator for traders who want structured, high-conviction entries rather than frequent, noisy ones.
Six independent pillars evaluate the market continuously. Each pillar scores independently. The scores combine into a total out of 100. When the total exceeds the signal threshold — and the dominant direction leads the opposite direction by a minimum gap — a signal fires.
Additional hard gates can be enabled: an ADX noise filter to block signals during choppy markets, a VWMA filter to ensure macro trend alignment, a Supertrend filter for dynamic trend confirmation, and an Ultra Ribbon filter using 15 Hull Moving Averages for the fastest momentum read.
The result is an indicator that is selective by design. It is not built to fire constantly. It is built to fire well.
2. The six pillars
2.1 Structure
Evaluates market structure using swing pivot highs and lows. A higher high combined with a higher low defines a bullish structure. A lower high combined with a lower low defines a bearish structure.
This pillar answers the most fundamental question in trading: is the market making progress in a direction, or is it deteriorating?
Weight: up to 16 points.
2.2 Volume
Uses OBV slope via linear regression to determine whether volume is accumulating in the direction of price or diverging from it.
Rising OBV slope on a bullish signal means participation supports the move. Falling OBV slope on a bullish signal is a warning. This pillar separates moves with institutional backing from moves without it.
Weight: up to 16 points.
2.3 Momentum
Evaluates three independent momentum reads: KAMA position (a Kaufman adaptive moving average that adjusts its speed to market conditions), RSI relative to the 50 midline with slope direction, and Williams %R for price positioning within the recent range.
Two of three aligned scores partial points. All three aligned scores full points.
Weight: up to 16 points.
2.4 Liquidity
Detects sweep events — moments where price wicks beyond a recent swing high or low and closes back inside. These events mark liquidity grabs and often precede directional moves.
A confirmed bull sweep sets up a long bias context. A confirmed bear sweep sets up a short bias context. The context remains active for a configurable number of bars, decaying over time.
Weight: up to 16 points.
2.5 Volatility
Measures ATR relative to its own moving average to identify the volatility sweet spot. Signals during dead, flat markets carry less meaning. Signals during chaotically explosive moves are harder to execute cleanly. This pillar rewards the in-between: active, directional, manageable volatility.
Weight: up to 16 points.
2.6 Session
Evaluates price positioning within the current day's developing range. Price in the lower portion of the range (discount) favors long bias. Price in the upper portion (premium) favors short bias.
This pillar can be toggled independently from the session time filter — you can use session scoring without restricting signals to specific hours, or vice versa.
Weight: up to 20 points.
3. Hard gates
Beyond the six scoring pillars, Conflux Engine includes four optional hard gates. These do not add points. They block signals entirely when their condition is not met.
3.1 ADX noise filter
Blocks signals when ADX is below a configurable threshold. ADX measures trend strength. A low ADX means the market is ranging and directionless — exactly the environment where momentum signals fail most often. Default threshold: 35. Adjustable up to 100 for maximum selectivity.
3.2 VWMA filter
Price must be above the Volume Weighted Moving Average for long signals, and below it for short signals. The VWMA is slower than a standard EMA and reflects the average price weighted by volume — a more meaningful macro reference than a simple average. Default length: 200.
3.3 Supertrend filter
The Supertrend must confirm the signal direction. This is a dynamic trend line based on ATR bands that flips cleanly between bull and bear states. It acts as an additional structural confirmation that the trend environment supports the entry.
3.4 Ultra Ribbon filter
The fastest gate. Built from 15 Hull Moving Averages spanning a range of lengths. When the fastest HMA is above the slowest HMA, the ribbon is bullish. When below, bearish. Because Hull MAs minimize lag, this gate reacts to trend changes earlier than most moving average systems.
The ribbon also serves as a trailing stop option in the backtest — the slowest HMA tracks trend without being too reactive.
4. Signal scoring
Every bar, both a bullish and bearish score are computed from the six pillars. The scores are added together.
A signal fires when:
- The dominant score meets or exceeds the signal threshold (default 70)
- The dominant score exceeds the opposite score by at least the directional lead (default 20)
- All enabled hard gates are cleared
This two-condition check — threshold plus gap — prevents marginal signals from appearing when the market is ambiguous. Both bull and bear can score reasonably high during mixed conditions. The gap requirement ensures the dominant direction is meaningfully ahead.
Pillar weights are individually adjustable. The system allows traders to prioritize the factors most relevant to their trading style and instrument.
The Extreme Threshold (default 90) flags signals where the confluence score is exceptionally high. These are the highest-conviction setups in the system.
5. The Ultra Ribbon
The Ultra Ribbon is a 15-layer Hull Moving Average ribbon that sits on the chart as both a visual trend tool and a momentum gate. Three themes are available:
Classic — green and red. Clear, functional, no ambiguity.
Phantom — cyan and pink with purple exhaustion. A darker, stylized read of the same data. (the default)
Custom — full color control for bull, bear, and exhaustion states.
The ribbon color adapts dynamically. When the spread between the fastest and slowest HMA is wide relative to its historical average, the ribbon fades toward the exhaustion color — a visual signal that the trend may be overextended. When the spread is moderate, the ribbon shows its full trend color.
Candle coloring follows the ribbon's bull/bear state continuously, giving an immediate read of trend direction on every bar.
The dashboard accent color and signal indicators follow the active theme, giving the entire indicator a unified visual identity across chart and panel.
6. Multi-timeframe filter
When enabled, the MTF filter evaluates the trend on a higher timeframe using a 50-period EMA. If the higher timeframe trend agrees with the signal direction, a weight bonus is added to the total score. If it disagrees, no bonus is added — but the signal is not blocked unless the score falls below threshold as a result.
This behavior is intentional. The HTF filter adds weight to aligned signals without making every counter-trend setup impossible. It rewards confluence with the bigger picture without enforcing hard alignment.
Default timeframe: 240 (4-hour).
Default weight bonus: 20 points.
7. Backtest and performance tracking
Confluence Engine includes a built-in performance tracker that logs every signal, applies configurable stop and target multipliers based on the current regime, and tracks wins, losses, and win rate across the visible history.
Stop loss modes:
- ATR — a fixed multiple of ATR from the entry price. Simple and consistent.
- Pivot — stop placed at the most recent swing low (for longs) or swing high (for shorts). Respects structure.
- Supertrend — stop placed at the dynamic Supertrend level at the time of entry. Tighter and adaptive.
- Trailing (h15) — stop follows the slowest HMA of the Ultra Ribbon. Trends with the market and gives winners more room.
Target multipliers are adjustable for each regime: Scalp, Intraday, and Swing. The regime is determined by the current ADX value.
Recent log shows the last three trade results in R multiples. This gives a quick read on recent system performance without requiring a separate journaling tool.
Note: the backtest uses bar close logic and approximated fill prices. It is a directional performance reference, not a precise simulation. Session filtering does not retroactively apply to historical trades — enabling session filtering after a test period will affect forward signals but not past performance data.
8. Dashboard reference
The dashboard updates on every bar and shows:
- Header: indicator name and current timeframe
- Pillar rows 1–6: score per pillar, colored by direction
- HTF Trend: higher timeframe alignment and weight (when MTF enabled)
- Signal: LONG / SHORT / WAIT with direction color
- Win Rate: percentage of tracked signals that hit target
- Recent Log: last three results in R multiples
- Score: total confluence score out of 100
- Session: OPEN or FILTERED
The dashboard header and accent colors follow the active ribbon theme.
Tiny, Small, and Normal size options are available.
9. Settings reference
General Settings
- Signal Threshold: minimum score to trigger a signal (50–95, default 70)
- Extreme Threshold: score above which extreme confluence is flagged (80–100, default 90)
- Directional Lead: minimum gap between bull and bear score (default 20)
Multi-Timeframe Trend
- Enable MTF Filter
- HTF Timeframe (default 240)
- HTF Weight (default 20)
Quality Filters (Noise Reduction)
- Enable ADX Noise Filter
- Min ADX Value (0–100, default 35)
Trend Confirmation
- Enable VWMA Filter + length
- Enable Supertrend Filter + ATR length + multiplier
- Show/hide Supertrend and VWMA lines
Pillar Weights
- Individual weight for each of the six pillars
Session Filtering
- Filter Entries by Session (time gate)
- Enable Session Pillar Scoring (premium/discount scoring)
- Trading Session input
Trade Suggestions (ATR Multipliers)
- SL and TP multipliers for Scalp, Intraday, and Swing regimes
Ultra Ribbon
- Enable Ribbon Filter
- Show Ribbon on Chart
- Base Length and Length Step
- Theme: Classic / Phantom / Custom
- Custom color inputs (bull, bear, elite)
Backtest & UI
- Enable Performance Tracking
- Start Year
- Show Active Trade Lines
- Show Recent Trade Log
- Stop Loss Mode: ATR / Pivot / Supertrend / Trailing (h15)
UI Settings
- Show Dashboard
- Dashboard Position
- Dashboard Size: Tiny / Small / Normal
10. How to use
10.1 Initial setup
1. Load the indicator on your preferred chart and timeframe.
2. Select a ribbon theme that matches your visual preference.
3. Set the signal threshold based on your desired selectivity. Start at 70.
4. Set the directional lead. 15–20 is a balanced starting point.
5. Enable the hard gates relevant to your style. For intraday trading, ADX + Supertrend is a strong combination. For swing trading, VWMA + MTF adds macro context.
6. Configure the session scoring if you trade specific sessions. NY traders: set session to 1330–2000 UTC (or your local equivalent).
7. Set your backtest start year and stop mode preference.
10.2 Reading a signal
When a signal appears:
- Check the dashboard. Which pillars are active? A signal with Structure + Volume + Momentum all scoring is stronger than one carried primarily by Session and Volatility.
- Check the score. A signal at 72 with a 20-point gap is valid but tight. A signal at 88 with a 30-point gap is a high-conviction setup.
- Check the ribbon. Is it cleanly bullish or bearish? Is it near exhaustion color? Signals during ribbon exhaustion carry more risk.
- Check the hard gates. They cleared — but were they close? A signal that barely cleared ADX 35 is different from one with ADX at 55.
10.3 Managing entries
Confluence Engine does not tell you the exact entry price. It tells you when conditions align. Your entry technique — pullback, breakout, limit at structure — remains your decision.
Use the stop mode that fits your trade: ATR for consistency, Pivot for structure-respect, Supertrend for dynamic adaptation, Trailing h15 for trend trades you want to hold.
10.4 Interpreting win rate
The built-in win rate is a useful reference, not a guarantee of future performance. A 65% win rate over 50 signals on a specific asset and timeframe tells you the system has been profitable in that environment. It does not guarantee the next signal wins.
Win rate should always be evaluated alongside average RR. A 60% win rate at 2R average beats a 70% win rate at 0.8R average. Use the recent log and the trade lines together to assess both dimensions.
10.5 Optimizing settings
If you see too many signals: raise the threshold, raise the directional lead, raise the ADX minimum, or enable additional hard gates.
If you see too few signals: lower the threshold slightly, reduce the directional lead, or disable one or two hard gates.
Do not optimize purely for win rate without considering signal frequency. A system that fires once per week at 80% win rate is different in practice from one that fires daily at 65%. Both can be profitable. Choose what fits your trading style.
11. Timeframe guide
1m–5m — Ultra Ribbon filter on, ADX threshold 30–40, Supertrend on, session scoring on. Focus on fast momentum signals during active sessions.
15m–30m — Full filter stack recommended. Threshold 70–75. Strong balance of frequency and quality.
1H–4H — VWMA and MTF filter add significant value. Threshold 75–80. Fewer signals, higher conviction.
Daily — Disable session scoring. Enable VWMA and MTF only. Use as swing context, not scalp tool.
12. What this indicator does not do
- Does not predict price direction with certainty
- Does not guarantee profitability
- Does not replace your own risk management
- Does not account for news events, gaps, or liquidity voids
- Does not track open positions in real time
- Does not connect to any broker or execution system
- Does not replace the Risk Management Engine for position sizing and account compliance
For position sizing, drawdown compliance, and trade logging, pair with Risk Management Engine | Anonycryptous.
For complete session analysis and market context, pair with Environment | Anonycryptous.
Together, the three tools cover strategy context, signal generation, and risk execution — a complete framework for structured trading.
13. Disclaimer
This indicator is provided for educational and informational purposes only. Nothing in this document constitutes financial advice or any form of recommendation.
All trading decisions are made entirely by the user. The indicator provides signal analysis based on configurable parameters — the relevance of any output depends on how those parameters are set and the market conditions in which the indicator is used.
Trading financial instruments involves substantial risk of loss. Past performance of the backtest function is not indicative of future results. You may lose all of your invested capital.
Anonycryptous accepts no responsibility or liability for any losses incurred as a result of using this indicator or any content in this manual.
Indicator

Divergence Stack Scanner [AGPro Series]Divergence Stack Scanner
🔹 Overview
Divergence Stack Scanner scans five independent momentum and volume oscillators simultaneously — RSI, MACD Histogram, CCI, MFI, and OBV — and grades every confirmed pivot by how many of them show regular divergence at the same time. The result is a 0 to 5 STACK score that isolates rare, high-conviction reversal zones which single-divergence tools simply cannot surface.
Most divergence indicators track one oscillator at a time. Strong reversals, however, tend to leave fingerprints across momentum and volume at once. This tool quantifies that confluence in a single, objective number you can act on.
🔸 Unique Edge
What separates this script from the crowded divergence space:
1. Five-oscillator confluence in one engine — not one divergence, five divergences graded together.
2. Strict versus Window classification — a 5/5 STRICT stack (all five on the exact same pivot) is marked with a star flash, while a 5/5 WINDOW stack (all five within a small bar tolerance) is tagged separately. The distinction matters because strict stacks are statistically rarer and sharper.
3. Pressure Zones — a rectangular, SR-style zone is drawn forward from each qualifying pivot, so the reversal level stays visible long after the signal fires.
4. Rolling win-rate panel — the last N decided signals are evaluated N bars forward, and the win percentage is displayed live on the panel.
5. Per-oscillator live state — you see at a glance which oscillators are already in divergence and how long ago they triggered.
🔹 Methodology
Pivots are detected using the standard TradingView pivot method with a configurable lookback (default 5 bars each side, confirmed, non-repainting).
When a pivot is confirmed, the script compares the current pivot price and oscillator value to the previous same-direction pivot:
- Regular bullish divergence: price prints a lower low while the oscillator prints a higher low.
- Regular bearish divergence: price prints a higher high while the oscillator prints a lower high.
This comparison runs independently for RSI, MACD Histogram, CCI, MFI, and OBV. Each oscillator stores the bar index of its most recent divergence. The stack engine then counts how many oscillators have fired within a tolerance window of the current pivot:
- Strict stack (window = 0): all counted oscillators fired on the exact same pivot bar.
- Window stack (window = 1 to N bars): oscillators fired within N bars of each other.
Pressure zones are drawn only when the stack meets a configurable minimum (default 4/5). Zone height is ATR-scaled so it stays proportional across instruments and timeframes. A proximity filter prevents label clutter: once a label is drawn in a given direction, a new label in the same direction within a short window is only drawn if its stack level is strictly higher.
🔸 Signals & Alerts
On-chart signals:
- ★ N/5 STACK label (filled color) — strict same-bar stack at level N.
- N/5 NEAR label (lighter color) — window stack (near-miss of strict).
- Pressure zone rectangle — drawn forward from the pivot for qualifying stacks.
Alerts available:
- 5/5 Strict Stack (bull and bear, separate) — the rarest and sharpest signal.
- Minimum Stack threshold — fires whenever the stack reaches your configured minimum level.
All alerts use alert.freq_once_per_bar_close and include ticker plus timeframe in the message.
🔹 Key Inputs
Core Engine:
- Pivot Lookback — bars each side to confirm a pivot (default 5).
- RSI, MACD, CCI, MFI lengths — standard defaults, all configurable.
Stack Configuration:
- Minimum Stack Level — display threshold (default 3/5).
- Window Tolerance — bar tolerance for near-stacks (default 3).
- Win-Rate Lookback — number of recent signals used for rolling win rate (default 20).
- Win Evaluation Bars — forward bars to decide win or loss (default 10).
Pressure Zones:
- Minimum Stack for Zone (default 4/5) — keeps the chart premium and uncluttered.
- Zone Extend and Height (ATR%) — tune the visual footprint to your taste.
- Max Active Zones — oldest zones are automatically trimmed.
Panel and Theme:
- Location (6 anchors), Dark or Light theme, font size presets.
- Fully brand-consistent AGPro color palette built in.
🔸 How to Use
- Treat 5/5 STRICT stacks as the headline signal. They are rare by construction and typically appear at genuine inflection points.
- Use 4/5 stacks as early-warning context around support, resistance, or higher-timeframe levels.
- Read the per-oscillator live state on the panel. When RSI, MACD, CCI, MFI are all in the same direction and OBV is the last holdout, a full stack is often imminent.
- Pressure zones work well as re-entry or invalidation levels after the initial signal fires.
- The rolling win rate is a sanity check for the current asset and timeframe — if it degrades meaningfully, raise the minimum stack level or widen the pivot lookback.
🔹 Limitations and Transparency
- This is a confluence tool, not a standalone trading system. Divergence by nature can persist in strong trends before any reversal.
- The engine is pivot-based and therefore delayed by the pivot lookback. Labels appear on the bar the pivot is confirmed, not on the pivot itself.
- Win rate is computed on the last N decided signals on the current chart. It is not a backtest, it is an evolving statistic and it does not include slippage, spread, or position sizing.
- Window stacks are lower-confidence than strict stacks by design. The visual distinction is intentional.
- Session-based "Today's Max" uses calendar-day rollover.
🔸 Risk Disclosure
This indicator is a technical analysis tool for research and education. It is not financial advice, not a signal service, and not a trading strategy. Past patterns do not guarantee future behavior. You are solely responsible for your trading decisions, risk management, and position sizing. Always combine any indicator with independent analysis, higher-timeframe context, and strict risk controls.
🔹 Technical Notes
- Pine Script v6, overlay indicator.
- Fully non-repainting. All divergences are evaluated only on confirmed pivots.
- Drawing objects (labels, boxes) are capped to avoid resource overruns.
- MPL 2.0 licensed — open source. Indicator

Indicator