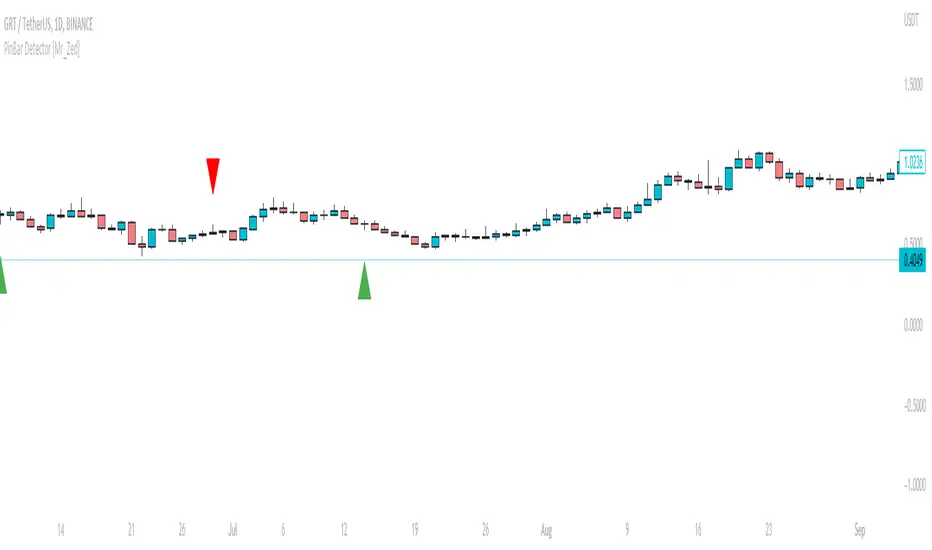
Alpha S/R Channel StrategyAlpha S/R Channel Strategy (ASRC)
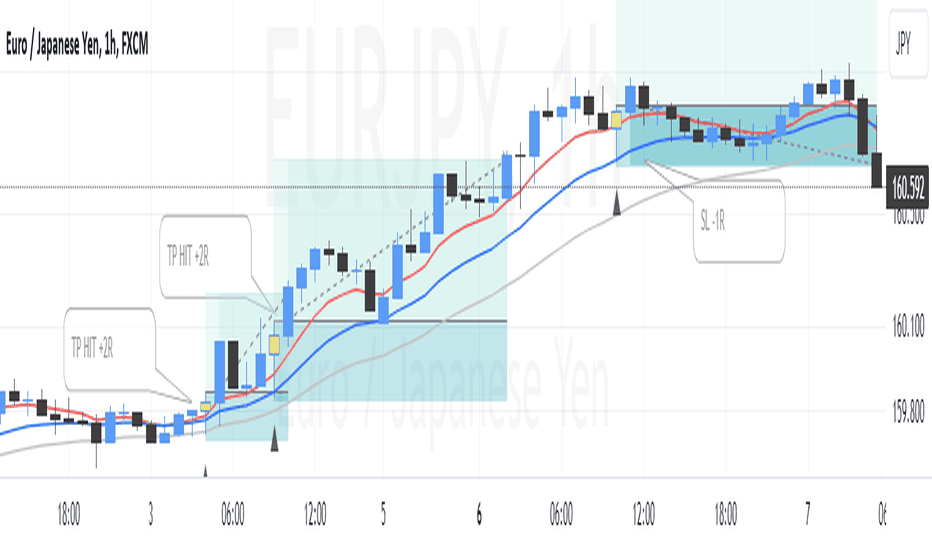
Mean-reversion strategy trading pullbacks to a dynamic Higher Timeframe EMA channel. Confirms exhaustion via Engulfing & Pin Bar patterns, with Pin+Engulf combo overriding trend filters to capture institutional liquidity grabs. Features optional RSI, BB width, and inverted Squeeze Momentum filters. Includes adaptive position sizing, partial TP, breakeven stops, session trade limits, no-trade windows, day/weekend close, and Friday trading control.
📌 Strategy Overview
Alpha S/R Channel Strategy is a dual‑timeframe mean‑reversion strategy that identifies high‑probability reversal setups by combining a dynamic channel derived from a Higher Timeframe EMA with high‑conviction candlestick patterns (Engulfing and Pin Bar).
The strategy waits for price to retrace to a dynamic value area (the channel) and confirms exhaustion through candlestick patterns before entering—capturing pullbacks within the prevailing trend while avoiding counter‑trend trades.
🧠 Unique Edge – Why This Mashup Works
Most trend‑following strategies chase breakouts and get caught in false moves. Most engulfing strategies ignore the bigger picture and enter too early. This strategy solves both problems by combining these components in a specific sequence:
1. Dynamic EMA Channel (The Value Area)
Instead of using static support/resistance, the strategy constructs a dynamic channel around a Higher Timeframe EMA. The channel width adapts to volatility using three modes:
- Percentage – width as % of current price.(price * (channelWidthPct / 100) )
- ATR Multiplier – width based on ATR from the Higher Timeframe.
- Fixed – static price distance.
Why this matters: The HTF EMA represents the "fair value" or equilibrium price. When price pulls back to this zone, it's statistically more likely to resume the trend rather than reverse.
-------------------------------------------------------------------
2. Channel Break + Candlestick Confirmation (The Trigger)
The strategy enters only when price returns to the channel AND shows exhaustion:
- Bullish Engulfing – Current green candle engulfs previous red/small green candle
- Bearish Engulfing – Current red candle engulfs previous green/small red candle
- Pin Bar + Engulfing Combo – Pin bar sweeps recent high/low and is followed by an engulfing pattern
Why this matters: The channel provides the context (where price should reverse). The candlestick patterns provide the confirmation (that reversal is actually happening). Using both drastically reduces false signals.
-------------------------------------------------------------------
3. Optional Multi‑Layer Filters (The Quality Control)
The strategy includes configurable filters that can be enabled/disabled:
1- EMA Lower TF – Ensures micro‑trend alignment (longs above EMA, shorts below)
However, there is a critical override:
🔄 Pin Bar + Engulfing Combo OVERRIDES the EMA Confirmation
When a Pin Bar sweeps the N‑bar high/low (proving a breakout attempt failed) and is immediately followed by an Engulfing pattern on the next candle, this combo represents a "double confirmation" of exhaustion that bypasses the EMA filter.
Why this is a breakthrough:
Strong institutional reversals (liquidity grabs) often happen against the short‑term EMA trend. A pure trend‑following strategy with a strict EMA filter would miss these reversals because price is moving against the EMA.
2- Higher Timeframe EMA – Ensures long‑term trend alignment
This acts as a "trend filter on top of the trend filter" – preventing entries that go against the even larger market structure. Users can select a separate timeframe (e.g., 1H) with its own EMA length for additional confirmation.
3- RSI – Prevents buying above 70 and selling below 30
4- Bollinger Bands – Blocks entries during low volatility (sideways markets)
5- Squeeze Momentum – This strategy uses an inverted Squeeze Momentum logic:
"val < 0 → Longs allowed, Shorts blocked"
"val > 0 → Shorts allowed, Longs blocked"
"val == 0 → Both allowed"
This inversion is intentional. The strategy is mean‑reversion based—it waits for momentum to become overextended and then trades against that momentum
These filters are optional because different assets and market conditions require different levels of confirmation. The user has full control.
-------------------------------------------------------------------
4. Comprehensive Risk Management
The strategy includes:
- Position Sizing – Fixed percentage of equity per trade (separate for first and second entry)
- Pyramiding – Allows up to 2 positions in the same direction (second trade uses lower risk)
- Multiple SL Options – Low-High, Swing high/low, Channel, Fixed distance
- Trade Counter Reset – Resets at session starts for scalping timeframes, daily for swing
- No‑Trade Windows – Blocks entries during end‑of‑day volatility (active only for TF ≤ 15m)
- Day/Week End Closing – Closes positions before gaps (configurable by timeframe)
- Partial Take Profit – Closes a configurable percentage (default: 50%) at a specified R:R ratio (default: 1:2), allowing the remainder to run to the full target (default: 1:3)
- Breakeven Stop – Optionally moves the stop loss to breakeven when the first TP level is reached, protecting the remaining position from turning into a loss
Why this matters: The risk controls ensure survivability across different market conditions. Also Breakeven protection reduces the risk of winning trades turning into losers.
-------------------------------------------------------------------
📊 How It Works
1. Dynamic Channel Calculation
The strategy constructs a channel around an Exponential Moving Average (EMA) from a selected Higher Timeframe:
- EMA – Calculated on the Higher Timeframe
- Channel Width – Adaptive based on volatility (Percentage, ATR, or Fixed)
- Upper Band = EMA + (Width / 2)
- Lower Band = EMA - (Width / 2)
Channel Width Modes:
- Percentage – Width = Price × (User‑defined %)
- ATR Multiplier – Width = ATR(14) × Multiplier
- Fixed – Width = Static distance
-------------------------------------------------------------------
2. Entry Signal Detection
Trades are executed on the Lower Timeframe (default: 5m) when all conditions are met:
Pattern Requirements (One of the following):
- Bullish Engulfing: Current green candle completely engulfs previous bearish or small green candle
- Bearish Engulfing: Current red candle completely engulfs previous bullish or small red candle
- Pin Bar + Engulfing Combo: Pin bar sweeps recent high/low AND is followed by engulfing pattern (Overrides LTF EMA)
# Engulfing Filters:
Body Only – Only bodies must engulf (not full range)
Min/Max Range – Configurable via Percentage, ATR, or Fixed
Gap Allowance – Controls how much gap is allowed in the wrong direction
Previous Range % – Limits the size of the prior candle when it's in the same color
# Pin Bar Detection:
- Wick/Body Ratio (default: 3.0) – Wick must be 3× larger than body
- Max Body/Range (default: 0.20) – Body must be ≤20% of total range
- Min Wick/Range (default: 0.70) – Wick must be ≥70% of total range
- Sweep Lookback (default: 10 bars) – Pin bar must sweep a recent high/low
Min Pin Bar Range % – Pin bar must meet a minimum size threshold
# Channel Proximity:
Price must be within the channel boundaries (open inside)
-------------------------------------------------------------------
3. Confirmation Filters (All Optional)
- Lower Timeframe EMA : Longs require price > EMA; Shorts require price < EMA (overridden by Pin+Engulf combo)
- Higher Timeframe EMA : Ensures long‑term trend alignment (longs above HTF EMA, shorts below)
- RSI : Prevents longs above 70; Prevents shorts below 30
- Bollinger Bands : Blocks entries when BB width < threshold (low volatility)
- Squeeze Momentum : Ensures momentum matches trade direction (inverted logic)
-------------------------------------------------------------------
4. Risk & Position Management
# Position Sizing:
- First Trade – Fixed % of equity (default: 2%)
- Second Trade – Separate % of equity (default: 1%)
- Position size = (Account Risk) / (Entry – SL Distance)
# Friday Trading:
- Allow Friday Trading (default: Disabled) – When disabled, no new trades will be opened on Fridays. Existing positions are not affected. This helps avoid weekend gap risk as markets close for the week.
# Stop‑Loss Options:
1- Low-High : Entry bar low/high ± buffer
2- Swing high/low : N-bar low/high ± buffer
3- Channel : Channel band ± buffer
4- Fixed distance : Fixed price distance from entry
# Take Profit:
- Main R:R ratio (default: 1:3)
- Separate R:R for second trade (default: 1:3)
# Trade Counter Reset:
TF ≤ 15m – Resets at Asia (20:00 NY), London (03:30 NY), New York (09:30 NY)
TF > 15m – Resets once per day at session start
# No‑Trade Window:
- Active only for TF ≤ 15m (16:45–19:05 NY time)
- Protects against end‑of‑day volatility spikes
# Close All Positions:
- TF ≤ 15m – Can close at day end and/or week end (configurable)
- 15m < TF ≤ 240m – Week end only
- TF > 240m – Feature disabled
# Entry Spacing:
- Minimum Bars Between Entries (default: 4) – Prevents multiple entries on the same bar or too close together, reducing the impact of whipsaw on tightly clustered signals
⚙️ Default Settings – Optimized for XAUUSD (Gold)
All default values have been specifically calibrated for Gold's typical volatility and intraday structure.
Setting \ Default \ Why This Works for Gold
-----------------------------------------------------------------------------------
Higher Timeframe \ 15m \ Gold's intraday rhythm operates on 15‑minute cycles. This timeframe captures the balance between institutional order flow and retail noise.
-----------------------------------------------------------------------------------
EMA Length \ 36 \ approximately one full trading session. This captures the dominant intraday trend without excessive lag.
-----------------------------------------------------------------------------------
Channel Width Mode \ Percentage \ Gold's price levels change over time. Percentage mode ensures the channel scales with price, maintaining consistent relative width regardless of Gold's price level.
-----------------------------------------------------------------------------------
Channel Width \ 0.35% \ Gold's daily range averages $30–$100. At current prices, 0.35% = approximately $113–$16. This width captures ~70% of Gold's daily volatility, creating a meaningful "value zone" that filters noise while remaining relevant.
-----------------------------------------------------------------------------------
Lower Timeframe \ 5m \ Fast enough to capture entry signals within the same session, slow enough to filter out micro‑noise. 5m is Gold's "sweet spot" for intraday entries.
-----------------------------------------------------------------------------------
Engulfing Mode \ Percentage \ Adapts to Gold's volatility. As Gold's price moves, the required engulfing range scales proportionally—ensuring consistent pattern quality.
-----------------------------------------------------------------------------------
Engulfing Min Range \ 0.098% \ At Gold's current price3000-5000, this ≈ $3.0–$5.0. Anything smaller is just market noise, not a meaningful reversal signal.
-----------------------------------------------------------------------------------
Engulfing Max Range \ 0.550% \ At Gold's current price, this ≈ $20–$25. Larger candles are often blow‑off spikes driven by news —they tend to reverse violently, making them poor entry points.
-----------------------------------------------------------------------------------
Previous Range % \ 0.60 \ Allows the prior candle to be up to 60% of the engulfing candle's range. This is Gold's "consolidation before reversal" pattern—a small same‑color candle before a large reversal candle.
-----------------------------------------------------------------------------------
Gap Allowance \ 250 ticks \ Gold's typical spread and gap behavior. (250 ticks = $0.250 However, tick values vary between brokers), which accommodates normal gaps without allowing extreme invalid gaps.
-----------------------------------------------------------------------------------
Pin Bar Sweep \ 10 bars \ On a 5m chart, 10 bars = 50 minutes. Gold's liquidity grabs often occur within a 30–60 minute window. 10 bars captures these recent liquidity zones without looking too far back.
-----------------------------------------------------------------------------------
Pin Bar Range % \ 0.70 \ Requires the pin bar(high-low) to be at least 70% of the minimum engulfing range. This ensures the pin bar has enough size to be meaningful—rejecting tiny pin bars that lack conviction.
-----------------------------------------------------------------------------------
Risk per Trade (1st) \ 2% \ Gold experiences 3–5 trade losing streaks regularly. 2% risk ensures that a typical losing streak results in only 6–10% drawdown—recoverable with a few winning trades.
-----------------------------------------------------------------------------------
Risk per Trade (2nd) \ 1% \ When pyramiding, total exposure increases. 1% on the second trade limits worst‑case loss to -3% total (2% + 1%), protecting the account during false reversals.
-----------------------------------------------------------------------------------
Risk:Reward \ 1:3 \ Gold routinely moves 1.5–2× its ATR in a single directional push. A 1:3 target (e.g., $15 on a $5 stop) is well within Gold's typical daily range—achievable without being overly ambitious.
-----------------------------------------------------------------------------------
Stop‑Loss Reference \ Channel \ Aligns the stop with the value area. If price breaks beyond the channel, the mean‑reversion thesis is invalidated. This is the most logical stop placement for this strategy.
-----------------------------------------------------------------------------------
Stop‑Loss Buffer \ 500 ticks \ 500 ticks = ($0.50 ) on Gold. However, tick values vary between brokers so The table on chart will display and show the calculated dollar value. This provides a safety buffer against spread, slippage, and normal wicks—preventing premature stops while keeping the stop within the value area.
-----------------------------------------------------------------------------------
Partial TP & Breakeven \ Disabled (50%, 1:2) \ Optional features that allow locking in partial profits and protecting positions once they move in your favor. Recommended to enable after forward testing.
-----------------------------------------------------------------------------------
No‑Trade Window \ Enabled \ 16:45–19:05 NY time captures the end‑of‑day volatility spike. Gold often experiences erratic moves during this period as institutional traders close positions.
-----------------------------------------------------------------------------------
Day End Close \ Enabled \ Gold gaps frequently at the daily open (5:00 PM NY). Closing before day end avoids these gaps, which can easily stop out tight positions.
-----------------------------------------------------------------------------------
Week End Close \ Enabled \ Gold is highly sensitive to weekend news (geopolitics, central banks). Gaps of $20–$50+ are common at Sunday open. Closing before Friday close is essential.
-----------------------------------------------------------------------------------
EMA Lower TF \ Enabled \ Ensures entries align with the 5m micro‑trend. However, the Pin+Engulf combo overrides this filter to capture institutional reversals against the trend.
-----------------------------------------------------------------------------------
Higher TF EMA \ Enabled (1H, 55) \ Provides an additional layer of trend confirmation at the macro level. The 1H 55‑EMA acts as a reliable gauge of the broader intraday trend, preventing entries against strong momentum.
-----------------------------------------------------------------------------------
RSI \ Enabled length(14) \ Prevents buying when Gold is overbought (RSI > 70) and selling when oversold (RSI < 30). Gold's sharp spikes often create extreme RSI readings—this filter avoids chasing exhausted moves.
-----------------------------------------------------------------------------------
Bollinger Bands \ Enabled \ locks entries during low volatility (BB width < 0.002). Gold sometimes enters tight consolidation ranges (BB width < 0.002) where engulfing patterns fail. This filter avoids trading in these conditions.
-----------------------------------------------------------------------------------
Squeeze Momentum \ Enabled \ This is inverted from standard SQZMOM. Gold's momentum often overshoots before reversing. By fading the extreme (longs when val < 0, shorts when val > 0), the strategy captures the reversal rather than chasing the continuation.
-----------------------------------------------------------------------------------
# Important Notes on Backtest Realism
- Commission – Most ECN/raw-spread brokers charge $3.00–$3.50 per side (round-turn commission of $6.00- $7.00) for 1 standard lot (100 oz) of XAUUSD. Standard accounts usually build the fee into a wider spread instead of charging a separate cash. This strategy deducts $3.50 per entry and $3.50 per exit ($0.035 × 100 oz)round-turn commission of $7.00. Adjust this to match your broker's exact fees.
- 4 ticks Slippage – For XAUUSD on OANDA, 1 tick = $0.001** per ounce (3 decimal places). 4 ticks = **$0.004 per ounce. Adjust this value if your broker quotes XAUUSD with different decimal precision (e.g., 2 decimal = $0.01 per tick).
Always adjust the commission value to your broker's exact fee structure before relying on the results.
"A backtest without realistic commission and slippage is a fantasy. A backtest with realistic commission and slippage is a truthful reflection of what you can expect when trading live."
-------------------------------------------------------------------
📊 Chart Display
Channel – Upper/Lower bands with a semi‑transparent fill (red zone), representing the value area
EMA Lower TF – Green EMA on the lower timeframe for confirmation
HTF EMA Filter – Red EMA line showing the additional trend filter (plotted on all timeframes ≤ its TF)
Info Table – Shows Market Status, EMA confirmations, Channel Width, Engulfing ranges, SL settings,
Filters, No‑Trade Window status, Session Close status
Signal Arrows – Green arrow pointing up (below bar) for Long entries, Red arrow pointing down (above bar) for Short entries
Historical Trades – Configurable number of past trades to display on the chart (default: 111, max: 125). Adjust this to optimize chart performance while keeping sufficient trade history for visual analysis.
Reset Signal – Arrow marker (grey) indicating when the trade counter resets at session starts (Asia, London, New York for TF ≤ 15m, or daily for larger TFs)
Background Colors – red for No‑Trade Window, Gray/White for Session Close
UI Note
# When you adjust any setting in the Inputs tab (Channel Width, Engulfing Min/Max, Previous Range, SL Buffer, etc.), the values displayed in the info table update automatically in real‑time.
This allows you to:
- See the impact of your changes immediately
- Verify the actual dollar values of your settings at current price levels
- Fine‑tune parameters without switching between tabs
Example: If you change the Channel Width from 0.35% to 0.50%, the info table will instantly show the new width in dollars (e.g., $8.50 → $12.00).
# Inputs are hidden from the status line to keep the chart clean. All settings (zones, EMAs, risk, patterns) remain fully adjustable in Settings → Inputs tab.
-------------------------------------------------------------------
📌 In Summary:
This is not a random collection of indicators.
- The HTF EMA Channel provides the structural context – a dynamic value area that adapts to volatility.
- The Engulfing/Pin Bar patterns provide the high‑conviction trigger – exhaustion confirmation.
- The EMA Override provides the institutional edge – capturing liquidity grabs that standard EMA‑based strategies miss.
- The Optional Filters provide the quality control – reducing false signals.
- The Risk Management provides the survivability – realistic position sizing and stops.
Each component exists specifically to compensate for a flaw in the others. This interdependency is what makes the strategy original, robust,
Author: Awab_Hassan
Strategy

Fake Pin Bar & Engulfing Pattern DetectorFake Pin Bar & Engulfing Pattern Detector
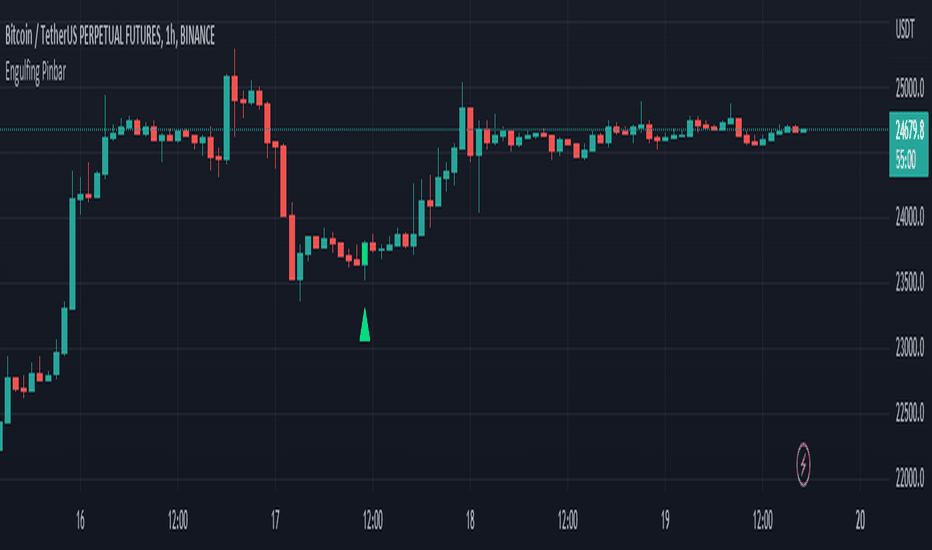
This indicator is designed to detect Fake Pin Bar structures and standard Engulfing candle patterns directly on the chart.
A Fake Pin Bar is a price action pattern that appears after price forms a Mother Bar, then one or more Inside Bars, and finally produces a false breakout candle. The signal candle briefly breaks outside the Mother Bar range, but then returns back inside the structure. If that breakout candle also has a strong rejection wick and a relatively small body, the indicator marks it as a Fake Pin Bar.
The idea behind this pattern is simple: price attempts to break above or below a consolidation area, fails to continue, and closes back inside the previous range. This can show rejection, trapped breakout traders, or a possible reversal area.
How The Indicator Works
The script looks for three main components:
1. Mother Bar
A candle that defines the main high and low range.
2. Inside Bar Sequence
One or more candles after the Mother Bar that remain inside the Mother Bar range.
3. False Breakout Pin Bar
The signal candle must break only one side of the Mother Bar range and then return back inside it. For a bearish signal, price breaks above the Mother Bar high and rejects downward. For a bullish signal, price breaks below the Mother Bar low and rejects upward.
The indicator also detects standard bullish and bearish Engulfing patterns. An engulfing pattern is detected when the current candle body fully engulfs the previous candle body in the opposite direction.
Best Use Cases
This indicator is best used as a price action confirmation tool, not as a standalone trading system.
It can be useful around:
- Support and resistance areas
- Supply and demand zones
- Previous session highs and lows
- Liquidity sweep areas
- Consolidation breakouts
- Higher timeframe key levels
- Trend pullbacks
- Range boundaries
Fake Pin Bars are generally more meaningful when they appear at important market levels instead of random areas in the middle of a chart.
Settings
Minimum Wick Ratio
Controls how large the rejection wick must be compared to the full candle range. A higher value requires a stronger wick and produces fewer signals.
Maximum Body Ratio
Controls the maximum allowed candle body size compared to the full candle range. A lower value requires a smaller body and makes the pin bar condition stricter.
Maximum Inside Bar Count
Defines how many Inside Bars the script can look for after the Mother Bar. A higher value allows the indicator to detect longer consolidation structures.
Confirm Signals After Bar Close
When enabled, signals are confirmed only after the candle closes. This helps avoid signals changing during the live candle.
Require Body Inside Mother Bar
When enabled, the signal candle body must return fully inside the Mother Bar range. This makes Fake Pin Bar detection stricter.
Show Engulfing Candles
Turns standard bullish and bearish Engulfing candle detection on or off.
Show Pattern Details
Shows or hides the Mother Bar pattern box and high/low guide lines.
Label Text Size
Changes the size of the Fake Pin Bar signal labels.
Inside Bar Area Opacity
Controls the opacity of the pattern area shown on the chart.
Bullish Candle Color
Sets the color used for bullish Engulfing candles.
Bearish Candle Color
Sets the color used for bearish Engulfing candles.
Important Notes
This indicator does not place trades, does not calculate stop loss or take profit levels, and does not provide financial advice.
Signals should be combined with market structure, trend direction, volume, support/resistance, and proper risk management.
No price action pattern is perfect. Fake breakouts and engulfing candles can fail, especially in low-volume or choppy market conditions. Indicator

Indicator
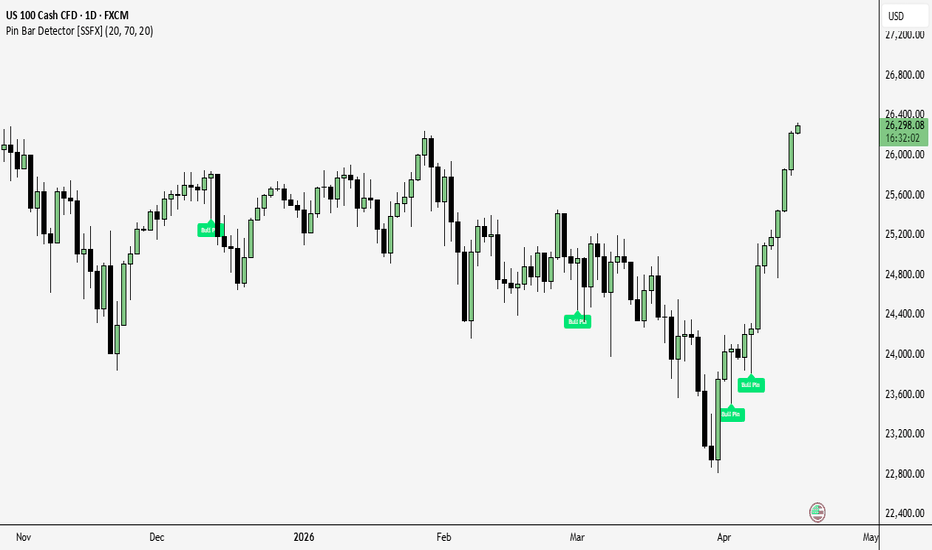
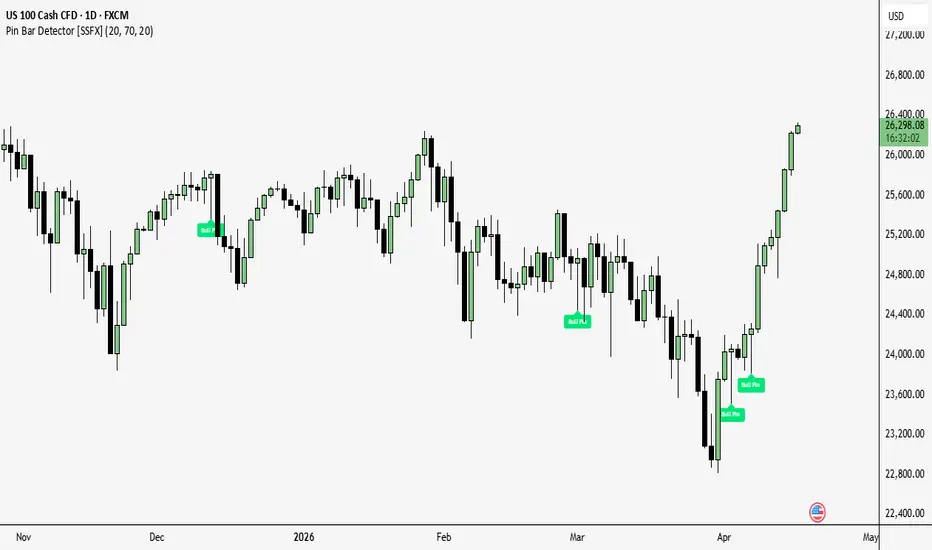
AG Pro Pin Bar Quality Filter [AGPro Series]AG Pro Pin Bar Quality Filter
Overview / What it does
AG Pro Pin Bar Quality Filter is a price-action overlay built to detect pin bar candles and then separate higher-quality rejection candles from weaker or noisier ones.
The script does not treat every long-wick candle as equally meaningful. Instead, it evaluates the internal candle structure first, then applies a compact quality framework around volume, recent momentum, and local support/resistance context. The result is a filtered pin bar workflow designed for traders who want cleaner chart annotation rather than a raw pattern dump.
This tool focuses on one specific job: identifying rejection candles with a measurable structure and presenting them with a readable quality label directly on the chart. It is intended to help users inspect potential reaction points, not to replace broader market context or execution rules.
The visual design is intentionally simple at the core: pin bar body highlighting, wick emphasis, directional markers, and compact quality labels. This makes the script suitable for traders who want candle-based context without converting the chart into a full market-structure dashboard.
Unique Edge
The distinctive feature of this script is that it does not stop at pattern detection.
A standard pin bar script often marks candles only because they have a long wick. This script goes further by checking whether the wick is large enough relative to the body, whether the body itself is small enough relative to the full candle range, and whether one wick clearly dominates the other. That combination helps reduce ambiguous candles that visually resemble pin bars but do not express clean rejection.
After the structural test, the script applies a three-part quality model:
- volume confirmation
- momentum context
- support/resistance proximity
This creates a practical quality hierarchy rather than a binary pattern label. In other words, the script is not only asking “Is this a pin bar?” but also “How much contextual support does this pin bar have?”
An optional piercing check is also available for users who want stricter validation. This adds another layer of selectivity by requiring the candle body to show stronger positional behavior relative to the prior bar.
Methodology
The script starts by measuring the current candle:
- candle body size
- full candle range
- upper wick length
- lower wick length
- dominant wick versus body ratio
A raw pin bar candidate requires:
- a minimum wick/body ratio
- a maximum body percentage of full range
- directional wick dominance
This helps define whether the candle is a legitimate bullish or bearish rejection structure.
Bullish pin logic is based on lower-wick dominance.
Bearish pin logic is based on upper-wick dominance.
Once a raw pin bar is detected, the script evaluates three contextual filters.
1) Volume filter
The current volume can be compared against a moving average of volume. This helps identify candles that form with relatively stronger participation.
2) Momentum confirmation
The script can check whether recent candles were moving in the opposite direction of the current pin bar. For example, a bullish pin bar becomes more meaningful when it forms after short-term downward pressure, while a bearish pin bar becomes more meaningful after short-term upward pressure.
3) Support / resistance proximity
The script tracks pivot-based reference levels and checks whether the pin bar forms close to a recent local support or resistance area, using an ATR-based distance threshold.
Each passed filter contributes to the final quality score. This produces a compact tiered output instead of a single undifferentiated signal stream.
Signals & Alerts
The script can identify:
- bullish pin bars
- bearish pin bars
- higher-quality pin bars based on the selected minimum score
Visual elements may include:
- body highlighting on detected pin bars
- wick emphasis
- directional arrow markers
- quality labels with contextual details
- an information panel summarizing the active state
The quality label can display the signal tier and relevant confirmations such as:
- wick/body ratio
- volume confirmation
- momentum confirmation
- support/resistance proximity
Alert conditions are available for:
- bullish pin bars
- bearish pin bars
- prime-quality pin bars
- any valid pin bar that meets the selected score threshold
This allows users to align alerts with their own strictness settings rather than monitoring every possible candle manually.
Key Inputs
Important user controls include:
- minimum wick/body ratio
- maximum body percentage of full range
- wick dominance threshold
- optional piercing requirement
- volume filter enable/disable
- momentum filter enable/disable
- support/resistance filter enable/disable
- minimum quality score
- label size
- panel display
- maximum number of displayed signals
These settings make the script adaptable across different instruments and chart styles. Users who prefer a broader scan can lower the strictness, while users who want fewer but cleaner signals can raise the thresholds.
Limitations & Transparency
This script is a rule-based candle-quality filter. It is not a market prediction engine, and it does not attempt to classify broader trend structure, liquidity behavior, or macro regime by itself.
A pin bar can still fail even when all filters pass. A visually strong rejection candle is not automatically a durable reversal. Context such as higher-timeframe structure, trend state, volatility regime, session behavior, and instrument-specific character still matters.
Support and resistance detection in this script is pivot-based and proximity-based. It is designed as a practical contextual filter, not as a complete structural mapping model.
Volume behavior also varies by asset and market type. On some instruments, especially where centralized volume data is limited or interpreted differently, the volume filter should be treated as a supplementary input rather than a universal truth test.
The momentum check is intentionally compact and local. It is meant to improve candle context, not to replace broader directional analysis.
For these reasons, the script is best used as a chart-reading assistant within a larger process, not as a standalone decision framework.
Risk Disclosure
This script is provided for technical analysis and chart annotation purposes only.
It highlights selected pin bar conditions based on user-defined structural and contextual rules. It does not provide financial advice, investment advice, or guaranteed trade outcomes. Markets can remain irrational, trend continuation can invalidate rejection candles, and false positives can occur in all timeframes and asset classes.
Users should validate the script on their own instruments, timeframes, and risk models before relying on it in live conditions. Position sizing, stop placement, execution discipline, and overall trade management remain the responsibility of the user.
In summary, AG Pro Pin Bar Quality Filter is designed to help traders study rejection candles with more structure, more selectivity, and cleaner on-chart presentation than a basic pin bar marker, while remaining transparent about what the script does and does not do.
Indicator

Strong Pinbar Reversals MTF | ProjectSyndicateStrong Pinbar Reversals MTF automatically identifies and power-ranks high-probability reversal opportunities by analyzing clusters of institutional pinbar rejections. It filters for quality, calculates a 0-10 strength score for every reversal cluster based on wick purity, cluster density, and candle momentum, and presents all data on the chart and in a comprehensive multi-timeframe dashboard to eliminate noise and focus on reversals that matter.
• 🎯 Power-Ranking System (0-10) — every pinbar cluster is given a strength score based on a strict 5-dimensional algorithm that assesses cluster size, average wick purity, minimum wick purity, candle range versus ATR, and time density, providing an instant quality assessment.
• 🎨 Strength-Based Color Scheme — reversal zones are colored by their power rank; stronger clusters get darker, more prominent colors for immediate visual hierarchy.
• 🧠 Smart Context Detection — automatically ensures that bullish pinbar clusters only fire at local price lows (support) and bearish clusters only fire at local price highs (resistance), completely filtering out fake signals in mid-range consolidation.
• 📊 On-Chart Statistics — each reversal zone displays its direction (Bullish/Bearish) and its calculated strength score directly inside the shaded zone.
• 🧭 Full MTF Dashboard Display — provides a complete market overview across 7 timeframes (M1, M5, M15, M30, H1, H4, D1), showing the latest reversal signal, its strength, entry/SL/TP levels, and how many bars ago it occurred on that timeframe. The dashboard uses persistent state memory, meaning it is perfectly stable and consistent regardless of the chart you are viewing.
• 🔔 Comprehensive Alerts — get notified the moment a new high-strength cluster occurs, with the alert message containing the full details: direction, strength, entry, SL, and TP levels.
• ✅ Quality Control Filters — a user-configurable minimum strength score (default 6.0) allows you to filter out weak, low-probability wicks and focus only on institutional-grade reversal clusters.
• 🔧 Fully Customizable — control everything from the minimum wick percentage and cluster lookback window to the ADR multipliers for universal zone height and SL/TP placement.
• 🎯 Why this algo is unique: Standard pinbar indicators look at single candles and generate massive amounts of false signals in consolidation. This algorithm looks for clusters of rejection (e.g., 3+ pinbars in a tight window) and uses a multi-factor scoring system to quantify the quality of the rejection. It doesn't just show you a wick; it tells you how strong the institutional absorption is. The MTF dashboard provides a complete, stable cross-timeframe perspective that is impossible to achieve with standard single-timeframe indicators.
• 🚀 Apply to Gold (XAUUSD), Forex, Crypto, and Indices on any timeframe. The wick percentage and cluster size settings allow it to adapt to anything from scalping (M1/M5) to swing trading (H4/D1).
• 🎯 How to use this? Focus on trading opportunities from high-strength reversal clusters rated 7/10 or higher, as these show the highest probability of a structural shift. Use the dashboard to quickly identify which timeframes have active rejection zones, and look for alignment between lower timeframe clusters and higher timeframe support/resistance.
• ⚠️ IMPORTANT NOTICE: This indicator is designed to identify high-probability reversal opportunities based on price action rejection. It should NOT be used as a standalone signal for entering trades. Always use it in conjunction with your own trading strategy, market structure analysis, and other technical indicators to confirm trade setups and manage risk. Indicator

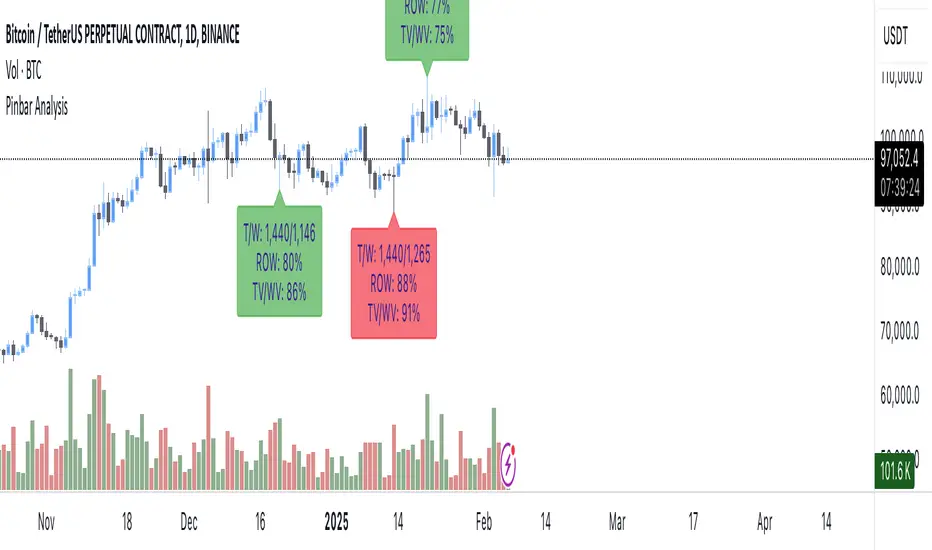
PinBar Finder by cryptokazancevEnglish description:
This script helps traders identify high-probability reversal points based on price action, specifically Pin Bars — a well-known candlestick pattern used in technical analysis.
What does the indicator do?
It detects bullish and bearish Pin Bars using a custom method for wick-to-body ratio and filters based on historical volatility (pseudo-ATR). A label appears on the chart with detailed info on wick and body size when a valid signal is found.
How does it work?
- The indicator calculates a pseudo-ATR based on the percentage range of the last 1000 candles.
- It then multiplies this value by a user-defined factor (default: 1.1) to set a dynamic threshold for wick size.
- Bullish Pin Bars are detected when the lower wick is at least 1.1 times the body and greater than the dynamic ATR.
- Bearish Pin Bars are detected when the upper wick meets similar conditions.
- Signals are shown using chart labels with exact wick/body percentages.
- Alerts are included for automation or integration with trading bots.
How to use it?
- Add the indicator to any timeframe and asset.
- Use the alerts to notify you when a Pin Bar appears.
- Ideal for traders who use candlestick reversal strategies or combine price action with other confluence tools.
- You can adjust the wick length multiplier to fit the volatility of the instrument.
What makes it original?
Unlike many public scripts that use fixed ratios, this script adapts wick length detection based on recent volatility (pseudo-ATR logic). This makes it more dynamic and suitable for different markets and timeframes.
Описание на русском:
Этот скрипт помогает трейдерам находить точки потенциального разворота на основе прайс-экшена, а именно — свечного паттерна «Пин-бар». Индикатор автоматически определяет бычьи и медвежьи пин-бары с учетом адаптивных параметров волатильности.
Что делает индикатор?
Скрипт ищет свечи, у которых тень в несколько раз превышает тело (пин-бары), и отображает на графике точную информацию о длине тела и тени. Это полезно для трейдеров, использующих свечные сигналы на разворот.
Как работает?
- Рассчитывается псевдо-ATR по 1000 последним свечам на основе процентного диапазона high-low.
- Этот ATR умножается на заданный множитель (по умолчанию: 1.1), чтобы динамически задать минимальную длину тени.
- Бычий пин-бар определяется, когда нижняя тень больше тела в 1.1 раза и превышает ATR.
- Медвежий пин-бар — аналогично, но для верхней тени.
- Индикатор отображает лейблы с точными значениями тела и тени.
- Реализованы условия для оповещений (alerts).
Как использовать?
- Добавьте индикатор на нужный график и таймфрейм.
- Настройте alerts, чтобы не пропустить сигналы.
- Особенно полезен для трейдеров, работающих со свечным анализом, стратегиями разворота, а также в сочетании с другими индикаторами.
В чем оригинальность?
В отличие от многих скриптов, использующих фиксированные параметры, здесь используется динамический расчет длины тени на основе волатильности. Это делает скрипт адаптивным к рынку и таймфрейму. Indicator
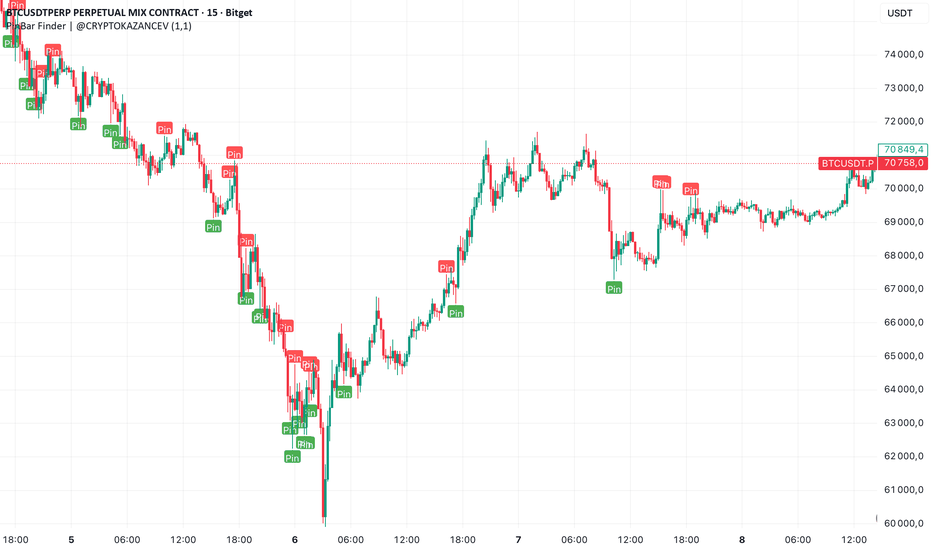
StO Price Action - Level ReactionShort-Summary
- Multi-timeframe reaction indicator for M5, M15, M30, H1, H4
- Monitors price interaction with higher timeframe levels (Daily, Weekly, H4)
- Detects whether price touches or breaks choosen levels
- Fully configurable colors, visibility and alerts per timeframe and level type
Full Description
Overview
- Tracks market reaction on significant levels across multiple timeframes
- Designed to identify intraday reactions to higher timeframe structure
- Supports both bullish and bearish reactions, with separate visual cues
- Alerts can be enabled to notify traders of touches or breaks
Core Logic
- Choice between detecting a touch or a break of the level
- Configurable reference level: Open, High or Low
- Lookback period can be set to target specific levels from previous candles
Timeframe Reactions
- Supported intraday reaction timeframes: M5, M15, M30, H1, H4, Daily, Weekly
- Each reaction type can be individually toggled for display
- Bullish and bearish reactions have separate color settings
- Alerts configurable per timeframe and reaction type
Alerting
- Alerts can be triggered for touches or breaks
- Supports separate alerts for each timeframe and each direction (bull/bear)
- Useful for real-time monitoring of key level interactions
Notes
- Intended as a market reaction tool not a standalone entry signal
- Helps traders confirm if price respects or violates higher timeframe levels Indicator

Indicator

Salman Indicator: Multi-Purpose Price ActionSalman Indicator: Multi-Purpose Price Action Tool for Pin Bars, Breakouts, and VWAP Anchoring
This indicator provides a comprehensive suite of price action insights, designed for active traders looking to identify key market structures and potential reversals. The script incorporates a Quarterly VWAP for trend bias, marks pin bars for possible reversal points, highlights outside bars for volatility signals, and indicates simple breakouts and pivot-level breaks. Customizable settings allow for flexibility in various trading styles, with default settings optimized for daily charts.
Outside Bars : Represented by an ⤬ symbol on the chart, these indicate bars where the current high is greater than the previous bar’s high, and the low is lower than the previous bar’s low, signaling high volatility and potential market reversals.
Pin Bars : Denoted by a small dot at the top or bottom of a candle’s wick, these are crucial signals of potential reversal areas. Pin bars are identified based on the percentage length of their shadows, with adjustable strictness in settings.
Quarterly VWAP : The light blue line on the chart represents the VWAP (Volume-Weighted Average Price), which is anchored to the Quarterly period by default. The VWAP acts as a directional bias filter, helping you to determine underlying market trends. This period, source, and offset are fully adjustable in the script’s settings.
Simple Breaks : Hollow candles on the chart indicate "simple breaks," defined when the current bar closes above the previous high or below the previous low. This is an effective way to highlight directional momentum in the market.
Bonus Pivot Breaks : The tilde symbol ~ appears when the price closes above or below prior pivot high/low levels, helping traders spot significant breakout or breakdown points relative to recent pivots.
Alerts
Simple Breaks : Alerts you when a breakout occurs beyond the previous bar’s high or low. Pin Bars : Notifies you of potential reversal points as indicated by bullish or bearish pin bars. Outside Bars : Triggers an alert whenever an outside bar is detected, indicating possible volatility changes.
How to Use
VWAP for Trend Bias : Use the Quarterly VWAP line to gauge overall market trend, with settings that allow adjustment to daily, weekly, monthly, or even larger time frames.
Pin Bars for Reversal Potential : Look for the dot markers on candle wicks, where the strictness of the pin bar detection can be adjusted via settings to match your trading preference.
Simple and Pivot Breaks for Momentum : Watch for hollow candles and the tilde symbol ~ as indicators of potential breakout momentum and pivot break levels, respectively.
This script can serve traders on multiple timeframes, from daily to weekly and beyond. The flexible configuration allows for adjustments in VWAP anchoring and pin bar criteria, providing a tailored fit for individual trading strategies. Indicator

Price Action StrategyThe **Price Action Strategy** is a tool designed to capture potential market reversals by utilizing classic reversal candlestick patterns such as Hammer, Shooting Star, Doji, and Pin Bar near dinamic support and resistance levels.
***Note to moderators
- The moving average was removed from the strategy because it was not suitable for the strategy and not participating in the entry or exit criteria.
- The moving average length has been replaced/renamed by the support/resistance lenght.
- The bullish engulfing and bearish engulfing patterns were also removed because in practice they were not working as entry criteria, since the candle price invariably closes far from the support/resistance level even considering the sensitivity range. There was no change in the backtest results after removing these patterns.
### Key Elements of the Strategy
1. Support and Resistance Levels
- Support and resistance are pivotal price levels where the asset has previously struggled to move lower (support) or higher (resistance). These levels act as psychological barriers where buying interest (at support) or selling interest (at resistance) often increases, potentially causing price reversals.
- In this strategy, support is calculated as the lowest low and resistance as the highest high over a 16-period length. When the price nears these levels, it indicates possible zones for a reversal, and the strategy looks for specific candlestick patterns to confirm an entry.
2. Candlestick Patterns
- This strategy uses classic reversal patterns, including:
- **Hammer**: Indicates a buy signal, suggesting rejection of lower prices.
- **Shooting Star**: Suggests a sell signal, showing rejection of higher prices.
- **Doji**: Reflects indecision and potential reversal.
- **Pin Bar**: Represents price rejection with a long shadow, often signaling a reversal.
By combining these reversal patterns with the proximity to dinamic support or resistance levels, the strategy aims to capture potential reversal movements.
3. Sensitivity Level
- The sensitivity parameter adjusts the acceptable range (Default 0.018 = 1.8%) around support and resistance levels within which reversal patterns can trigger trades (i.e. the closing price of the candle must occur within the specified range defined by the sensitivity parameter). A higher sensitivity value expands this range, potentially leading to less accurate signals, as it may allow for more false positives.
4. Entry Criteria
- **Buy (Long)**: A Hammer, Doji, or Pin Bar pattern near support.
- **Sell (Short)**: A Shooting Star, Doji, or Pin Bar near resistance.
5. Exit criteria
- Take profit = 9.5%
- Stop loss = 16%
6. No Repainting
- The Price Action Strategy is not subject to repainting.
7. Position Sizing by Equity and risk management
- This strategy has a default configuration to operate with 35% of the equity. The stop loss is set to 16% from the entry price. This way, the strategy is putting at risk about 16% of 35% of equity, that is, around 5.6% of equity for each trade. The percentage of equity and stop loss can be adjusted by the user according to their risk management.
8. Backtest results
- This strategy was subjected to deep backtest and operations in replay mode on **1000000MOGUSDT.P**, with the inclusion of transaction fees at 0.12% and slipagge of 5 ticks, and the past results have shown consistent profitability. Past results are no guarantee of future results. The strategy's backtest results may even be due to overfitting with past data.
9. Chart Visualization
- Support and resistance levels are displayed as green (support) and red (resistance) lines.
- Only the candlestick pattern that generated the entry signal to triger the trade is identified and labeled on the chart. During the operation, the occurrence of new Doji, Pin Bar, Hammer and Shooting Star patterns will not be demonstrated on the chart, since the exit criteria are based on percentage take profit and stop loss.
Doji:
Pin Bar and Doji
Shooting Star and Doji
Hammer
10. Default settings
Chart timeframe: 20 min
Moving average lenght: 16
Sensitivity: 0.018
Stop loss (%): 16
Take Profit (%): 9.5
BYBIT:1000000MOGUSDT.P Strategy

Indicator

Candlesticks Patterns [TradingFinder] Pin Bar Hammer Shooting🔵 Introduction
Truly, the title "TradingView" doesn't do justice to this excellent website, and that's why I've written about its crucial aspect. In this indicator, the identification of all candlesticks known as "Pin bars" is explored.
These candlesticks include the following:
- Hammer : A Pin bar formed at the end of a bearish trend, with its body being either bearish or bullish.
- Shooting Star : Formed at the end of a bullish trend, with its body being either bearish or bullish.
- Hanging Man : Formed during an upward trend, characterized by a candle with a lower shadow.
- Inverted Hammer : Formed during a downward trend, characterized by a candle with an upper shadow.
🟣 Important : For ease of use, we refer to these four candlestick patterns as Pin Bars and categorize them into the main friends "Bullish" and "Bearish."
🟣 Important : In all sources, Hanging Man and Inverted Hammer are referred to as "Reversal candles." However, in reality, whenever they appear after breaking a significant area (Break Out), we expect these candles to signal a continuation of the trend and confirmation in the direction of the trend.
🟣 Important : One of the best signs of market manipulation and entry by market giants is the "Ice Berg." So, it provides one of the best trading opportunities.
🔵 Reason for Creation
Many traders, especially volume traders, use Pin bars as confirmation and enter the market after their occurrence. In this indicator, all four patterns are identified and displayed in a colored candle format, using "triangle" and "circle."
When they are evident on the chart, directly or by drawing a horizontal line, they give us good alerts for reversal or continuation areas.
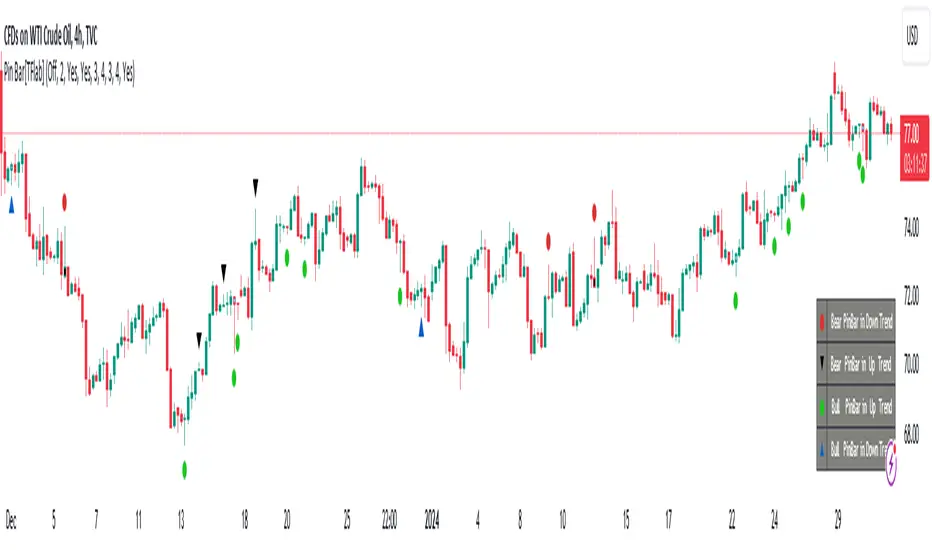
🔵 Information Table
1. Red circle: Pin bars formed in a downtrend.
2. Blue circle: Bullish Pin bars formed in an uptrend.
3. Black triangle: Bearish Pin bar candle in an uptrend.
4. Blue triangle: Bullish Pin bar candle in a downtrend.
🔵 Settings
Trend Detection Period: A special feature that considers smaller or larger fluctuations. If individual price waves need to be considered, use lower numbers; if the overall trend direction is desired, use larger numbers (e.g., 5-7 or higher). This precisely sets the Zigzag or Pivot format, not displayed but considered in the indicator calculation.
Trend Effect : By changing the Trend Effect status to "Off," all Pin bars, whether bullish or bearish, are displayed regardless of the current market trend. If the status remains "On," only Pin bars in the direction of the main market trend are shown.
🟣 Important : Black triangles "Number 3" and blue triangles "Number 4" displayed in the information table section, as explained in the "Information Table" section.
Show Bullish Pin Bar : When set to "Yes," displays bullish Pin bars; when set to "No," does not display them.
Show Bearish Pin Bar : When set to "Yes," allows the display of bearish Pin bars; when set to "No," does not display them.
Bullish Pin Bar Setting : Using the "Ratio Lower Shadow to Body" and "Ratio Lower Shadow to Higher Shadow" settings, you can customize your bullish Pin bar candles. Larger numbers impose stricter conditions for identifying bullish Pin bars.
Bearish Pin Bar Setting : Using the "Ratio Higher Shadow to Body" and "Ratio Higher Shadow to Lower Shadow" settings, you can customize your bearish Pin bar candles. Larger numbers impose stricter conditions for identifying bearish Pin bars.
Show Info Table : Allows the display or non-display of the information table (located at the bottom of the page and on the right side).
🔵 How to Use
At the end of a downtrend, look for "Hammer" candles, easily identified one by one.
To identify the "Shooting Star" candle pattern at the end of an uptrend; expect a price reversal in the downtrend.
For trades in the downward direction, wait for the formation of an "Inverted Hammer" Pin bar.
And finally, in an uptrend, where a "Hanging Man" candle can form.
🔵 Features
For better visualization, triangles and circles are used above the candles, but they can be easily removed. All Pin bars are displayed in color with the following meanings:
- Black-bodied candle: Inverted Hammer
- Turquoise blue candle: Hammer
- Pink candle: Hanging Man
- Red candle: Shooting Star
🟣 Important : The capability to detect the powerful two-candle pattern "Tweezer Top" at the end of an uptrend emerges by forming two "Shooting Star" candles side by side.
Similarly, the two-candle pattern "Tweezer Bottom" is created at the end of a downtrend with the formation of two "Hammer" candles side by side. To identify the "Tweezer" pattern, make sure the settings in the "Trend Effect" section are set to "Off."
🟣 Auxiliary Indicators
During the start of trading sessions such as Asia, London, and New York, where the highest liquidity exists, alongside this indicator, you can use the Trading Sessions indicator.
Sessions
The combination of Order Blocks "-OB" and "+OB" with candles is one of the best trading methods. The indicator that identifies order blocks, along with this indicator, can yield remarkable results in the success of Pin bar candles.
Order Blocks Finder
The trading toolset "TFlab" presents this indicator. To benefit from all indicators, we invite you to visit our page " TFlab Scripts ".
Indicator

Pin Bar, Inside Bars and Engulfing Candle SticksIntroducing the Candlestick Pattern Plotter, a comprehensive TradingView indicator designed to elevate your technical analysis by automatically identifying and plotting three essential candlestick patterns – Pin Bars, Engulfing Candles, and Inside Bars. This powerful tool equips traders with a holistic view of market dynamics, enabling them to make informed decisions based on key price action signals.
Pin Bar Identification:
The indicator adeptly recognizes Pin Bars, a pivotal candlestick pattern characterized by a small body and a long wick in the opposite direction of the prevailing trend.
Pin Bars are instrumental in signaling potential trend reversals or continuations, providing crucial insights for strategic decision-making.
Engulfing Candle Detection:
Identify Engulfing Candles effortlessly with this indicator, showcasing instances where the body of one candle fully engulfs the body of the previous candle.
Engulfing Candles serve as powerful reversal indicators, offering valuable insights into shifts in market sentiment and potential trend reversals.
Inside Bar Recognition:
The indicator goes beyond traditional patterns by identifying Inside Bars, where the range of a candle is entirely within the previous candle's high and low.
Inside Bars often signify consolidation or a period of indecision in the market, providing traders with crucial information about potential breakouts or reversals.
Seamlessly integrate the Candlestick Pattern Plotter into your TradingView chart, enjoying a user-friendly interface for swift interpretation of candlestick patterns.
Toggle the display of Pin Bars, Engulfing Candles, and Inside Bars on and off with ease, allowing you to focus on the specific patterns most relevant to your analysis.
Real-Time Alerts:
Stay ahead of the market with real-time alerts that notify you when a Pin Bar, Engulfing Candle, or Inside Bar is identified on the chart.
Timely notifications keep you informed, ensuring you never miss a potential trading opportunity based on these crucial candlestick patterns.
Enhance your trading strategy with the precision of Pin Bars, Engulfing Candles, and Inside Bars, seamlessly integrated into your analysis through the Candlestick Pattern Plotter. Gain a comprehensive understanding of market movements and make well-informed decisions in real-time. Indicator

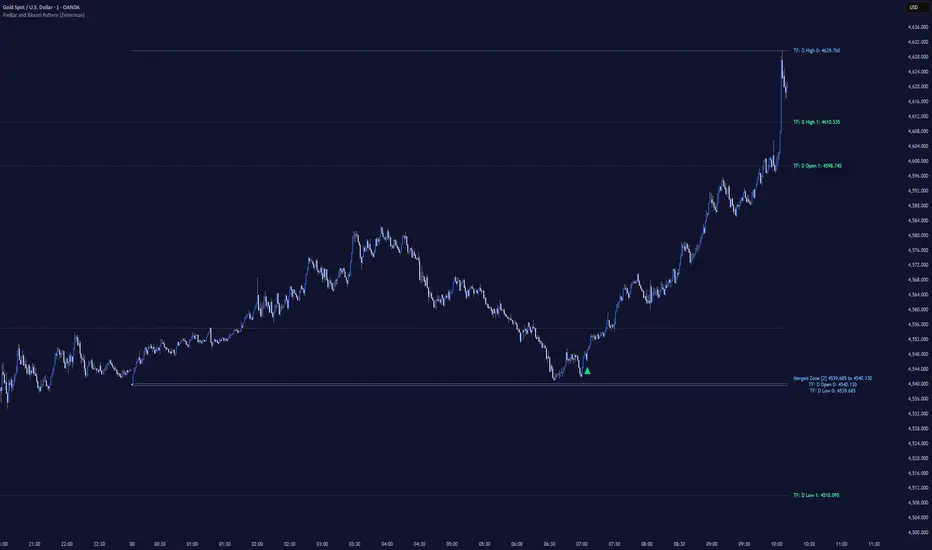
PinBar and Bloom Pattern Concept (Zeiierman)█ Overview
The Precision PinBar and Bloom Pattern Concept by Zeiierman introduces two new patterns, which we call the Bloom Pattern and the Precision PinBar Pattern. These patterns are used in conjunction with market open, high, and low values from different periods and timeframes. Together, they form the basis of the "PinBar and Bloom Pattern Concept." The main idea is to identify key bullish and bearish candlestick patterns around key levels plotted on the chart.
The key levels are the Open, High, and Low from the current and previous periods of the selected timeframe. Users can choose how many previous periods to be drawn on the chart.
█ How It Works
The indicator operates by analyzing market data over selected timeframes. It uses inputs such as previous period open-high-low lines, timeframe selections, and pattern detection settings like Symmetry Precision and Range Threshold. These parameters allow the indicator to identify specific market conditions, including symmetrical movements in price and significant price range deviations, which form the basis of the Bloom and Precision PinBar patterns.
Symmetry Signal:
Purpose: To detect symmetry in price movements based on a precision threshold.
How It Works: This function calculates the symmetry of high and low prices within the specified precision. It returns two boolean values indicating whether the high and low prices are within the symmetry precision.
BaselineBound Pattern:
Purpose: To identify bullish or bearish patterns based on a range factor.
How It Works: The function calculates whether the current close price is within a certain range of the high-low difference of the previous period. It returns bullish and bearish signals based on these calculations.
█ ● Bloom Pattern
The Bloom Pattern is a unique candlestick pattern designed to identify significant trend reversals or continuations. It's not a single candlestick formation but a combination of a few elements that signal a potential strong move in the market.
⚪ Previous and Current Candle Analysis: The Bloom Pattern looks at the relationship between the current candle and the previous one. It checks whether the current candle's body (the range between its opening and closing prices) fully encompasses the body of the previous candle. This condition is known as "embodying."
⚪ Baseline Bound: The Baseline Bound concept involves comparing the closing price to a range established by the high and low of the previous candle, adjusted by a factor (the rangeFactor). This helps in identifying if the current price is showing a bullish or bearish tendency relative to the previous period's price movement.
⚪ Symmetry Signal: Additionally, it uses the Symmetry Signal, which measures the symmetry between the high and low prices of two consecutive candles.
⚪ Bullish and Bearish Signals: The combination of these conditions (embodying, baseline bound, and symmetry) results in either a bullish or bearish signal. A bullish signal suggests a potential upward trend, while a bearish signal indicates a possible downward trend.
█ ● Precision PinBar Pattern
The Precision PinBar Pattern is a refined version of the traditional Pin Bar, a well-known candlestick pattern used in trading. This pattern focuses on identifying market reversals with a high degree of accuracy.
⚪ Identification of Pin Bars: The function first identifies a pin bar, characterized by a small body and a long wick. The long wick indicates a rejection of certain price levels, and the small body shows little change between the opening and closing prices.
⚪ Tail and Body Length Analysis: The script calculates the length of the bar's tail (wick) and compares it to the length of the body. A qualifying pin bar typically has a tail at least three times longer than its body, suggesting a strong rejection of prices.
⚪ Positioning and Thresholds:
Open-Close Position: The function checks whether the opening and closing prices are within a certain threshold of the high or low of the bar, which helps in distinguishing between bullish and bearish pin bars.
⚪ Baseline Bound and Symmetry: Like the Bloom Pattern, it incorporates Baseline Bound and Symmetry Signal concepts to validate the significance of the pin bar.
⚪ Bullish and Bearish Signals: Depending on these factors, a bullish or bearish pin bar is identified. A bullish PinBar suggests potential upward price movement, while a bearish PinBar indicates possible downward price movement.
█ How to Use
Using the Bloom and Precision PinBar patterns in conjunction with key market levels, such as previous highs and lows, can be a powerful strategy for traders. These market levels often act as significant points of support and resistance, and combining them with the patterns can offer strong trade signals. Here's how traders can effectively utilize these patterns:
Identifying Key Market Levels
Previous Highs and Lows: These are the highest and lowest points reached in previous trading periods and are often considered strong levels of resistance (in the case of previous highs) and support (in the case of previous lows).
Using the Bloom Pattern
Near Previous Highs (Resistance): If a Bloom Pattern emerges near a previous high, it could indicate a potential bearish reversal. Traders might interpret this as a signal to consider short positions, especially if the pattern shows bearish characteristics.
Near Previous Lows (Support): Conversely, a bullish Bloom Pattern near a previous low could suggest a trend reversal to the upside. This could be a signal for traders to consider long positions.
Using the Precision PinBar Pattern
Precision PinBar at Resistance: A bearish Precision PinBar appearing near a previous high can be a strong signal for a potential downward move. This setup is often used by traders to enter short positions, anticipating a price rejection at this resistance level.
Precision PinBar at Support: Similarly, a bullish Precision PinBar at or near a previous low suggests that the market is rejecting lower prices, indicating potential upward momentum. This is typically used by traders as a cue to go long.
█ Settings
Previous Open-High-Low Lines: Determine the number of historical periods to analyze. Settings include toggling the visibility of lines and labels and specifying the number of periods.
Timeframe & Current Period: Select the timeframe for current market analysis. Options include different timeframes (e.g., 1H, 1D) and customization of line styles and colors.
Pattern Settings: Adjust the Symmetry Precision and Range Threshold to fine-tune the indicator's sensitivity to specific market movements.
Bloom & Precision PinBar Pattern: Enable or disable the detection of specific patterns and customize the visual representation of these patterns on the chart.
-----------------
Disclaimer
The information contained in my Scripts/Indicators/Ideas/Algos/Systems does not constitute financial advice or a solicitation to buy or sell any securities of any type. I will not accept liability for any loss or damage, including without limitation any loss of profit, which may arise directly or indirectly from the use of or reliance on such information.
All investments involve risk, and the past performance of a security, industry, sector, market, financial product, trading strategy, backtest, or individual's trading does not guarantee future results or returns. Investors are fully responsible for any investment decisions they make. Such decisions should be based solely on an evaluation of their financial circumstances, investment objectives, risk tolerance, and liquidity needs.
My Scripts/Indicators/Ideas/Algos/Systems are only for educational purposes! Indicator

Hammer and inverted Hammer
The "Hammer and Inverted Hammer" indicator is straightforward and effective. It automatically spots key candlestick patterns for you, making it easier to see potential market turns. You can also adjust a few settings to fit your trading style. Simple, yet quite handy for traders!
Alerts for Hammer Pattern: When the script identifies a Hammer pattern, it can trigger an alert. This is particularly useful if you're looking for potential bullish reversal signals and don't want to miss them.
Alerts for Inverted Hammer Pattern: Similarly, when an Inverted Hammer pattern is detected, the script can also trigger an alert. This is helpful for spotting potential bearish reversal signals.
SETTINGS EXPLAINED
Minimum Lower Tail Length (%): This setting allows you to define what percentage of the total candle size should be considered a significant lower tail. This is important for identifying the Hammer pattern.
Number of Consecutive Candles (for Lower Tails): This input lets you choose how many consecutive candles with significant lower tails must be present to identify a pattern.
Percentage of Candle Below Previous Low: This setting determines what percentage of the candle's range must extend below the lowest low of a specified number of previous candles. It's used to assess the significance of a Hammer pattern.
Number of Previous Candles for Lowest Low: This decides how many previous candles the script should look at to calculate the lowest low, which is then used in the Hammer pattern analysis.
Minimum Upper Tail Length (%): Similar to the lower tail setting, this defines the significant length of an upper tail, used for identifying the Inverted Hammer pattern.
Number of Consecutive Candles (for Upper Tails): This input is for setting how many consecutive candles with significant upper tails are required to confirm an Inverted Hammer pattern.
Percentage of Candle Above Previous High: This setting is used to determine how much of the candle's range must be above the highest high of a set number of previous candles, aiding in the identification of the Inverted Hammer pattern.
Number of Previous Candles for Highest High: It specifies the number of past candles to consider for calculating the highest high, which is important for the analysis of Inverted Hammer patterns.
These settings allow you to customize how the script identifies Hammer and Inverted Hammer patterns, making it adaptable to different trading strategies and market conditions. Indicator

Indicator
Indicator

Indicator
Indicator

Strategy

Indicator

Indicator

Library