Indicator
Simple Moving Average (SMA)

Hello VWAP "Beta"This is my 1st indicator, and my attention is to plot the VWAP "Volume-weighted average price" using the SMA "Simple Moving Average" over time... IE over the last 50,100,200 bars and just the VWAP... All of them in just one line... I have made it when I have been using the BTC/US chart, but it should work for stocks/forex or any other chart that you want to use...
I am not completely sure about this indicator and I do want to add more to this, that is how come I am posting to the community to show what I have done and people can use it and if they are open to it give me feedback or tips to make it better...
Happy trading...
Indicator

Indicator

GM 2 EMA Cross + BBScript for seeing the below EMAs
3
5
13
50
100
This also plots a red cross when -ve crossover of 3 by 5 EMA & green cross when +ve crossover of 3 by 5 EMA
Bollinger Bands
2
3
Indicator

Triple MA + EMA + SMMA + BBCombined multiple scripts under one script.
Great for Free account users. ;-)
This script contains:
Moving Average
Exponential Moving Average
Smoothed Moving Moving Average
Bollinger Bands
Indicator

Smoothed Moving Average - Zip CharlieModified SMA entry and exit points based on Charlie's ThinkorSwim platform, replicated to trading view
Indicator
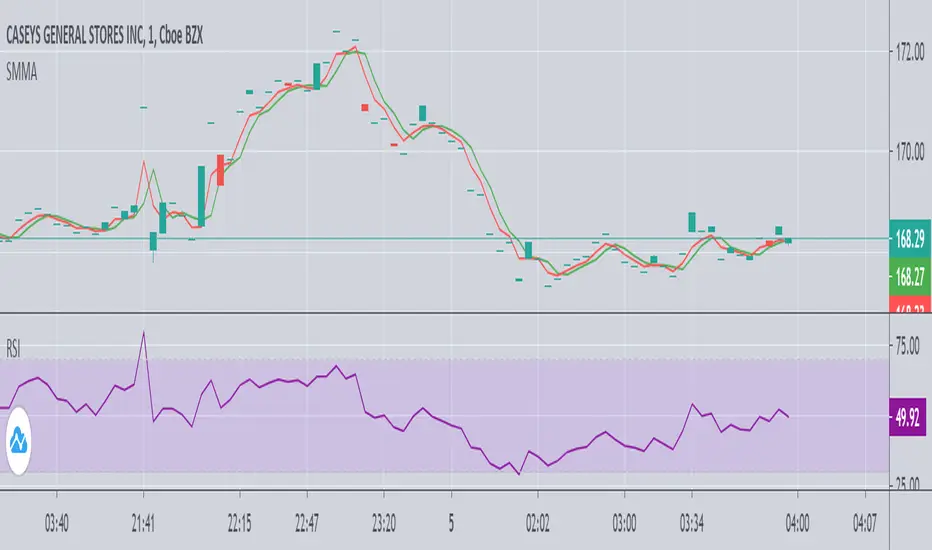
Overlay_set by HallyIt is a set of overlay indicators that combine 5 simple moving averages, Bollinger band, and clouds of Ichimoku cloud.
The reason I made this is because I want to make it easier to switch the display of the indicator when trading in a short time.
For example, if you double-click SMA, the setting dialog for this indicator opens. Immediately check the check box of the Bollinger you want to add and close the dialog.
You can quickly switch the display with this feeling and save the amount of mouse movement.
x0xXx0xx0xXx0xx0xXx0xx0xXx0xx0xXx0xx0xXx0xx0xXx0xx0xX
単純移動平均線5本と、ボリンジャー・バンド、一目均衡表の雲を1つにまとめたオーバーレイ系のインジケーターのセットです。
これを作った理由は短い時間でのトレードの際にインジケーターの表示を切り替えるのを楽にしたいからです。
たとえば、SMAをダブルクリックすればこのインジケーターの設定ダイアログが開くのですぐに追加表示したいボリンジャーのチェックボックスにチェックしてダイアログを閉じる。
という感じで素早く表示を切り替えることが出来き、マウスの移動量を節約できます。
Indicator

Moving Average Over Timea simple moving average and an exponential moving average that change periods along with temporality: WEEKLY: MA48, EMA24; DAILY: MA21, EMA11; H4: MA30, EMA15; H1: MA120, EMA30.
Indicator

Multi SMA/ EMAA combination of multiple simple & exponential moving averages in one indicator. On the daily chart for rocket stocks, price mainly follows EMA 1 (8 period) and falls back to SMA 1 (20 period) occasionally for support. Healthy trends respect SMA 1 and 2 (50 period). SMA 5 (200 period) acts as strong support or resistance.
You can customise the input values, colours and switch off the MAs that you are not using. On the bottom corner, choose "save as default" in the drop down bar so that you do not lose your settings when you reload the indicator.
Indicator

Moving Averages Convergence (Agulhada do Didi)The script is based on a strategy developed by Odir “Didi” Aguiar called “Agulhada do Didi”.
It consists in the use of 3 moving averages:
SMA 3
SMA 8
SMA 21
Strategy:
When the averages come together, preferably they pass through a candle, there is a signal. The crossing of the short average (3) with the long average (21) provides us with a confirma-tion of the entry.
Buy:
The average of 3 periods comes out on top, 8 goes in the middle and 21 goes down.
Sell:
Average of 21 periods comes out on top, 8 in the middle and 3 down.
Indicator

Indicator

Draw swing Lines based on SMA// Draw swing Lines based on SMA
// Each swing line must cross SMA
// ---------------------------------------------------
// Input:
// sma(Number): Default 50;
// showSMA: Default 'true'; if showSMA ='false', do not show SMA line;
// Deviation(%): Default "1"; To draw a new swing line, Price must cross SMA more than (n% of SMA)
// In weekly chart, better use "2" or more to avoid small ZigZag;
// ---------------------------------------------------
// This swing Lines could be used:
// 1. Verify reversal pattern, such as, double tops;
// 2. Help to draw accurate trend line, avoid noice; Set showSMA=false, to see trend line clearly;
// 3. Use two of this study together with different SMA, Set showSMA=false,
// Such as, SMA20 and SMA200, to see small waves in bigger wave
// ---------------------------------------------------
// In this sample Chart -- AMD 1h (Feb to Jun 2020)
// Added this study with SMA(50),
// Hide price chart and SMA line, to show the Swing line only,
// I drew some sample trend lines, and identified one Double top;
Indicator

BTC Fibonacci DMA350 TrendlinesAdapted from Tim Graham's Code.
See Original Inspiring Article from Phillip Swift at: @positivecrypto
When looking into BITSTAMP:BTCUSD 1D data in spreadsheet. Historically, BTC Highs Hit (Simple Daily Moving Average 350 Days) DMA350 in reverse Fibonacci Sequence Order
2013 Hit DMA350*8 before All Time High (ATH)
2017 Hit DMA350*5 before ATH
I expect 2021 to hit DMA350*3 ATH. When BTC hits DMA350*3 ATH, I suggest selling!
Indicator

Indicator

MA Cross 50/100, 100/50 Moving Average Cross tool using MA 50 / MA 100 / MA 200
I have found these settings useful on Bitcoin & other markets
Alerts Added,
Breakout = MA 50 crossing above MA 100
Breakdown = MA 100 crossing under MA 50
MA 200 added as a useful area for overall support
No repaint.
Indicator

GMS: Keltner ChannelsBasically I wanted to make this into one indicator instead of three while adding in some extra options as well... So this is just a Keltner Channel with three channels, all of which have the same length. I have also added in an option to select the moving average for the channel, the original is based on the EMA.
The source code should be open so take a look around and enjoy!
Andre
Indicator
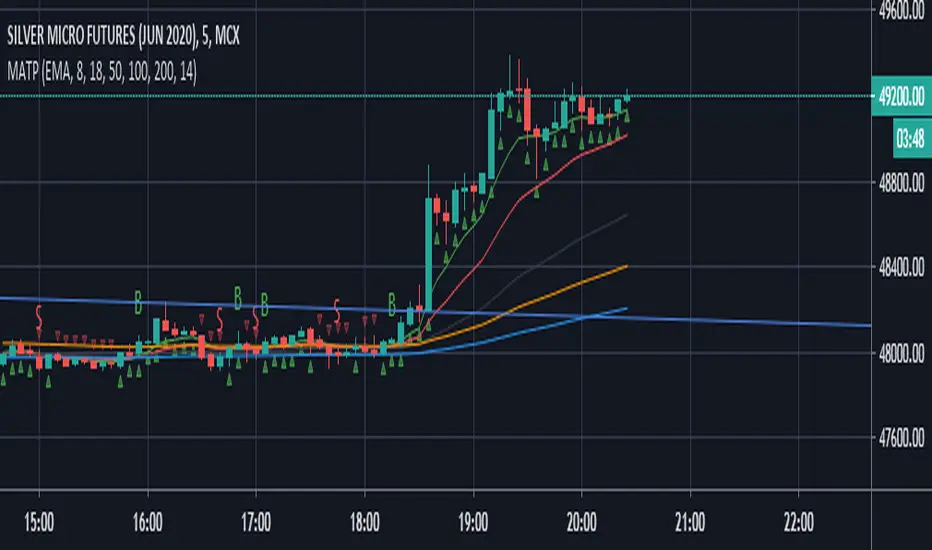
MATP, Moving Average Trend predictorMATP prepared based on moving average lines to predict Short term, mid term and long term trends. B for Buy and S for Sell character printed to take position based on short term and long term trend lines .
Call: Take Long (B) or Short (S) position when respective Char printed.
Please do tune indicators values from setting based on your script to get accurate call.
Happy Trade
By
Gops
Indicator
[LunaOwl] Moving average Bias Ratio作品: 均線乖離率 (Moving average Bias Ratio)
The concept of Moving average Bias Ratio is according to the difference between the long/short-term MA changes, determine the direction of buy or sell. Long if the short-term MAs is above the long-term MAs; Conversely, if the short-term MAs is below the long-term MAs, it is not held.
均線乖離率的概念,是根據長短期均線變化之間的乖離來確定多空方向。如果短期高於長期,則買進;相反的~如果短期低於長期,則空手。
Using the deviation rate alone will have the disadvantage of unclear signals, which can only explain the increased chance of market reversal. It needs to cooperate with the rule of thumb and other analytical tools.
單獨使用乖離率會有信號不明確的缺點,只能解釋市場發生反轉的機會增加,需要配合經驗法則和其他分析工具。
--------------------------*
Formula - 公式
Avg. BIAS = ( MA(short) - MA(long) ) ÷ MA(long) × 100 %
均線乖離率 =(短期平均-長期平均) ÷ 長期平均 × 100 %
--------------------------*
The greater the distance between the two moving averages, the greater the Bias Ratio.
Indicator

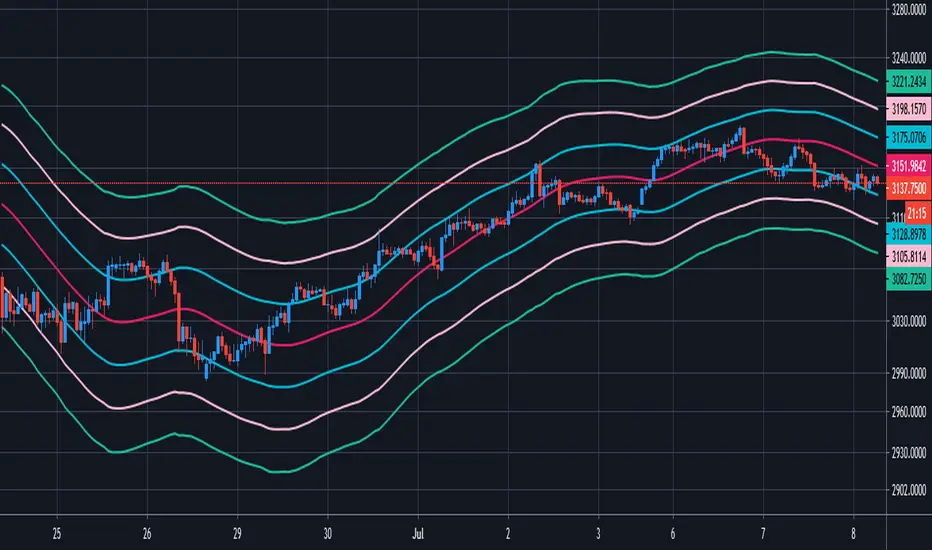
Golden Ratio MultiplesI call this "Phi Ribbons." The Golden Ratio, also known as Phi, is fantastic at predicting areas of price reversal.
Every moving average is a fibonacci multiple of the base function 355 SMA .
The rainbow above is an array of fibonacci multiples that are greater than one (1.618, 2, 2.618, 3, 5, 8, 13, 21)
The rainbow below is an array of fibonacci multiples that are less than one (0.786, 0.618, 0.5, 0.382, 0.236, 0.14)
Notice the precision of marking areas of potential price reversals
EASTER EGG: The two moving averages at the top of the script are 355 SMA & 113 SMA . This is one of the lowest ratios that closely approximates Pi (3.14159).
Simply plotting the 133 SMA will add a unique feature:
355/133 = 3.14159
When the 113 crosses below the 355 it tends to mark the end of major bullish impulses, and a crossover is a bullish sign.
Indicator

MA 10,20,50,200Indicator consist of moving averages (MA).
This indicator make it easier for me to switch between few MA lines.
1. MA10
- used for intraday.
2. MA50 and Ichimoku
- to analyze swing trend
- display only MA50 and ichimoku cloud
3. MA20, MA50 and MA200
- to analyze the trend
- for swing trade
4. Lines 52 Week High / Low
- display both lines as guide when trading
Indicator
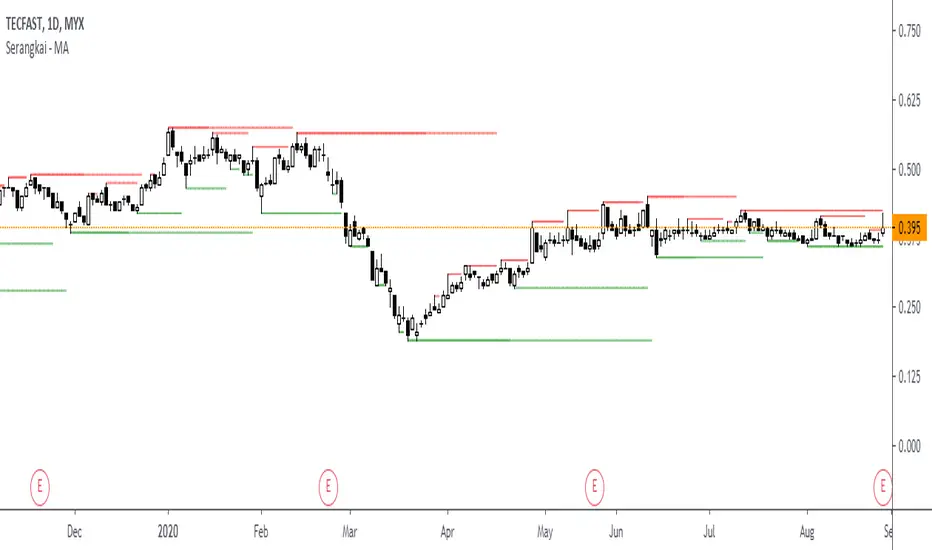
SMA STRATEGYIt is a simple strategy to show a possible combination of a simple moving average and Fast-SMA published earlier.
It goes long only when the price is over sma 50 and FSMA and closes the trade when it crosses down FSMA. The same logic is for the shorting.
At this time this strategy does not take in count slow crossing and fuss that needs additional confirmation. I described such cases in Fast SMA script.
The strategy does not repaint. Bars color when a candle closes.
Strategy

Fast SMAFast SMA is based on the simple moving average and adds to it more flexibility.
It is a composite indicator, as it uses sma and counts factor that gives more weight for a more recent price index.
The difference between sma (thin line) and fast sma (bold line) you can see on the chart.
Fast sma with default parameters with this script is faster then ema with the same length.
It has flexibility almost as HMA with the same length has.
After using it for two months I found this ma very interesting and decided to share its code and the way it can be used.
FSMA and price index interact:
1) FSMA acts as support or resistance giving price line good pullbacks.
2) If price breaks through FSMA the stop of this move form strong support or resistance level.
3) if price cross FSMA without cutting move of make fuss on FSMA it forms range. In this case, FSMA break must be considered only after price leaves the range. In such cases, FSMA usually shows the direction by giving additional price pullback confirmations.
On the chart I added some comments and marked SR lvls, zones and strong moves of BTC since 2018 till now with submitted FSMA strategy.
I wish you good trades.
examples:
Indicator

Monthly MA Close Generates buy or sell signal if monthly candle closes above or below the signal MA.
Long positions only.
Inputs:
-Change timeframe MA
-Change period MA
-Use SMA or EMA
-Display MA
-Use another ticker as signal
-Select time period for backtesting
This script is not necessarily written to maximize profits, but to minimize losses.
Although it can outperform 'Buy & Hold' on some occasions when there is a multiple month bearisch trend.
You can optimise this strategy by changing the signal MA inputs.
I would suggest aiming for the best Profit Factor starting from the monthly ("M") setting.
You can always fine-tune the results at a lower timeframe.
The option to use another ticker for providing signals can give you a more stable and unified results.
For example using AMEX:SPY as signal with default parameters gives better results with NASDAQ:AAPL than if you would use NASDAQ:AAPL itself.
I used the anti-repainting function from PineCoders to prevent repainting.
This script is best used for multi-month trading positions & Daily or 4H setting of your chart.
Strategy
