Indicator

Indicator

Indicator

Indicator

OT Bot trend ProOT Bot Supertrend Pro: The Ultimate Trading Guide
The OT Bot Supertrend Pro is an advanced trend-following system. It combines momentum (OT Bot), trend direction (SMA ), and volatility-based support/resistance (Supertrend), all filtered by trend intensity (ADX).
1. The Power of the ADX Filter (Trend Intensity)
Before looking for Buy/Sell signals, the indicator checks the ADX (Average Directional Index) to ensure you aren't trading in a "dead" or "exhausted" market.
• ADX < 20 (Sideways/Weak): The market is flat. Signals are hidden to prevent "Whipsaws" (losing trades in a range).
• ADX 25–40 (The Sweet Spot): The trend is healthy and active. Signals are visible and ready for entry.
• ADX > 40 (Overextended): The trend is too strong and likely to reverse soon. Signals are hidden to prevent "Buying the Top" or "Selling the Bottom."
2. Entry Strategy (The 4-Step Checklist)
To maximize accuracy, only enter a trade when all four conditions are met.
Buy Signal (Long Entry)
1. OT Bot: A "Buy" label appears, and candles turn Blue.
2. SMA : Price must be Above the Yellow line.
3. Supertrend: The dashed line must be Green (acting as support).
4. ADX: Current value must be between 20 and 40 (indicated by the Green dashboard).
Sell Signal (Short Entry)
1. OT Bot: A "Sell" label appears, and candles turn Purple.
2. SMA : Price must be Below the Yellow line.
3. Supertrend: The dashed line must be Red (acting as resistance).
4. ADX: Current value must be between 25 and 40 (indicated by the Green dashboard).
3. Precision Stop Loss (SL) Management
Your Stop Loss is dynamic, using the Supertrend line as a shield. We add a buffer of 100–200 points to avoid being stopped out by minor price spikes.
• For Buy Positions:$$Stop Loss = \text{Supertrend Price} - (100 \text{ to } 200 \text{ points})$$
• For Sell Positions:$$Stop Loss = \text{Supertrend Price} + (100 \text{ to } 200 \text{ points})$ OMXSTO:NOTE on "Points": > * Gold (XAUUSD): 1.00 USD movement = 100 points.
• Forex: The 5th decimal place (0.00001) = 1 point.
4. Exit & Take Profit (TP)
You can use two effective methods to lock in profits:
1. Fixed Risk/Reward: Target a ratio of 1:1.5 or 1:2. If your SL is 200 points, set your TP at 300–400 points.
2. Trend Transition: Close the trade if the candle color changes (e.g., Blue to Purple) or the Supertrend changes color, even if the OT Bot hasn't issued a new signal yet.
5. Pro-Tips for Success
• Recommended Timeframes: Best used on 15m, 1H, or 4H. Using very low timeframes (1m/5m) with ATR 1 may result in too many signals.
• Dashboard Check: Always look at the ADX Dashboard (Top Right). If it is Red, stay out of the market regardless of the "Buy/Sell" labels.
• Confirmation is King: Never "anticipate" a signal. Wait for the candle to Close to confirm the labels and colors before clicking buy or sell. Indicator

Indicator
Indicator

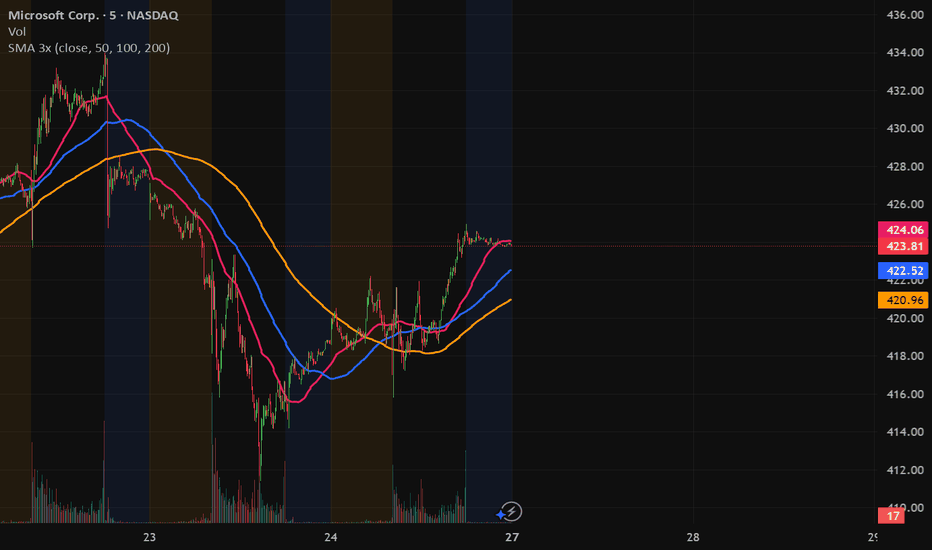
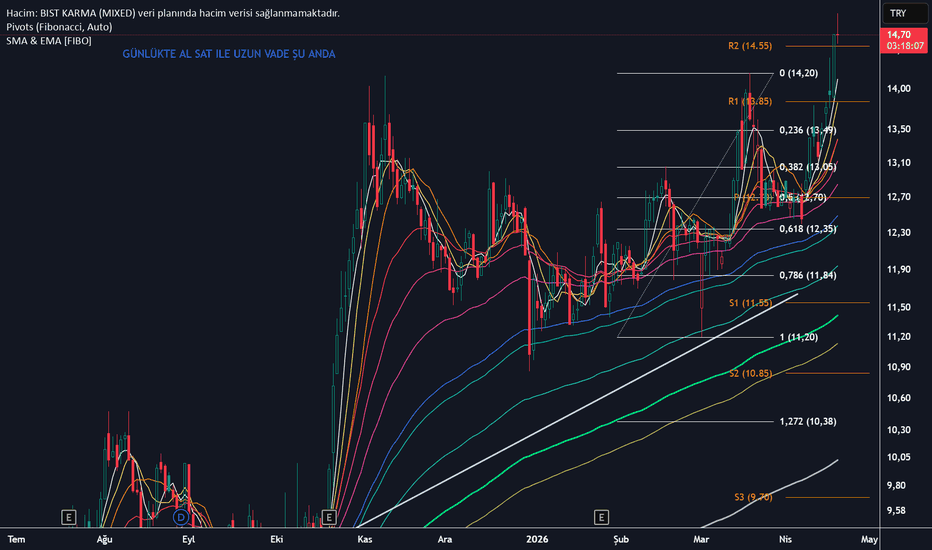
SMA & EMA [FIBO]This indicator provides a comprehensive suite of Simple Moving Averages (SMA) and Exponential Moving Averages (EMA) in a single script, designed for both short-term momentum and long-term trend analysis.
The periods are heavily based on the Fibonacci sequence, along with standard psychological levels (100 and 200), giving you a complete map of dynamic support and resistance zones.
Key Features:
Short-Term SMAs: 5, 8, 13
Medium & Long-Term EMAs: 21, 34, 55, 89, 100, 144, 200, 233, 377
Zero Interface Clutter: The "Inputs" tab is kept completely empty for a distraction-free experience. You can toggle the visibility of each moving average, change colors, and adjust line thickness directly from TradingView's native "Style" tab.
Dark Mode Ready: Default colors are specifically chosen to be vibrant and distinct on dark-themed charts.
How to Use:
Track the short-term SMAs (5, 8, 13) to spot immediate momentum shifts and fast crossovers.
Use the mid-to-long-term EMAs (like 55, 100, 200) as dynamic support and resistance levels or to determine the macro trend direction.
Since all averages are bundled in one script, you save indicator slots. Simply hide the ones you don't need via the Style tab to keep your chart clean. Indicator
Indicator

Indicator

SHK 3 MA EMA WMA | VWAP | TRIANGLE CROSS━━━━━━━━━━━━━━━━━━━━━━━━━━━━━━━━━━━━━━
SHK 3 MA EMA WMA | VWAP | ▲▼ CROSS
━━━━━━━━━━━━━━━━━━━━━━━━━━━━━━━━━━━━━━
A clean and powerful multi-purpose trend indicator combining
3 fully customisable Moving Averages with crossover signals
and an anchored VWAP — all in one overlay.
━━━━━━━━━━━━━━━━━━━━━━━━━━━━━━━━━━━━━━
MOVING AVERAGES
━━━━━━━━━━━━━━━━━━━━━━━━━━━━━━━━━━━━━━
• 3 independent Moving Averages — MA1, MA2, MA3
• Each MA is individually selectable as EMA / SMA / WMA
• Each MA has its own length input
• Default lengths: MA1 = 9 | MA2 = 21 | MA3 = 50
• Color, opacity, thickness and line style controlled
directly from the chart legend (click the line name)
━━━━━━━━━━━━━━━━━━━━━━━━━━━━━━━━━━━━━━
CROSSOVER SIGNALS
━━━━━━━━━━━━━━━━━━━━━━━━━━━━━━━━━━━━━━
Two sets of cross signals with triangle labels:
▲ MA1 × MA2 — Bullish cross (triangle below bar)
Label shows actual lengths e.g. "9×21"
▼ MA1 × MA2 — Bearish cross (triangle above bar)
Label shows reversed lengths e.g. "21×9"
▲ MA2 × MA3 — Bullish cross (triangle below bar)
Label shows actual lengths e.g. "21×50"
▼ MA2 × MA3 — Bearish cross (triangle above bar)
Label shows reversed lengths e.g. "50×21"
Triangle colors match their respective MA line colors.
━━━━━━━━━━━━━━━━━━━━━━━━━━━━━━━━━━━━━━
VWAP
━━━━━━━━━━━━━━━━━━━━━━━━━━━━━━━━━━━━━━
• Volume Weighted Average Price (VWAP)
• Selectable anchor period:
Session | Week | Month | Quarter | Year
• Toggle on/off from settings
• Color, opacity, thickness and line style
controlled from chart legend
━━━━━━━━━━━━━━━━━━━━━━━━━━━━━━━━━━━━━━
ALERTS
━━━━━━━━━━━━━━━━━━━━━━━━━━━━━━━━━━━━━━
4 built-in alert conditions:
• MA1 Crossed Above MA2 ▲ (Bullish)
• MA1 Crossed Below MA2 ▼ (Bearish)
• MA2 Crossed Above MA3 ▲ (Bullish)
• MA2 Crossed Below MA3 ▼ (Bearish)
━━━━━━━━━━━━━━━━━━━━━━━━━━━━━━━━━━━━━━
HOW TO USE
━━━━━━━━━━━━━━━━━━━━━━━━━━━━━━━━━━━━━━
1. Add indicator to chart
2. Set MA types and lengths in Settings
3. Click any line name in chart legend to
adjust color, opacity, thickness and style
4. Use VWAP as dynamic support/resistance
5. Set alerts from the Alerts menu
━━━━━━━━━━━━━━━━━━━━━━━━━━━━━━━━━━━━━━
⚠️ DISCLAIMER
━━━━━━━━━━━━━━━━━━━━━━━━━━━━━━━━━━━━━━
This indicator is for educational and
informational purposes only. It does NOT
constitute financial advice, investment
advice, or a recommendation to buy or sell
any financial instrument.
Past performance of any indicator or strategy
does not guarantee future results. Trading
involves significant risk of loss and is not
suitable for all investors. Always do your own
research and consult a qualified financial
advisor before making any trading decisions.
The author accepts no responsibility for any
losses incurred from the use of this indicator.
━━━━━━━━━━━━━━━━━━━━━━━━━━━━━━━━━━━━━━
© SHK — All rights reserved
━━━━━━━━━━━━━━━━━━━━━━━━━━━━━━━━━━━━━━ Indicator

Indicator

Indicator

Indicator

Pro Volatilite-v61. Hidden Trend Algorithm (Background)
The heart of the code actually beats with a SuperTrend logic. However, it differs from ready-made indicators on the market in two major ways:
Manual Calculation: Instead of the ta.supertrend function, the bands are calculated manually using ATR (Average True Range). This preserves the originality of the code.
ALMA Smoothing: Classic trend lines create sharp, angular "ladder" steps in price changes. Here we used ALMA (Arnaud Legoux Moving Average). ALMA is one of the smoothest averages on the market and makes the trendline silky smooth. This prevents an outsider from realizing it's a SuperTrend.
2. Triple Dynamic Average Set
Three different moving averages run simultaneously on the chart. These are usually set to 20, 50, and 200 periods:
Flexibility: You can change these numbers as you wish from the settings menu (e.g., 9, 21, 100).
Mode Selection: You can change the type of all three lines (SMA, EMA, or VWMA) with a single setting.
Visual Hierarchy: The lines have different thicknesses. The longest-term (200) line is drawn thickest to highlight the main support/resistance level.
3. Fully Customizable Interface
The most user-friendly part of the code is the control panel added to TradingView's "Settings" (gear) menu:
Color Control: You can choose the color tones you want for uptrends and downtrends.
Opacity: You can adjust how prominent the fill between the price and the trend line will be.
On/Off: If you think the screen is too cluttered, you can hide any of the 20-50-200 lines with a single click.
How it Works? (Strategic Use)
Trend Direction: If the main line, which is thick and sloping, is Turquoise (or your chosen color), the market is trending upwards; if it is Pink, it is trending downwards.
Signal Points: Small circles appearing just below or above the candles when the trend reverses indicate the start or end of a trend.
Support and Resistance: The 20, 50, and 200 lines show where the price will rest or rebound within the trend. For example, if the price touches the 50-period moving average (orange line) while above the main trend and receives a reaction, this can be considered a strong buying opportunity. Indicator

Indicator

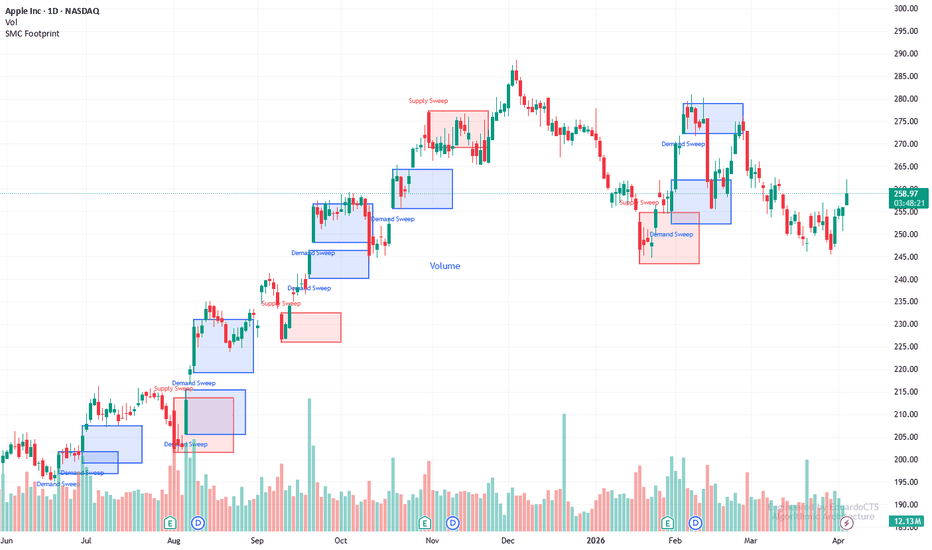
Institutional Smart Money Footprint (Volume Anomalies) by:EduardMost retail traders rely on moving averages and lagging oscillators, completely missing the fact that the market is governed by liquidity sweeps and algorithmic volume anomalies, I developed this stripped-down version of our institutional footprint tracker to map where the "Smart Money" is aggressively stepping in.
This engine doesn't just look at price action, it cross-validates extreme spread expansions with 150%+ volume surges to plot high-probability Demand and Supply blocks directly on your chart. When a whale moves, they leave a mathematical footprint. This algorithm highlights it.
If you are a discretionary trader, use these zones as hard exhaustion/reversal levels, if you are running a prop firm or need to translate complex logic like this into a fully automated, low-latency execution bot, my team specializes in custom algorithmic architecture (Pine Script, Python, and C#), feel free to study the open-source code or reach out directly for custom B2B engineering. Indicator
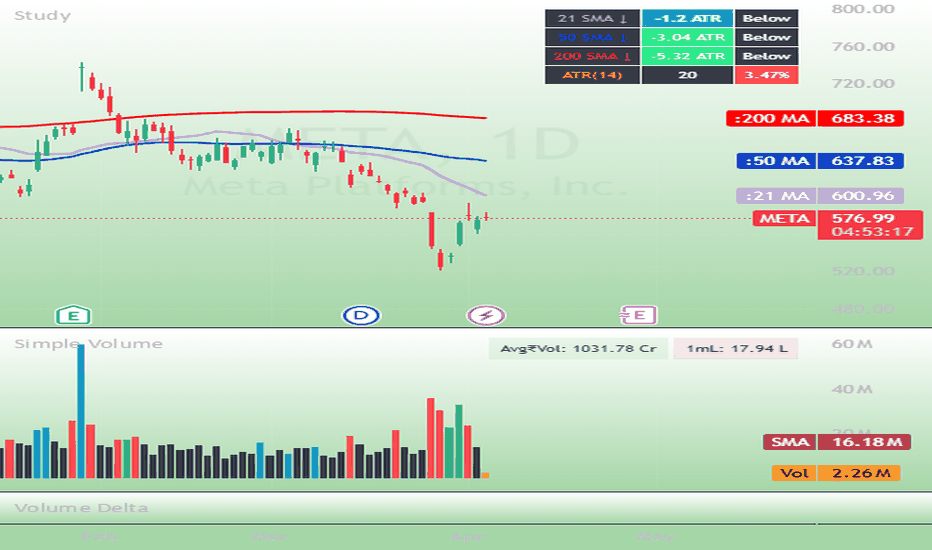
MA + ATRHere’s a clean, professional **TradingView description** you can use when publishing your script:
---
## 📊 Multi MA + ATR Extension Dashboard
This indicator combines key moving averages with volatility analysis to provide a clear, real-time view of trend structure, extension, and momentum.
---
### 🔧 Features
**Moving Averages**
* Plots **5, 21, 50, and 200 MA**
* Supports **SMA or EMA selection per MA**
* Clean color scheme for quick visual recognition
**ATR-Based Extension**
* Measures how far price is from each MA in **ATR units**
* Helps identify:
* Overextended moves
* Mean reversion zones
* Healthy vs stretched trends
**Trend Curl (Angle)**
* Displays **angle of curl (slope)** for 21, 50, and 200 MA
* Quickly shows:
* Trend acceleration
* Flattening structure
* Early reversal signals
**Smart Table Dashboard**
* Compact table showing:
* MA type + direction (arrow)
* Distance from MA (in ATR)
* Price position (above/below)
* Curl (angle) of key MAs
* Customizable position and size
**ATR Volatility Context**
* Shows ATR % (volatility relative to price)
* Helps compare volatility across instruments
---
### 🧠 How to Use
* **Trend Identification**
* Look for alignment (21 > 50 > 200 = bullish)
* Use curl to confirm strengthening or weakening trends
* **Extension Analysis**
* 1 ATR = normal move
* 2 ATR = extended
* 3 ATR = potential exhaustion
* **Mean Reversion**
* High ATR extension + flattening curl = pullback probability
* **Momentum Insight**
* Rising curl = strengthening trend
* Falling curl = weakening trend
---
### ⚙️ Best Use Cases
* Intraday trend trading
* Swing trading pullbacks
* Identifying exhaustion moves
* Volatility-aware risk management
---
### 💡 Notes
* ATR measures **volatility, not direction**
* Works best when combined with price structure and volume
Indicator
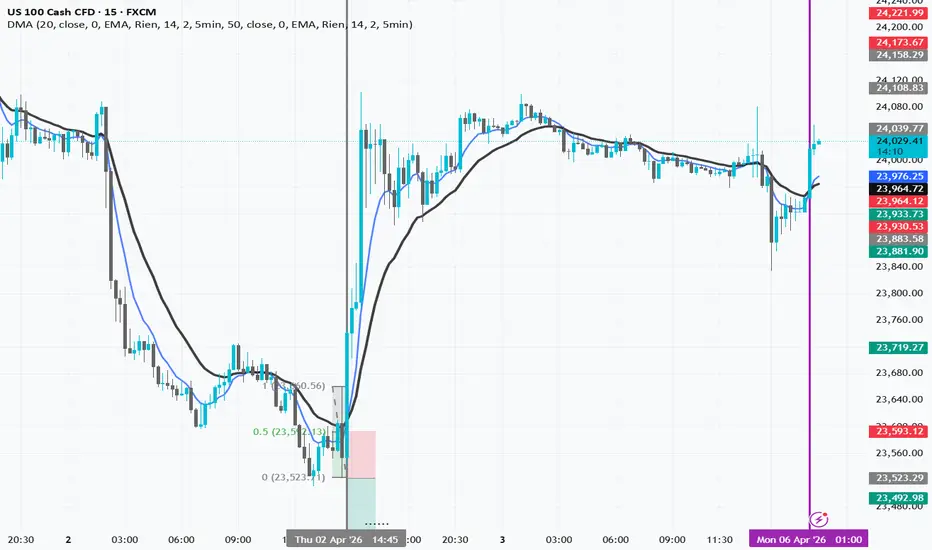
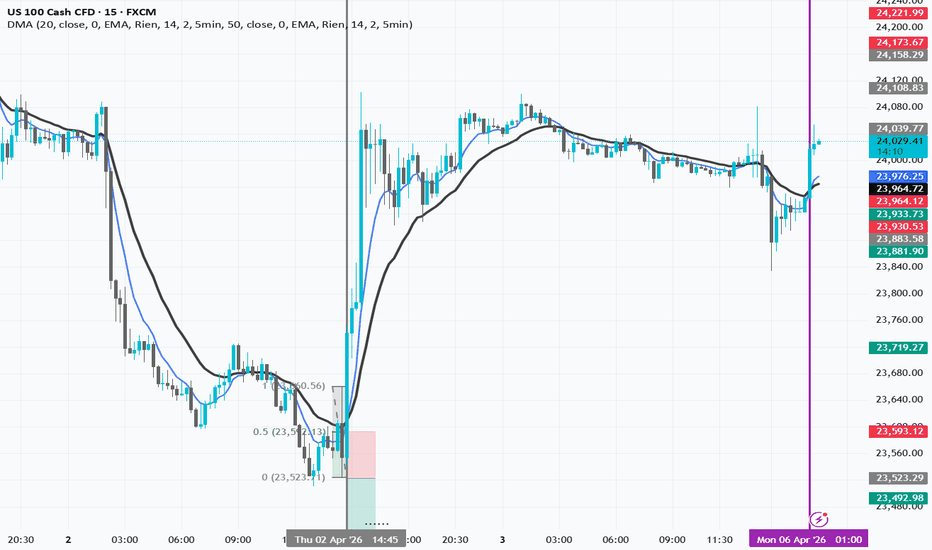
Double Moving Average## 📊 Double Moving Average (DMA)
**General Description:**
An indicator composed of two completely independent Moving Averages (MAs), each configured with its own parameters. Unlike a standard MA, each MA #1 and MA #2 can use a different timeframe, even if the chart displays another timeframe.
---
### **MA #1 - Parameters**
| Parameter | Default | Range | Description |
|-----------|---------|-------|-------------|
| **Enable MA #1** | ✓ | Yes/No | Activate/deactivate the first MA |
| **Length** | 50 | 1-500 | Calculation period of the MA |
| **Source** | Close | Open/High/Low/Close | Price source |
| **Offset** | 0 | 0-100 | Shift the curve to the right |
| **Type** | EMA | SMA/EMA/WMA | Type of moving average |
### **MA #2 - Parameters**
Identical to MA #1 but with default **Length: 200**
---
### **Smoothing - Per MA**
Each MA can have its own smoothing:
| Parameter | Options |
|-----------|---------|
| **Enable Smoothing** | Yes/No |
| **Type** | None / SMA / EMA / WMA |
| **Length** | 1-100 |
| **BB StdDev** | 0.1-10 (Bollinger Bands) |
---
### **Timeframe (Period) - Per MA**
Each MA calculates on an independent timeframe:
**Options:** 1min, 2min, 5min, 10min, 15min, 30min, 1hr, 2hr, 4hr, 1day
**"Wait for Close":** Waits for the timeframe candle to close before confirmation
---
### **Main Functions**
1. **`f_convert_timeframe()`** - Converts timeframe formats for Pine Script
2. **`f_calculate_ma()`** - Calculates SMA, EMA, or WMA
3. **`f_apply_smoothing()`** - Applies smoothing if enabled
---
### **Use Cases**
- Display short-term MA (5min) for scalping
- Display long-term MA (1day) for overall trend
- All on the same chart, independent of the displayed timeframe
- Compare two different trend periods simultaneously Indicator
Indicator
Indicator

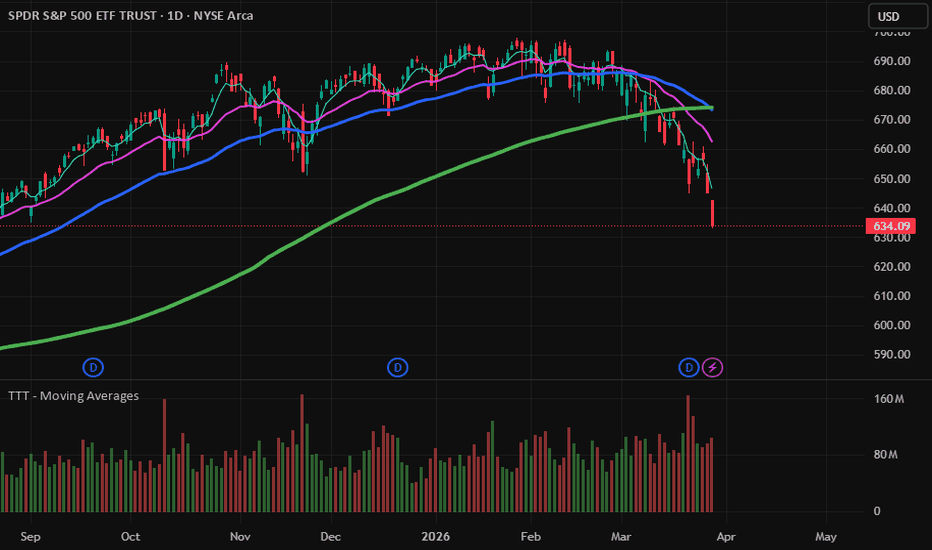
TTT - Trend Identification Moving AveragesWhat This Indicator Does
This indicator is designed to help traders identify and stay aligned with the dominant market trend by combining multiple moving averages with volume analysis. It provides a structured framework to evaluate trend direction, momentum, and participation—without relying on news, fundamentals, or opinions.
The Philosophy Behind It
Markets move in trends—and those trends tend to persist far longer than most investors expect. The biggest mistake traders make is trying to predict reversals instead of recognizing and following the current trend.
This tool is built on a simple principle: Trade with the trend, not against it.
As outlined in Technical Trading Mastery, price action reflects all known information, often reversing well before economic data or news confirms the move . By focusing on price and trend structure, traders can position themselves on the right side of the market rather than reacting emotionally.
How It Works
1. Multi-Timeframe Trend Structure
This indicator uses a combination of short-, intermediate-, and long-term moving averages:
5 EMA → Short-term momentum
20 EMA → Near-term trend direction
50 EMA → Intermediate trend
150 SMA → Long-term market direction
These averages act as dynamic support and resistance levels while also defining trend alignment .
2. Trend Confirmation Logic
The relationship between moving averages helps define market conditions:
- When shorter-term averages are above longer-term averages → Uptrend
- When shorter-term averages fall below longer-term averages → Downtrend
- When averages compress or move sideways → Consolidation / indecision
A key concept:
- When the 50 EMA is above the 150 SMA, the market is considered in a healthy uptrend
- When the 50 EMA falls below the 150 SMA, it signals a potential shift to a bearish environment
This provides a clear, rules-based way to stay aligned with the dominant trend.
3. Entry & Pullback Context
Trends do not move in straight lines—they move in waves. Price will naturally pull back toward moving averages during trends.
These areas can act as:
- Support in uptrends
- Resistance in downtrends
This allows traders to evaluate whether price is:
- Extending (higher risk)
- Pulling back (potential opportunity)
- Breaking trend (potential warning)
4. Volume as Participation Insight
Volume is displayed to provide context behind price movement.
- Rising price with increasing volume → stronger participation
- Rising price with declining volume → weaker conviction
- Sharp volume spikes → potential emotional or institutional activity
Markets are driven by waves of capital flow and crowd psychology, not just price alone . Volume helps reveal when those waves are gaining or losing strength.
Why This Matters
Most traders struggle not because they lack indicators—but because they lack structure and discipline.
This indicator simplifies decision-making by focusing on three key elements:
- Trend direction (Are you aligned with the market?)
- Price location (Are you chasing or buying weakness?)
- Participation (Is there real conviction behind the move?)
Instead of reacting to headlines or emotions, this framework encourages a rules-based approach to understanding market behavior.
How To Use It
- Focus on trading in the direction of the dominant trend
- Use moving averages as a guide for trend alignment and structure
- Observe how price reacts near key averages for potential continuation or warning signals
- Use volume to confirm whether moves are supported by participation
Final Perspective
This tool is not about predicting tops or bottoms.
It is about recognizing trends, understanding market structure, and staying positioned with the flow of capital.
Because in the end, the market rewards those who follow it—not those who fight it. Indicator
Indicator