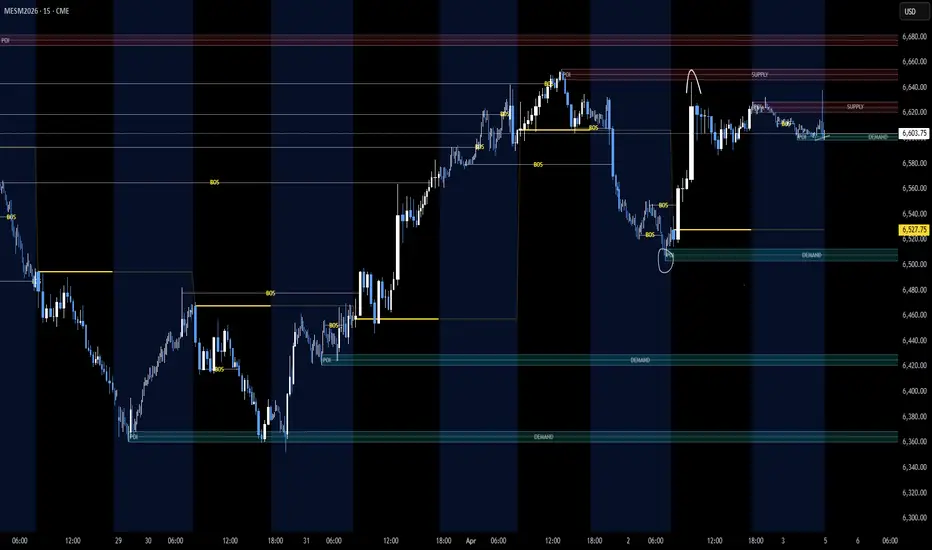
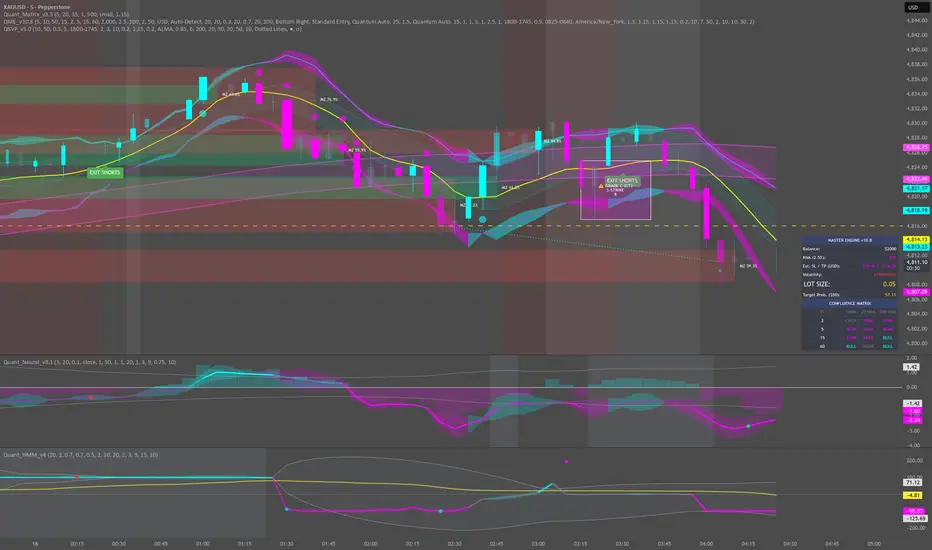
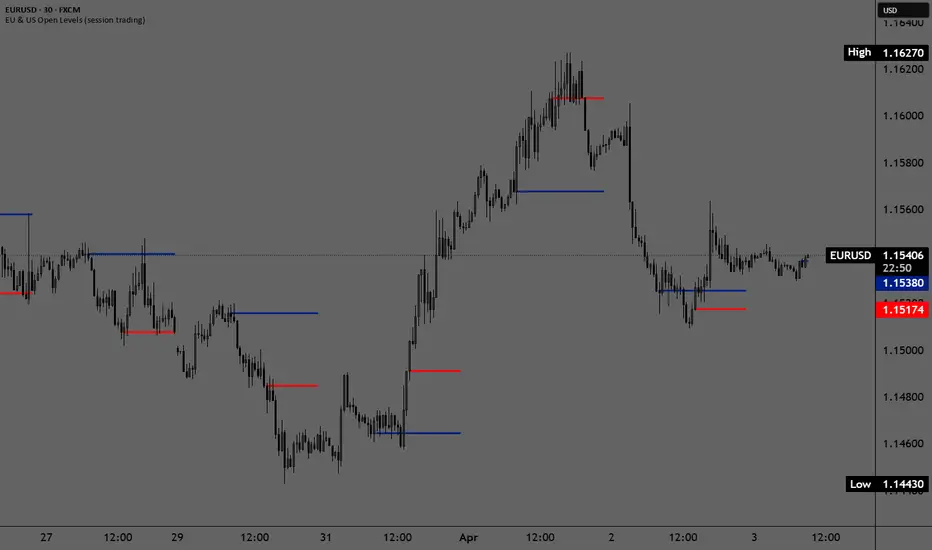
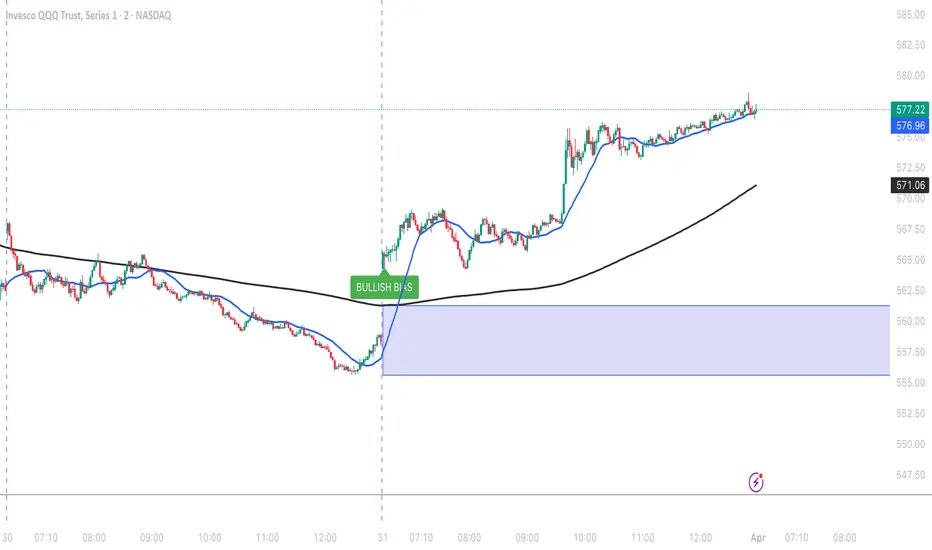
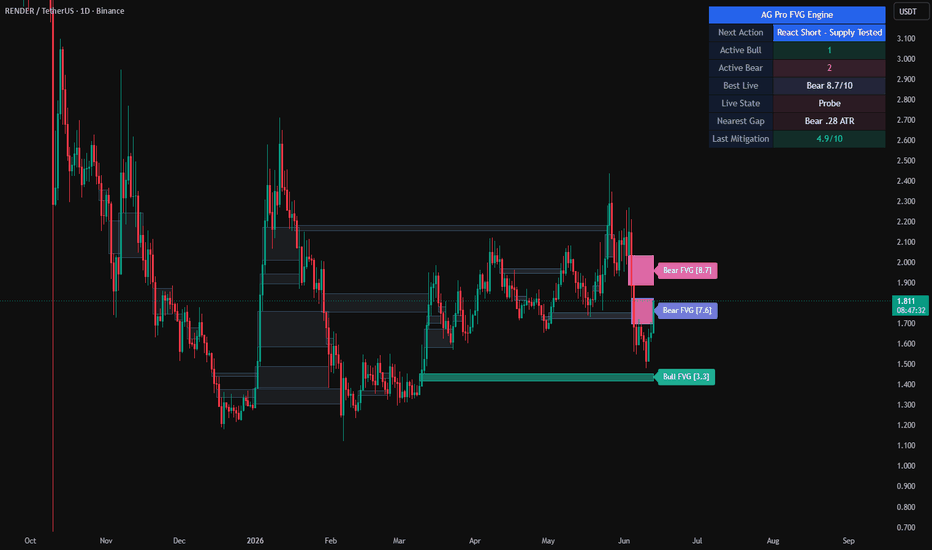
AG Pro Fair Value Gap Engine [AGPro Series]AG Pro Fair Value Gap Engine
OVERVIEW / WHAT IT DOES
AG Pro Fair Value Gap Engine is a rules-based overlay built to detect 3-bar fair value gap structures and organize them as a living imbalance map on the chart.
The script identifies bullish fair value gaps when the current low is above the high from two bars earlier, and bearish fair value gaps when the current high is below the low from two bars earlier. Once detected, each zone is stored, rendered, tracked through time, and updated as price interacts with it.
Instead of stopping at basic FVG detection, this script continues to follow the structure after creation. It monitors whether the gap remains active, whether price returns into it, whether mitigation occurs, how old the structure has become, and how strong or weak that mitigation event appears relative to the gap itself.
The result is not just a visual list of imbalances. It is an FVG lifecycle model designed to help traders distinguish between fresh gaps, aging gaps, mitigated gaps, and higher-quality mitigation events.
UNIQUE EDGE
Many fair value gap tools simply highlight every detected gap and leave the user to interpret the rest.
This script is built around a different idea:
not all FVGs deserve the same attention, and not every mitigation event carries the same informational value.
AG Pro Fair Value Gap Engine separates itself by combining detection, aging, prioritization, mitigation tracking, and scoring in a single structured workflow. Gaps are not treated as static rectangles. They are treated as evolving chart objects with a lifecycle.
Within the AG Pro Series, this script is also distinct from breakout-quality, reclaim, rotation, pressure, or acceptance-style overlays. Those models focus on trend behavior, reclaim behavior, structural confirmation, momentum pressure, or price acceptance around a reference. This one is centered on imbalance structure itself: where the 3-bar gap formed, how long it stayed relevant, whether price returned, and how credible that mitigation looked once interaction happened.
In practical terms, the script is designed to answer questions such as:
Which FVGs are still active?
Which ones are becoming stale?
Which mitigation events happened with better quality?
Which visible zones are worth keeping in focus, and which are just legacy context?
That is the core difference. This is not a generic FVG highlighter. It is an imbalance-ranking and mitigation-quality engine.
METHODOLOGY
1) Detection Logic
The script scans for standard 3-bar fair value gap structures.
Bullish FVG:
current low > high from two bars back
Bearish FVG:
current high < low from two bars back
A minimum size filter relative to ATR is applied so that very small gaps can be ignored when desired.
2) Structure Tracking
After detection, each FVG is stored and tracked over time. The script keeps the zone on the chart, extends active zones forward when enabled, and updates their visual state as the market evolves.
This allows the chart to preserve the structural memory of imbalance zones instead of treating every new gap as an isolated event.
3) Aging and Visual Decay
Older gaps gradually lose visual priority through fade logic. This helps newer or more relevant structures stay readable while old zones move into the background.
Optional controls can also suppress distant legacy zones when they become both old and far from current price.
4) Mitigation Logic
The script monitors how deeply price returns into each gap. When the user-defined mitigation threshold is reached, the FVG is marked as mitigated.
Mitigated zones can remain visible as context or be hidden for a cleaner chart, depending on preference.
5) Quality Scoring
Mitigation is not treated as a simple yes/no event. The script evaluates mitigation quality using a weighted model that includes:
- Gap size relative to ATR
- Speed of return into the zone
- Relative volume during the mitigation event
- Return strength after contact with the gap
This produces a normalized score intended to help separate weaker fills from stronger, better-formed mitigation behavior.
6) Focus and Prioritization
To reduce chart noise, the script includes focused labeling, active-zone prioritization, top-zone filtering, and legacy suppression logic.
This means the visual output can be tuned away from “show everything” and toward “show what matters most.”
SIGNALS & ALERTS
This script provides alert conditions for:
- Newly detected bullish fair value gaps
- Newly detected bearish fair value gaps
- Bullish fair value gaps reaching mitigation
- Bearish fair value gaps reaching mitigation
These alerts are event-based and rules-based. They are not forecasts, predictions, or trade instructions.
The labels and panel are designed to summarize state, not to replace the user’s broader market process.
KEY INPUTS
Core Settings
- Minimum FVG Size (ATR)
- Mitigation Threshold (%)
- Maximum Tracked FVG Count
- Age Fade Length
- Extend Active FVG Boxes
Scoring Engine
- Speed Score Reference
- Volume Score SMA Length
- Volume Score Max Ratio
- Size Score Max ATR
Visual Settings
- Show FVG Labels
- Focused Label Mode
- Focused Label Minimum Score
- Active / Mitigated Label Age Limits
- Highlight Score Threshold
- Theme Preset
- Show Mitigated Zones
- Show Mitigated Zone Labels
- Label Horizontal Offset
- Hide Distant Legacy FVGs
- Legacy Hide Age
- Legacy Hide Distance
- Show Only Top Active Zones
- Top Active Zones Count
- Label Stack Spacing
Panel Settings
- Show Panel
- Panel Position
- Panel Font Size
These controls allow the same logic to be used in a more information-dense mode or in a much cleaner presentation mode, depending on the charting style of the user.
LIMITATIONS & TRANSPARENCY
This script detects and organizes 3-bar imbalance structures. It does not claim to identify every meaningful liquidity event, order-flow shift, or broader smart money context factor on its own.
A fair value gap can remain open for a long time, fail quickly, or be revisited multiple times. A high score does not guarantee a directional outcome. A low score does not automatically invalidate the zone as context.
The mitigation score is a structured ranking model, not an objective truth about future price behavior. It is designed to help compare events inside the framework of this script.
Because chart structure, volatility, timeframe, and instrument behavior vary, users should expect different FVG densities and different score distributions across markets.
This tool is best used as a market-organization layer for imbalance analysis, not as a standalone execution system.
RISK DISCLOSURE
AG Pro Fair Value Gap Engine is an analytical charting tool for educational and informational use.
It does not provide financial advice, does not promise outcomes, and should not be interpreted as a standalone buy or sell system. Fair value gaps, mitigation events, and score readings should be evaluated together with market structure, volatility, timeframe context, liquidity conditions, and the user’s own risk framework.
Trading involves risk. Past chart behavior does not guarantee future results.
Indicator
AG Pro Liquidity Sweep Quality [AGPro Series]AG Pro Liquidity Sweep Quality
OVERVIEW / WHAT IT DOES
AG Pro Liquidity Sweep Quality is a pivot-based overlay designed to map bullish and bearish liquidity sweep events around confirmed swing highs and swing lows. Instead of only flagging whether price traded beyond a prior level, the script evaluates whether that move behaved like a meaningful rejection or a weak sweep. The result is a structured liquidity sweep indicator that focuses on sweep quality, not only sweep detection.
In practical terms, the script looks for price moving above a prior swing high or below a prior swing low and then closing back through that level on the same bar or, if enabled, on the next bar. This behavior is commonly associated with stop hunts, failed breakout attempts, failed breakdown attempts, and short-term rejection events around visible liquidity. The script then ranks the event using a multi-factor quality model so the chart does not treat every sweep as equally important.
This makes the tool relevant for traders studying liquidity sweep behavior, smart money concepts, ICT-style chart reading, rejection anatomy, wick-driven reversals, sweep confirmation, and swing-based context. It is not built to predict direction on its own. It is built to organize sweep events so users can distinguish weaker noise from stronger rejection structures.
UNIQUE EDGE
The main objective of this script is not to publish another generic liquidity grab marker. Its edge comes from the fact that it scores each confirmed sweep using a quality framework. That framework combines how deeply price traded through the level, how decisively it closed back beyond the level, the wick-to-body relationship of the sweep bar, relative volume behavior, swing freshness, nearby swing crowding, and optional higher-timeframe bias alignment.
This matters because many sweep-style tools stop at a binary answer:
sweep happened / sweep did not happen.
This script asks a more useful follow-up question:
how good was that sweep?
That distinction is important on real charts. Some liquidity sweeps show strong rejection, clean close-back behavior, fresh structure, and supportive context. Others are simply noisy level violations inside a crowded area. By assigning a quality score, the script is designed to help users compare sweep events with more nuance.
Another distinguishing feature is that the script separates watch conditions from qualified conditions. A level can first be challenged, then either reclaim cleanly or fail to reclaim. This helps reduce the tendency to treat every level breach as a reversal event.
METHODOLOGY
1) SWING DETECTION
The script uses confirmed pivot highs and confirmed pivot lows as its structural reference points. These pivots are not assumed in advance. They become available only after the user-defined Pivot Strength confirmation process is complete.
2) SWEEP TRIGGER
A bearish sweep scenario begins when price trades above a stored swing high.
A bullish sweep scenario begins when price trades below a stored swing low.
3) QUALIFICATION
A sweep is considered qualified when price closes back through the swept level. By default, the script can evaluate same-bar reclaim behavior and, optionally, next-bar reclaim behavior.
4) QUALITY MODEL
Each qualified sweep is scored using multiple factors, including:
- penetration relative to ATR
- rejection distance back through the level
- wick-to-body ratio
- relative volume versus a recent baseline
- freshness of the swing level
- nearby level crowding penalty
- optional higher-timeframe trend alignment bonus
The final output is normalized into a simple 1 to 10 quality score so chart reading remains fast and visually clean.
5) VISUAL MAPPING
Qualified sweeps can display:
- direction label
- quality score label
- sweep zone box
- dashed memory line at the swept level
- optional chart background tint
- compact minor markers for lower-priority qualified sweeps
This allows the chart to remain informative without forcing every event to carry the same visual weight.
SIGNALS & ALERTS
The script includes deterministic alert conditions for:
- Bull Sweep Trigger
- Bear Sweep Trigger
- Bull Sweep Qualified
- Bear Sweep Qualified
- High Quality Bull Sweep
- High Quality Bear Sweep
A trigger means price challenged the stored liquidity level.
A qualified sweep means price also reclaimed the level according to the script rules.
A high-quality sweep means the final score exceeded the selected threshold.
These states are intended to help users organize workflow and review price behavior. They are not instructions to buy or sell.
KEY INPUTS
Pivot Strength
Controls how swings are confirmed. Higher values generally reduce noise but also make structural detection slower and more selective.
Max Swing Age
Limits how long old swing levels remain eligible. This helps keep the liquidity map focused on fresher structure.
Allow Next-Bar Reclaim
Allows the script to qualify a sweep when the reclaim happens on the next bar instead of only the sweep bar itself.
ATR Length
Used in the quality engine to normalize sweep depth and rejection distance.
Relative Volume Length
Defines the baseline used for volume comparison.
Crowding Width (ATR)
Helps penalize sweeps occurring in dense structural clusters, where nearby levels can reduce interpretive clarity.
Higher Timeframe and HTF EMA Length
Used to build an optional bias filter so aligned sweeps can receive a context bonus.
Min Score For Full Labels
Lets users keep high-information labels on stronger sweeps while weaker qualified sweeps can remain as compact markers.
Same-Side Full Label Cooldown
Reduces repeated full labels in the same direction over a short span, improving chart readability.
LIMITATIONS & TRANSPARENCY
This script is a chart-organization tool, not a stand-alone decision engine.
Because the logic is pivot-based, swing levels are only confirmed after the chosen Pivot Strength delay. That means the structural reference points are confirmed swings, not instantly-known highs or lows.
A liquidity sweep on one market, timeframe, or volatility regime may not behave the same way on another. The scoring framework is designed to rank events relative to the script's own rules, not to certify that a sweep will lead to reversal or continuation.
Higher relative volume may improve context, but volume confirmation does not guarantee outcome quality.
The higher-timeframe alignment feature is a contextual filter. It should not be interpreted as a macro trend forecast.
Like any visual overlay, this tool can produce signals in choppy or highly reactive conditions that later prove less useful than they first appeared. Parameter selection matters.
WHAT THIS SCRIPT IS NOT
This script is not a promise of reversal.
It is not a complete smart money framework.
It is not a substitute for execution planning, risk management, or broader market context.
It does not claim to detect institutional intent.
It does not classify every level break as tradable.
Instead, it focuses on one specific chart behavior:
sweep-and-reclaim quality around confirmed swing liquidity.
RISK DISCLOSURE
This indicator is for analytical and educational use only. It does not provide financial advice, investment advice, or guaranteed trade outcomes. Markets can remain irrational, trend aggressively, or ignore local sweep signals for extended periods. Users should validate any chart workflow with their own process, risk controls, and market understanding before acting on any signal or alert.
If you use this tool, it is generally best treated as a structural filter inside a broader workflow rather than as a stand-alone trigger.
AGPro Series note:
This publication is designed to emphasize structured chart reading, deterministic event definitions, and transparent methodology over promotional claims or outcome promises.
Indicator

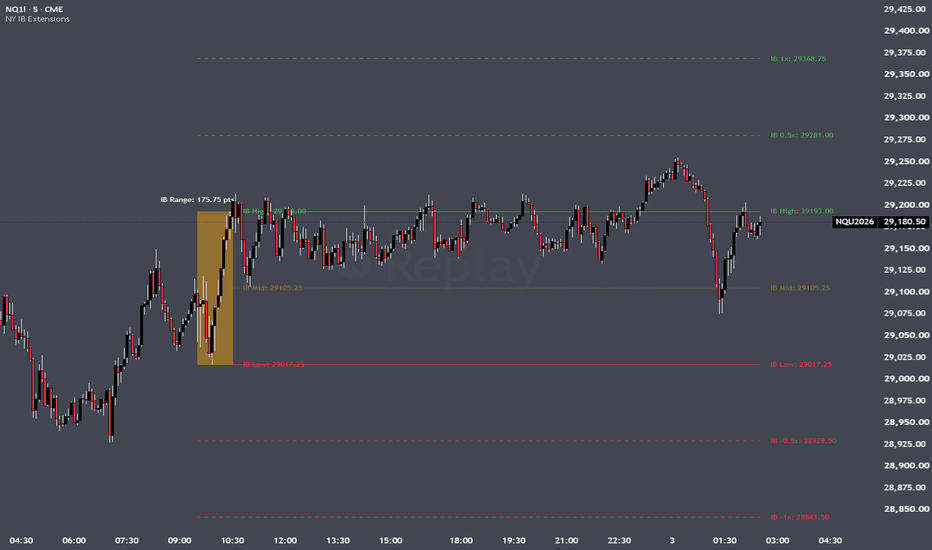
Sessions Suite [claysul]Sessions Suite plots market sessions, previous day/week/month levels, daily/weekly/monthly open prices, customizable open prices, day of the week separator, and 90m cycles. Every feature can be toggled independently, with full customization over session times, labels, lines, and colors. All session times use the America/New_York timezone and automatically adjust for daylight savings time.
Sessions:
- Shaded session boxes are drawn for up to 5 fully customizable sessions. Defaults include Asia (6:00–12:00 AM EST), London (12:00–6:00 AM), NY AM (6:00 AM–12:00 PM), NY PM (12:00–6:00 PM), and NY Lunch (off by default). Each session's name, time range, and color are editable.
- Toggle session boxes on/off independently from lines and labels, allowing you to show only the high/low lines without the shaded boxes.
- Toggle session borders on/off.
- Optional max days limit to control how many days of session boxes are displayed.
Session boxes toggled off, with high and low set to max 1 day:
Mitigation:
Session high/low lines extend forward until price mitigates/touches the level, or until end of day.
- Option to extend unmitigated lines to the current bar, instead of stopping at EOD.
- Option to remove mitigated lines entirely. When enabled, lines and their labels are deleted from the chart once price reaches the level.
Session lines default to EOD:
Unmitigated session lines extended to current bar:
Mitigated lines removed (Extend Unmitigated Lines to Current Bar must be enabled):
Session Lines:
Horizontal lines drawn at each session's high and low. Customizable width, style (solid/dashed/dotted), and optional unified line color override if the user wants all lines to be one color. Optional max days limit to control how many days of lines and labels are displayed.
Session Labels:
Session labels mark the high and low of each session by default. There are 2 mode alignments: "Right of Line," where labels are placed on the right of high/low lines, or "Centered (Box)," where they are centered to the session box. Label placement can be set to "Above Line" (both labels above) or "Above / Below Line" (high labels above, low labels below). The user can choose to display high and low labels, high only, or low only. Label size is adjustable, and an optional unified color override if the user wants all labels to be one color.
Labels to right of line:
Labels centered to session box:
Labels centered, high only placement:
Session lines, no labels, no borders:
Label placement set to above/below line:
Previous Day, Week, and Month Levels:
- PDH / PDL- Previous Day High and Low, drawn from the bar where the high/low occurred.
- PD EQ- Previous Day Equilibrium (midpoint of PDH and PDL).
- PWH / PWL- Previous Week High and Low.
- PMH / PML- Previous Month High and Low.
Each level can be turned on/off, and the option to change color and line style. All levels extend to the right with labels.
Opening Prices:
Horizontal lines are drawn at key opening prices:
- Daily Open- resets each new trading day.
- Weekly Open- resets each new week.
- Monthly Open- resets each new month.
- 3 Custom Opens- fully configurable by hour and minute (EST). Defaults: 09:30 (market open), 00:00 (midnight), and 16:00 (RTH market close). Each have options to customize color, style, and turn on/off.
Day of Week Separator:
Optional vertical separator lines at the start of each trading day with day-of-week labels (MON, TUE, WED, THU, FRI). Configurable label color, separator color, position (top/bottom), and number of days to display.
90 Minute Cycles:
Shaded blocks that divides each of the four main sessions into 90 minute quarters based on Quarterly Theory:
- Asia Q1–Q4 (Q1: 6:00 - 7:30 PM EST, Q2: 7:30 - 9:00 PM, Q3: 9:00 - 10:30 PM, Q4: 10:30 PM - 12:00 AM
- London Q1–Q4 (Q1: 12:00 - 1:30 AM EST, Q2: 1:30 - 3:00 AM, Q3: 3:00 - 4:30 AM, Q4: 4:30 - 6:00 AM)
- NY AM Q1–Q4 (Q1: 6:00 - 7:30 AM EST, Q2: 7:30 - 9:00 AM, Q3: 9:00 - 10:30 AM, Q4: 10:30 AM - 12:00 PM)
- NY PM Q1–Q4 (Q1: 12:00 - 1:30 PM EST, Q2: 1:30 - 3:00 PM, Q3: 3:00 - 4:30 PM, Q4: 4:30 - 6:00 PM)
Toggle all quarters on/off with a single checkbox. Each quarter's name, time range, and box color are individually customizable. Options to change label size and toggle on/off cycle borders, labels, and unified label color override. Optional max days limit to control how many days of cycles are displayed.
Timeframe Awareness:
The indicator automatically adapts to higher timeframes:
- Intraday- shows everything: sessions, session lines, session labels, 90 minute cycles, PDH/PDL/PD EQ, PWH/PWL, PMH/PML, all opening prices, day of week separators, and custom opens.
- Daily- shows PDH/PDL/PD EQ, PWH/PWL, PMH/PML, and Daily/Weekly/Monthly opens.
- Weekly- shows Weekly and Monthly opens only.
- Monthly- shows Monthly open only. Indicator

Indicator

Indicator

Indicator
Indicator

Bastion Level Sentinel [JOAT]Bastion Level Sentinel
Introduction
The Bastion Level Sentinel is an open-source dynamic support and resistance overlay that derives price levels from EMA rounding, then builds conviction scores through touch-based strength analysis with optional volume confirmation. Rather than drawing static horizontal lines at arbitrary prices, BLS rounds an EMA to a configurable price increment (e.g., 500, 1000) to identify the institutional-grade price rails that the market naturally gravitates toward. Each time price interacts with a rail, the indicator counts and classifies the touch — validated (with above-average volume) or unconfirmed (low volume) — and uses these counts to build a conviction score that drives the visual intensity of the level through color gradients.
Most support/resistance indicators either use fixed pivot points that become stale, or they require manual drawing. BLS automates the process by anchoring levels to a moving EMA foundation, resetting touch counts when levels shift, and providing a complete lifecycle view of each level — from nascent (newly formed) through seasoned to ancient. The conviction engine ensures that levels with more validated touches appear visually stronger, giving traders an immediate sense of which levels carry the most institutional weight.
Core Engine: Level Derivation
The level calculation is straightforward but effective:
float emaVal = ta.ema(close, emaLen)
float topLvl = roundVal * math.ceil(emaVal / roundVal)
float botLvl = roundVal * math.floor(emaVal / roundVal)
The EMA provides a smoothed price anchor. Rounding up to the nearest increment gives the ceiling rail (resistance), and rounding down gives the floor rail (support). The grid increment is fully configurable — use 500 for crypto, 50 for stocks, 10 for forex — allowing the indicator to adapt to any instrument's natural price structure.
A stability check ensures that levels are only considered active when they remain unchanged from the previous bar. This prevents false touch counts during level transitions.
Conviction Engine (Touch-Based Strength Scoring)
The conviction engine is the heart of BLS. Every time price enters a rail's proximity zone (defined by a configurable tolerance fraction of the level gap), a touch is registered. Touches are edge-triggered — only the first bar of each interaction counts, preventing a single extended visit from inflating the score.
When volume confirmation is enabled, touches are classified into two categories:
Validated Touches: Price interacts with the rail while short-term volume exceeds the configurable threshold (default 1.2x average). These carry 70% weight in the conviction score.
Unconfirmed Touches: Price interacts with the rail on below-average volume. These carry 30% weight — they still count, but with reduced conviction.
The conviction score scales from 0% to 100% based on the number of touches relative to the saturation threshold (default 5 touches for 100%). When levels shift (the EMA moves enough to change the rounded level), all touch counts reset to zero, and the lifecycle begins fresh.
Level Lifecycle and Maturity
Each rail tracks its age in bars since the last level shift:
NASCENT: Fewer than 50 bars old — newly formed level, conviction still building
SEASONED: 50-200 bars old — established level with meaningful touch history
ANCIENT: Over 200 bars old — long-standing level that has persisted through extended price action
Ancient levels with high conviction scores represent the strongest support/resistance zones — they have been tested repeatedly over a long period and have held.
Visual Architecture
Primary Rails: Ceiling and floor levels plotted with conviction-driven color gradients. Low conviction = neutral purple, high conviction = vivid red (resistance) or green (support). The color intensity directly communicates level strength.
Proximity Halos: Tolerance zone boundaries around each rail, filled with transparency that scales with conviction. Stronger levels have more visible halos.
Equator Line: The midpoint between ceiling and floor — a natural equilibrium reference.
Tertiary Gridlines: 25% and 75% sub-levels between the rails, providing additional structure within the grid.
Proximity Aura: Subtle background tint when price enters a rail's tolerance zone — immediate visual alert that price is near a significant level.
Grid Tint Candles: Candles colored by their position within the grid — red tones near the ceiling, green tones near the floor, purple at the equator.
Signal Architecture
BLS generates five distinct signal types, all confirmed-bar and edge-triggered:
RAIL LOCK (Validated Touch): Price interacts with a rail on confirmed volume. The label includes the running touch count. These are the highest-confidence interaction signals.
ECHO (Unconfirmed Touch): Price interacts with a rail but volume is below the confirmation threshold. The interaction is noted but flagged as lower confidence.
BREACH: Price closes beyond a rail — a potential breakout (ceiling) or breakdown (floor). These are edge-triggered crossover/crossunder signals.
APPROACH: Price enters a rail's proximity zone for the first time — an early warning that an interaction is imminent.
Conviction Pulse: Periodic labels on the rails (every 20 bars) showing the current conviction percentage, providing at-a-glance strength information without cluttering the chart.
// Edge-triggered touch detection
bool topTouchEdge = topTouch and not topTouch
bool botTouchEdge = botTouch and not botTouch
Command Panel (Dashboard)
An 11-row monospace dashboard displays:
CEILING: Current resistance rail price
C CONV: Ceiling conviction — validated/total touches with percentage (e.g., "3v/4t (85%)")
FLOOR: Current support rail price
F CONV: Floor conviction — validated/total touches with percentage
EQUATOR: Midpoint price between ceiling and floor
NEAREST: Which rail price is closest to, with distance as a percentage
GRID POS: Price position classification (Ceiling Zone, Upper Grid, Equator, Lower Grid, Floor Zone)
MATURITY: Lifecycle stage of each rail (Nascent, Seasoned, Ancient)
LOCKED: Whether each rail is currently stable (unchanged from previous bar)
FLUX: Current volume confirmation ratio — values above the threshold indicate "hot" volume
Input Parameters
Fortress Grid:
Lattice Anchor: EMA period for level derivation (default 21)
Grid Increment: Price rounding value (default 500) — adjust for your instrument
Proximity Radius: Fraction of level gap used as tolerance zone (default 0.15)
Tertiary Gridlines: Toggle 25%/75% sub-levels
Conviction Engine:
Conviction Saturation: Touches needed for 100% conviction (default 5)
Flux Validation: Require above-average volume for validated touches (default on)
Flux Threshold: Volume ratio required for validation (default 1.2x)
Optics Layer:
Individual toggles for: Primary Rails, Proximity Halos, Equator Line, Command Panel, Proximity Aura, Breach Flash, Conviction Pulse, Approach Beacon, Grid Tint Candles
How to Use This Indicator
Adjust the Grid Increment to match your instrument — 500 or 1000 for BTC, 50 or 100 for stocks, 10 or 25 for forex pairs. The goal is to identify the round-number levels that institutional orders cluster around.
Pay attention to conviction scores — rails with 80%+ conviction and SEASONED or ANCIENT maturity are the strongest levels. Expect significant reactions when price approaches them.
RAIL LOCK signals with high touch counts indicate levels that have been tested and held multiple times. These are prime candidates for bounce trades.
BREACH signals mark potential breakouts. A breach of a high-conviction rail is more significant than a breach of a low-conviction one.
Use APPROACH signals as early warnings to prepare for potential level interactions. They give you time to assess the setup before the actual touch occurs.
The Grid Position metric in the dashboard tells you where price sits within the current structure — useful for bias determination and risk assessment.
Limitations
EMA-derived levels are inherently lagging — they reflect where the market has been, not where it is going. Levels shift when the EMA moves enough to change the rounded value.
The rounding approach works best on instruments with natural round-number psychology (crypto, indices, large-cap stocks). It may be less effective on instruments without clear round-number clustering.
Touch counts reset when levels shift, which means conviction history is lost during transitions. This is by design (stale counts on new levels would be misleading) but means newly formed levels always start at zero conviction.
Volume confirmation depends on reliable volume data. Instruments with inconsistent volume reporting may produce unreliable validation classifications.
The indicator identifies levels and measures their strength but does not predict whether price will bounce or break through. That decision requires additional context.
Originality Statement
This indicator is original in its conviction-based level strength scoring approach. While EMA-derived support/resistance and touch counting are known concepts individually, BLS is justified because:
The conviction engine differentiates between volume-validated and unconfirmed touches, weighting them differently to produce a more meaningful strength score than simple touch counting.
Level lifecycle tracking (Nascent/Seasoned/Ancient) provides temporal context that static level indicators lack.
Conviction-driven color gradients using color.from_gradient create an immediate visual hierarchy where stronger levels are visually more prominent.
The proximity halo system with conviction-scaled transparency provides zone-based level visualization rather than single-line levels.
Edge-triggered touch detection with stability checks prevents false counts during level transitions and extended visits.
The comprehensive dashboard presents level prices, conviction breakdowns, maturity, grid position, and volume state simultaneously.
Five distinct signal types (Rail Lock, Echo, Breach, Approach, Conviction Pulse) provide a complete interaction vocabulary for level-based analysis.
Disclaimer
This indicator is provided for educational and informational purposes only. It is not financial advice. Support and resistance levels describe historical price interaction zones but do not guarantee future reactions. Levels can and do break. Always use proper risk management and conduct your own analysis before making trading decisions. The author is not responsible for any losses incurred from using this tool.
-Made with passion by officialjackofalltrades
Indicator

Indicator

Indicator

Indicator

SR Breakout Arrows# SR Breakout Arrows - Documentation
> **Version**: v1.0
> **Author**: jeffprotrader168
> **Pine Script Version**: v6
> **License**: Mozilla Public License 2.0
---
## 📊 Overview
A fractal-based Support/Resistance breakout detection indicator. Uses `ta.pivothigh` / `ta.pivotlow` to identify local highs and lows as S/R levels, then signals with arrows when price breaks through these levels. Features optional RSI/CCI filtering and anti-repaint protection. Works on all markets and timeframes.
Ported from MQL4 (originally by Barry Stander 2004 / Lennoi Anderson 2015 / rewritten by Jeff Reed).
---
## 🎯 Key Features
- **Fractal-based S/R Detection**: Confirms fractals with 2 bars on each side, auto-extends horizontal lines until next fractal
- **Breakout Arrow Signals**: Draws triangle arrows below/above bars when close breaks S/R levels
- **Anti-Repaint Guarantee**: Signals only confirmed after bar close by default; historical arrows never disappear
- **RSI/CCI Filtering**: Optional dual-filter to reduce false breakouts
- **Deduplication**: Each S/R level triggers only one signal, preventing consecutive duplicate arrows
- **Bilingual Interface**: English / Traditional Chinese toggle
- **Full Color Customization**: S/R lines and arrow colors are fully configurable
---
## ⚙️ Configuration
### ⚙️ Basic Settings
| Parameter | Default | Description |
|-----------|---------|-------------|
| `i_language` | EN | Language selection (EN / Traditional Chinese) |
### 📊 Signal Settings
| Parameter | Default | Range | Description |
|-----------|---------|-------|-------------|
| `i_signal_dots` | 3 | | Minimum bars after fractal before breakout is valid; higher = more conservative |
| `i_apply_to_close` | true | — | When enabled, signals only appear after bar closes (anti-repaint) |
### 🔍 RSI/CCI Filter
| Parameter | Default | Range | Description |
|-----------|---------|-------|-------------|
| `i_rsicci_filter` | false | — | Enable RSI+CCI dual filtering |
| `i_rsi_period` | 14 | | RSI calculation period |
| `i_rsi_overbought` | 75.0 | — | RSI overbought level (buy signals require RSI below this) |
| `i_rsi_oversold` | 25.0 | — | RSI oversold level (sell signals require RSI above this) |
| `i_cci_period` | 14 | | CCI calculation period |
| `i_cci_buy_level` | 50.0 | — | CCI buy threshold (buy signals require CCI above this) |
| `i_cci_sell_level` | -50.0 | — | CCI sell threshold (sell signals require CCI below this) |
### 🎨 Display
| Parameter | Default | Description |
|-----------|---------|-------------|
| `i_show_arrows` | true | Show breakout arrows |
| `i_show_sr_lines` | true | Show S/R extension lines |
| `i_res_color` | Red | Resistance line color |
| `i_sup_color` | Blue | Support line color |
| `i_arrow_up_color` | Blue | Breakout up arrow color |
| `i_arrow_dn_color` | Magenta | Breakout down arrow color |
---
## 📈 Visual Elements
### Chart Elements
- **Resistance Line** (red stepline): Extends horizontally from upper fractal high until a new upper fractal appears
- **Support Line** (blue stepline): Extends horizontally from lower fractal low until a new lower fractal appears
- **Breakout Up Arrow** (blue triangle ▲ + BUY): Below the breakout bar, indicating bullish breakout
- **Breakout Down Arrow** (magenta triangle ▼ + SELL): Above the breakout bar, indicating bearish breakout
### Color Scheme
| Element | Default Color | Description |
|---------|--------------|-------------|
| Resistance Line | Red | Current resistance level |
| Support Line | Blue | Current support level |
| Breakout Up Arrow | Blue | Resistance Breakout: BUY |
| Breakout Down Arrow | Magenta | Support Breakout: SELL |
---
## 🔔 Alert Conditions
### Alert 1: SR Breakout: BUY
**Trigger Condition**: Close price breaks above resistance level (all filter conditions passed)
**Message Format**: `{ticker} Resistance Breakout: BUY at {close} ({interval})`
### Alert 2: SR Breakout: SELL
**Trigger Condition**: Close price breaks below support level (all filter conditions passed)
**Message Format**: `{ticker} Support Breakout: SELL at {close} ({interval})`
### Alert 3: SR Breakout: Any
**Trigger Condition**: Any direction breakout signal
**Message Format**: `{ticker} S/R Breakout at {close} ({interval})`
---
## 💡 Usage Tips
1. **Best Timeframes**: M15 to H4; fractals are more reliable on higher timeframes
2. **Complementary Indicators**: Pair with trend indicators (MA, ADX) to confirm breakout direction
3. **Trading Hours**: Avoid low-liquidity sessions (e.g., late Asian session) where breakout quality is lower
4. **Risk Management**: Arrows are entry references; combine with fixed or ATR-based stop-loss
### Suggested Configurations
**Conservative** (fewer false breakouts):
```
i_signal_dots = 5
i_rsicci_filter = true
i_rsi_overbought = 70, i_rsi_oversold = 30
```
**Aggressive** (fast reaction):
```
i_signal_dots = 1
i_rsicci_filter = false
```
**Balanced** (recommended default):
```
i_signal_dots = 3
i_rsicci_filter = false
i_apply_to_close = true
```
---
## 🔍 Technical Details
### Algorithm Explanation
The indicator follows a three-step process:
**Step 1: Fractal Detection**
Uses `ta.pivothigh(high, 2, 2)` and `ta.pivotlow(low, 2, 2)` to detect local highs and lows. Requires 2 bars on each side for confirmation, consistent with the classic fractal definition. When a fractal is detected, the corresponding S/R level is updated and the bar counter resets.
**Step 2: S/R Extension and Counting**
Each bar increments the counter until a new fractal resets it. The counter ensures breakouts occur sufficiently far from the fractal (`>= i_signal_dots`), avoiding false signals near the fractal point.
**Step 3: Breakout Detection**
When close price exceeds the S/R level, the counter meets the threshold, and the level hasn't been broken before, a breakout signal fires. Optional RSI/CCI filtering further screens low-quality breakouts.
### Anti-Repaint Mechanism
| Layer | Mechanism | Description |
|-------|-----------|-------------|
| 1 | `barstate.isconfirmed` gate | Only evaluates breakout after bar close |
| 2 | `var` persistence | State accumulates bar-by-bar; historical results are fixed |
| 3 | `last_broken_res/sup` dedup | Each S/R value triggers only once |
### Performance Considerations
- All visuals use `plot()` / `plotshape()` — no dynamic drawing object limits
- RSI/CCI computed once per bar, referenced via function to avoid redundant calls
---
## 📝 Version History
| Version | Date | Changes |
|---------|------|---------|
| v1.0 | 2026-04-03 | Initial release: full port from MQL4 to Pine Script v6 |
---
## 📌 FAQ
### Q1: How does this differ from the MQL4 version?
A: Core logic (fractal → S/R → breakout) is identical. The Pine version removes MQL4-specific GlobalVariable persistence (Pine auto-recalculates all history on load), arrow symbol codes (replaced with `plotshape`), and notification channel toggles (managed by TradingView platform). Adds color customization and bilingual interface.
### Q2: Why are some breakouts missing arrows?
A: Possible reasons: (1) `i_signal_dots` is set too high — not enough bars since fractal; (2) RSI/CCI filter is enabled but conditions aren't met; (3) The S/R level was already triggered by a previous breakout (dedup mechanism).
### Q3: Can both up and down arrows appear on the same bar?
A: Yes. Up and down breakouts are evaluated independently, allowing simultaneous signals in extreme market conditions.
### Q4: What happens with `i_apply_to_close = false`?
A: The latest unconfirmed bar participates in breakout evaluation, which may cause arrows to appear then disappear (repainting). Recommended to keep the default value `true`.
---
## 📞 Support & Feedback
For any questions or suggestions about this indicator, please feel free to open an Issue or Discussion.
---
*Last Updated: 2026-04-03*
Indicator

Indicator
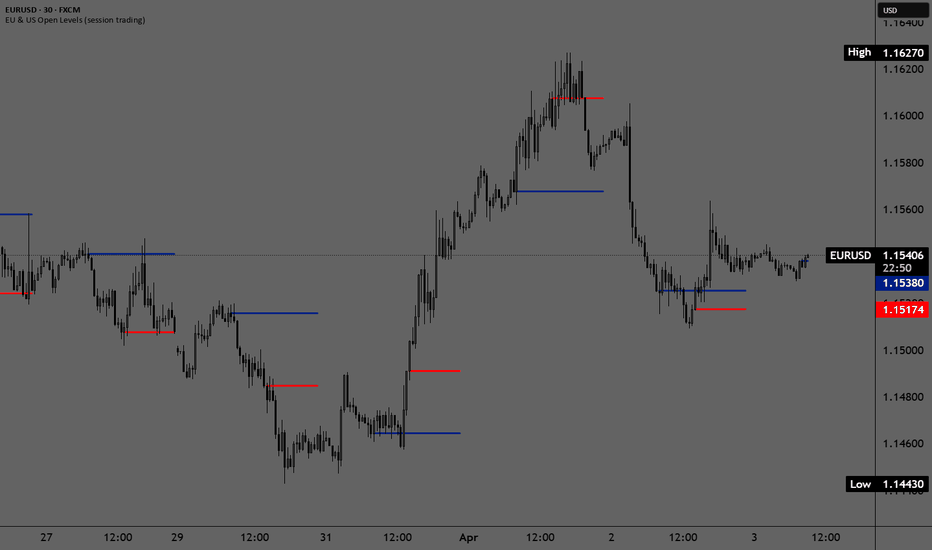
Chandelier Exit Oscillator + State MappingAt its core, this script is built on a Chandelier Exit-style ATR stop-and-flip engine. The difference is that instead of leaving that framework only in price space, this indicator converts the active side and the opposite-side extension into a normalized oscillator. In other words, this takes the same Chandelier Exit structure that can define trend state and stretch on a chart, then re-expresses that structure in a separate pane so it can be read in a different way. Rather than only asking where price is relative to a trailing stop, this script asks where price is progressing inside the current active-to-extension range and how that progression is behaving.
That is what makes this more than a standard Chandelier Exit view. It does not just plot a stop and a flip. It takes the current main multiplier structure, builds a directional channel from the active side to the opposite-side extension, and maps that channel into oscillator space. That creates a normalized way to read state, stretch, and internal zone behavior across both bullish and bearish conditions.
The script includes two mapping modes.
1) Geometry mode preserves the channel relationship more literally:
active level = -100
midpoint = 0
extension = +100
2) State-Weighted mode keeps the same Chandelier framework but biases the oscillator by active direction, so bullish regimes tend to live above 0 and bearish regimes tend to live below 0. In that mode, 0 behaves less like a simple midpoint and more like a directional boundary.
From there, the script adds three secondary Chandelier Exit multipliers, which by default are 2.5, 5.0, and 7.5. These are not separate indicators bolted onto the script for the sake of adding features. They are additional Chandelier Exit branches derived from the same underlying ATR stop-and-flip logic. Their active levels are remapped into the same oscillator space so they can act as internal zone references inside the broader main channel.
That matters because not every move waits until a full extension is reached before reacting. Sometimes price begins to stall, react, or accelerate from a smaller internal multiplier zone first. These secondary CE layers help organize that behavior into a readable internal structure instead of forcing everything to be judged only from the full outer stretch.
The script also gives multiple ways to view the same oscillator state. You can keep it simple with the main oscillator line, or display histogram columns, synthetic oscillator candles, guide rails, and extreme zones. There is also an optional price-overlay candle mode, which colors the chart candles using the same oscillator color engine so the chart view and pane view remain visually connected.
To help with context, the script also includes:
➖an HTF oscillator reference line
➖an oscillator volume-weighted average
➖adaptive fast/slow crossover lines
➖a standalone SMA 20/50 crossover engine
➖a current-state table
➖optional alerts for zero-line crosses and adaptive fast/slow crosses
These features are there to help interpret the same core Chandelier Exit structure in oscillator form. They are not separate systems with separate foundations. The main idea stays consistent throughout the script: use a CE-style ATR framework as the base, then translate it into a pane-based state and extension model that is easier to compare, normalize, and monitor over time.
A practical way to read it:
➡️ In a bullish state, the active main CE side becomes the lower anchor and the opposite-side extension becomes the upper anchor. The oscillator shows how far price is progressing through that structure.
➡️ In a bearish state, the structure flips. The active main CE side becomes the upper anchor and the opposite-side extension becomes the lower anchor.
➡️ The secondary CE multiplier zones help show where internal support/resistance-style reaction areas may begin to matter before price reaches the full outer stretch.
➡️ In Geometry mode, 0 is the midpoint of the mapped channel. In State-Weighted mode, 0 behaves more like a directional dividing line between bullish and bearish conditions.
One of the main reasons I made this was to create a true companion to my overlay script, Chandelier Exit Reaction Zones + Fib Levels. That script keeps the structure directly on price. This oscillator takes the same general Chandelier Exit framework and expresses it in normalized pane form. Used together, the overlay script helps show where the structure sits on the chart, while this oscillator helps show how price is progressing through that same structure, how internal zones are behaving, and whether the move still looks orderly inside the current channel. They work well as a package because one gives the price-space view and the other gives the pane-space view of the same broader idea.
This is not meant to predict reversals by itself, and it is not intended to be treated as a standalone signal machine. The way I use it is more practical:
➖to frame where price is stretched
➖to judge whether price is still progressing through the current CE channel or starting to stall
➖to see whether the move is only testing an internal multiplier zone or approaching a full extension
➖to compare current oscillator behavior against HTF context and crossover behavior
Bar Replay is especially useful here. Watching the script one bar at a time makes it much easier to see how the CE state flips, how the oscillator remaps around those flips, and when the internal multiplier zones begin to matter before a larger stretch is completed.
Like the companion overlay version, this works best with confluence. Volume, RSI, structure, trend context, support/resistance, and broader market conditions can all help decide whether an extended move is more likely to continue, react, or fully reverse. The value of this script is not that it replaces those tools. The value is that it gives the Chandelier Exit framework a second, more normalized expression that can make state, extension, and internal zone behavior easier to read.
A few examples showing bullish and bearish charts:
Indicator

HTA - OPENHTA - OPEN (Opening Ranges & AVWAPs)
Release Notes (Latest Update):
Name Change: Simplified indicator name to HTA - OPEN.
New Asia Session: Added the Asia Opening Range and Start of Asia Session AVWAP (Defaulted to 18:00 EST to align with the CME Globex futures open).
"Extend Lines" Toggle: Added the ability to choose whether your opening range lines extend infinitely across the chart, or if they automatically stop drawing when the session ends to keep your chart clean.
UI Overhaul: Completely reorganized the settings menu. Session AVWAPs are now cleanly grouped together, and default color opacities have been optimized for better visibility.
About HTA - OPEN
The HTA - OPEN indicator is an all-in-one intraday tool designed to automatically map out key liquidity periods, session opening ranges, and dynamic volume-weighted average prices (AVWAPs). It is built to keep your charts clean while providing critical levels for the New York, London, and Asia sessions.
Key Features:
1. Automated Opening Ranges
The script automatically draws the high and low of the opening minutes for major sessions. Each session is highly customizable, allowing you to change line styles, colors, fill opacity, and toggle text labels.
New York Session: 09:30 - 09:45 EST
Asia / Globex Session: 18:00 - 18:15 EST
London Session: 03:00 - 03:15 EST
Day Initial Balance: 09:30 - 10:30 EST
2. Session AVWAPs
Automatically anchors a VWAP to the exact start time of your selected sessions, providing a dynamic gauge of intraday trend and institutional average price.
Start of New York Session AVWAP
Start of London Session AVWAP
Start of Asia Session AVWAP
Previous Day's New York Open AVWAP
3. Macro & Day AVWAPs
For broader market context, the indicator can seamlessly plot Higher Timeframe AVWAPs without needing to manually anchor them.
Day AVWAPs: Start of Day, High of Day, Low of Day.
Macro AVWAPs: Start of Month, Start of Year, High of Year.
Customization & Display:
Every range and AVWAP can be toggled on or off individually. The new "Extend Lines" feature gives you complete control over how much historical data remains visible on your chart, ensuring your workspace only shows the data you need for the current session. Indicator
AG Pro Pivot Cluster Survival Map [AGPro Series]AG Pro Pivot Cluster Survival Map
Overview / What it does
AG Pro Pivot Cluster Survival Map is an overlay tool that evaluates the durability of nearby pivot clusters rather than focusing on a single pivot reaction. The script groups Daily, Weekly, and Monthly Classic Pivot levels when they compress into the same price neighborhood, then measures how well that cluster has held up under repeated interaction.
The goal is not to label every pivot touch as strong or weak. The goal is to show whether a pivot-derived zone has continued to absorb pressure, remain structurally relevant, or lose stability over time. This makes the script suitable for users who want to monitor confluence-based pivot structure instead of isolated one-bar reactions.
The visual model is intentionally compact. The script highlights the nearest upper cluster and the nearest lower cluster, assigns a survival score to each side, and displays a pressure readout for the dominant active zone. The result is a map of pivot-cluster durability, not a generic support/resistance overlay and not a simple reaction detector.
Unique Edge
The distinguishing feature of this script is its focus on pivot-cluster survival.
Many pivot tools concentrate on one level at a time. Many reaction tools classify the immediate response after a touch, reclaim, or rejection. This script approaches the problem differently. It asks whether multiple pivot levels from different higher timeframes are compressing into the same zone, and whether that zone is still surviving repeated market interaction.
That difference matters.
This script does not score a single bounce. It does not try to predict a reversal from one isolated pivot event. It evaluates whether a pivot cluster remains durable after tests, inside-zone pressure, breaches, and time spent without structural failure.
Within the AG Pro catalog, this script is materially different from AG Pro Pivot Points Reaction Map. Pivot Points Reaction Map is centered on reaction quality at pivot levels. Pivot Cluster Survival Map is centered on cluster durability, confluence density, and survival under pressure. In other words, one evaluates the response; the other evaluates the staying power of the pivot cluster itself.
It is also different from broader level-survival or support/resistance tools because the source engine here is explicitly pivot-derived. The script is built around Daily, Weekly, and Monthly Classic Pivot families, then transformed into a confluence-survival framework.
Methodology
The current version uses Classic Pivot calculations from higher timeframes.
1. Daily, Weekly, and Monthly pivot levels are collected.
2. Nearby pivot levels are grouped into clusters when they fall within the active cluster width.
3. The script selects the nearest upper cluster and the nearest lower cluster relative to current price.
4. Each selected cluster is evaluated with a survival model.
The survival model is based on factors such as:
- cluster density
- higher-timeframe participation
- repeated tests
- rejection behavior
- inside-zone pressure
- breach frequency
- time since structural failure
A higher survival score suggests that the cluster has remained more durable under recent interaction. A higher pressure reading suggests that the cluster is experiencing more structural stress.
The chart display is intentionally selective. Instead of plotting every pivot line independently, the script concentrates on the nearest relevant clusters and presents them as zones with a backbone line and state label. This is designed to keep the structure readable.
States / Signals
The script uses state-based interpretation rather than directional promises.
Typical state classifications include:
- Stable
- Strengthening
- Balanced
- Under Stress
- Fragile
- Failed
These states are derived from the relationship between survival and pressure. They are meant to describe the condition of the cluster, not to issue a guaranteed trading outcome.
The panel summarizes:
- nearest upper cluster
- nearest lower cluster
- dominant survival side
- cluster pressure
- pivot mix currently included in the model
The script can also generate alert conditions for:
- cluster strengthening
- cluster failure
- cluster reclaim behavior
These alerts are deterministic conditions derived from the script logic. They are informational and should be interpreted within a broader market workflow.
Key Inputs
Pivot Formula
This version is intentionally limited to Classic Pivots in order to keep the clustering and scoring model consistent.
Include Daily / Weekly / Monthly
These settings control which higher-timeframe pivot families are included in the cluster engine.
Cluster ATR Width
Controls how aggressively nearby pivot levels are merged into the same cluster using ATR-based spacing.
Cluster Percent Width
Adds a percentage-based width floor so clusters remain practical across different price scales.
Minimum Levels Per Cluster
Controls how many pivot levels are required before a true cluster is recognized.
Survival Lookback
Defines the observation window used for the durability calculations.
Visual Controls
The script includes settings for cluster visibility, labels, backbone lines, panel location, and font sizes.
Limitations & Transparency
This script is a structural reading tool. It is not a prediction engine.
A high survival score does not guarantee that price will reverse, hold, or trend from that area. A low survival score does not guarantee immediate failure. The values should be read as condition metrics for pivot-derived zones.
Because the script groups pivot levels into clusters, output can vary depending on volatility, symbol characteristics, and timeframe context. On some symbols, one side may show a stronger cluster than the other. On some charts, one side may temporarily rely on a weaker fallback anchor when cluster density is limited.
This script does not attempt to replace market structure analysis, higher-timeframe context, liquidity analysis, or risk management. It is intended to organize pivot confluence into a readable survival framework.
What this script is not:
- not a buy/sell signal engine
- not a guarantee of support or resistance
- not a standalone trade system
- not a future-price prediction model
Risk Disclosure
This script is for chart analysis and decision support only. It does not provide financial, investment, or trading advice. Markets can move unpredictably, and no indicator can eliminate risk.
Users should evaluate signals, states, and cluster conditions together with their own process, timeframe alignment, and risk controls before making any decision.
Indicator

AG Pro Support Resistance Reaction Map [AGPro Series]AG Pro Support Resistance Reaction Map
Overview / What it does
This indicator maps horizontal support and resistance zones from confirmed price structure, then evaluates how price reacts when it returns to those zones. Instead of treating every level touch as equally important, the script focuses on whether the interaction looks constructive, weak, or potentially broken.
The core objective is to make structural reactions easier to read on-chart. Confirmed pivot highs and lows are converted into zones, nearby levels are merged, older levels can expire, and the chart prioritizes the most relevant active zones on each side of price. When price re-enters a zone, the script grades the reaction and can display labels such as Clean Hold, Sharp Reject, Soft Bounce, or Break Confirmed.
This publication is designed as an indicator, not as an execution engine. It does not place trades, predict future returns, or guarantee that a level will hold. Its purpose is to help traders organize structural context and evaluate reaction quality in a more systematic way.
Unique Edge
Support and resistance is a classic concept, so the difference here is not the concept itself but the workflow built around it.
This script is not a generic auto-drawing tool that tries to plot every possible line. It is a reaction map. The emphasis is on how price behaves inside a structural zone, not on covering the chart with as many levels as possible.
The script differs from tools that are primarily centered on pivot formulas, breakout-retest grading, moving-average reclaim logic, or channel structure. Here, the focus is horizontal structural memory and the quality of the live interaction with that memory. In practice, that means the script is trying to answer questions such as:
- Is this support still reacting constructively?
- Is this resistance rejecting cleanly or absorbing pressure?
- Is the latest touch just noise, or is it a more meaningful retest?
- Which nearby intact levels still deserve attention right now?
Another important distinction is the panel logic. The compact panel does not attempt to summarize all historical levels. It highlights the nearest intact support below price and the nearest intact resistance above price, along with their state, raw versus qualified touch count, and the latest recorded reaction.
Methodology
1) Structural level detection
Confirmed pivot highs and lows are used to create horizontal support and resistance zones. The script waits for confirmation rather than guessing unfinished pivots.
2) Zone construction
Each level is converted into a zone using an ATR-based width. This keeps the plotted area adaptable instead of forcing the same fixed width on all markets and all volatility environments.
3) Merge logic
Nearby levels of the same type can be merged when they fall within the selected merge distance. This helps reduce duplication and keeps the map cleaner.
4) Age and visibility control
Older levels can expire, broken levels can be hidden or faded, and the script visually prioritizes the nearest intact zones. This is intended to improve readability rather than preserve every historical level forever.
5) Reaction scoring
When price newly enters a live zone, the script evaluates the interaction using factors such as penetration depth, close location inside or outside the zone, candle body bias, impulse, and whether the touch is the first qualified retest. The result is translated into a reaction label and a quality score.
6) Touch accounting
The script tracks both Raw and Qualified touches. Raw touches represent zone entries. Qualified touches are stricter and require a fresh entry plus cooldown spacing, which helps avoid counting clustered bars as repeated independent retests.
Signals & Alerts
The script can generate labels and alerts around the most important structural interactions.
Main reaction labels:
- Clean Hold
- Sharp Reject
- Soft Bounce
- Break Confirmed
- Failure Risk
Main alert conditions:
- Bullish Level Reaction
- Bearish Level Reaction
- Level Break Confirmed
These labels and alerts are descriptive, not predictive. They summarize the current structural interaction detected by the script. They are not trade instructions and should not be interpreted as a promise of continuation or reversal.
Key Inputs
Levels
- Pivot Strength
- Maximum Active Levels
- Zone Width (ATR Multiplier)
- Merge Distance (ATR Multiplier)
- Level Expiry (bars)
Reaction Engine
- Retest Cooldown (bars)
- First-Touch Bonus
- Keep Broken Levels Visible
Visuals
- Show Reaction Labels
- Show Compact Panel
- Visible Zones Per Side
- Emphasize Nearest Levels
- Show Soft Bounce Labels
- Minimum Label Score
- Minimum Bars Between Side Labels
- Label Stagger (bars)
- Broken Level Fade
- Base Zone Opacity
- Label Offset (ATR)
- Label Size
- Panel Text Size
Panel
- Panel Location
- Panel Theme (Dark / Light)
Limitations & Transparency
- Pivot-based levels are confirmed after the selected pivot strength completes, so the script is intentionally reactive rather than anticipatory.
- Zone width is ATR-based, which means the visual footprint of levels will change with volatility.
- Raw and Qualified touch counts are intentionally different. Qualified touches are filtered by entry logic and cooldown, so they will usually be lower than raw counts.
- The compact panel is selective. It shows the nearest intact support and the nearest intact resistance, not a full inventory of every level on the chart.
- Visibility controls are designed to keep the chart readable. As a result, some valid but lower-priority levels may be de-emphasized or hidden from the main view.
- Support and resistance remains interpretive by nature. No horizontal level works in isolation across all symbols, timeframes, or market regimes.
Risk Disclosure
This indicator is a chart-analysis tool. It is not a broker, a signal service, or an automated trading system. It does not provide investment advice and it does not guarantee that any level will hold, reject, or break in a particular way.
All markets involve risk. Price can invalidate a structural zone quickly, especially during news events, regime shifts, or low-liquidity conditions. Use the script as one part of a broader decision process that includes market context, liquidity conditions, timeframe alignment, and risk management.
Indicator

Indicator

Resistance & Support Dynamic PRO [ChartWhizzperer]Resistance & Support Dynamic PRO | Algorithmic Zones by ChartWhizzperer
The revolution in chart hygiene.
Most support and resistance indicators share a massive flaw: they turn your chart into an unreadable mess of endless lines and boxes within hours. They possess no memory, no filters, and crucially – no logic for self-cleaning.
As a system architect, I developed the Resistance/Support Dynamic™ PRO to solve this problem mathematically. This open-source indicator does not merely draw zones. It evaluates them, ages them, and purges them when they become obsolete.
CORE FEATURES (Why this indicator is different):
Smart Mitigation Protocol (Purge Logic): Once a zone has been breached or chopped by the market too many times, it loses its institutional relevance. The algorithm detects these structural breaks (strikes) and permanently purges the dead zone from the chart. No more ghosting.
Alpha Decay Engine: Nothing lasts forever – especially not in trading. Zones fade over time (transparency scales mathematically with the zone's age). Current hotspots are highly visible, whilst older levels smoothly fade into the background.
Volume Validation: Not every pivot point represents genuine Smart Money. If this filter is active, an S/R zone is only drawn if the origin candle exhibits above-average volume (SMA-verified).
ATR-Based Sizing & Overlap Guard: The thickness of the zones dynamically adapts to market volatility (ATR). Furthermore, the overlap guard prevents new zones from being drawn over existing ones, preventing visual clutter.
Examine the source code: This is not spaghetti code. It is highly efficient, object-oriented Pine Script (v6) featuring clean array management and User-Defined Types (UDTs).
THE BITTER TRUTH OF TRADING (And the next logical step)
This indicator provides you with the ultimate map. It shows you with clinical precision exactly where Smart Money has left liquidity.
However, a map does not pull the trigger. Ask me for more!
Disclaimer
Signals and alerts are provided for informational purposes only and do not constitute financial advice or a recommendation to buy or sell.
Trading involves substantial risk and may result in the total loss of capital. Execution via third-party tools may differ from alerts. Past performance is not indicative of future results. Indicator

Chandelier Exit Reaction Zones + Fib LevelsAt its core, this script is built on a Chandelier Exit-style ATR stop-and-flip engine. The difference is that instead of stopping at a single trailing stop, it expands that framework into a full ladder: the multiplier 10 level becomes the primary anchor, the opposite-side multiplier 10 level becomes the extension anchor, and the space between them is mapped with a fib channel. Optional Chandelier Exit multipliers of 5.0 and 7.5 reaction zones add another layer of context for tracking how price behaves before it reaches the full multiplier 10 stretch.
The main idea is simple: markets often react when price gets extended, but not every extension behaves the same way. Sometimes price reaches an ATR threshold and reverses. Sometimes it reaches the same area and continues. This script is meant to organize that behavior into a structure you can read quickly. The Chandelier Exit engine provides the directional framework, while the ladder, fib channel, and reaction zones help show where price is stretched, where it is progressing through the channel, and where a reaction may be worth paying closer attention to.
At a high level, the script does three things. First, it identifies the current active ATR 10 side and the opposite ATR 10x extension. Second, it divides that space into a structured ladder using fib-based levels. Third, it can overlay ATR 5.0 and 7.5 reaction zones so you can see when price is pressing into an intermediate reaction area instead of only waiting for the full ATR 10 test.
A few examples of how to read it:
➡️In a bullish state, the active ATR 10 line acts as the lower anchor and the ATR 10x extension becomes the upper stretch line. The fib ladder shows how far price has progressed through that channel.
➡️In a bearish state, the structure flips. The active ATR 10 line becomes the upper anchor and the ATR 10x extension becomes the lower stretch line.
The optional ATR 5.0 and 7.5 reaction zones add another layer of context. They are useful when price is not yet at the full ATR 10 extreme but is already entering a part of the move where reaction risk is increasing.
➡️The reaction zones table is there to make the state logic visible. It shows the current main multiplier's direction, the latest flip state, the 5.0 / 7.5 reaction directions, and whether those reaction branches are actively contributing to the fill.
This is not meant to predict reversals by itself. The way I use it is more practical: it helps frame where price is stretched, where a move is still developing, and where a reaction may deserve closer attention. The value here is the structure, not a guaranteed signal.
The script also includes state-aware touch alerts for the active ATR 10 level and the ATR 10x extension. Those alerts are not entry signals on their own. They are meant to notify you when price has reached an area that may deserve a decision: continuation, reaction, or invalidation.
Bar Replay
Bar Replay is especially useful with this script. Stepping through price one bar at a time makes it much easier to see how the multiplier 10 ladder flips, how the fib channel reorients, and when the 5.0 / 7.5 reaction zones begin to matter. That can help traders understand the structure in motion instead of only judging it from a finished chart.
Confluence
This script is not meant to be used in isolation. It works best as a structural framework alongside other tools such as RSI, MACD, trend context, volume, and support/resistance. The ladder and reaction zones help define where price is stretched; confluence helps decide whether that stretch is more likely to lead to continuation, reaction, or reversal.
This is an open-source tool, so the goal is transparency and flexibility. Traders can keep it simple and use only the main ATR 10 ladder, or add the fib channel, reaction zones, candle coloring, alerts, and table for more context. The core idea stays the same either way: use a Chandelier Exit-style ATR framework to map stretched price conditions with a consistent structure.
Here's a few additional chart examples:
Indicator

TPO Single Prints + nPOCThis indicator brings two core Market Profile concepts to TradingView in a clean, automated way: the Naked Point of Control (nPOC) and Single Prints. Both are calculated from real TPO (Time Price Opportunity) logic using configurable tick sizes, and both are tracked live — updating and removing themselves as price interacts with them.
The indicator supports both daily and weekly timeframes simultaneously, giving you a layered view of unfilled structures across multiple session lengths. Everything is drawn directly on the chart as lines and boxes with fully customizable colors.
Naked Point of Control
The price level with the highest TPO count in a completed session that has not yet been revisited by price. Drawn as a horizontal line extending forward in time until touched.
Single Prints
Price levels within a session's body that were only visited by a single TPO period. These form thin zones representing areas of fast, one-sided movement — can act as magnet for future price action.
Tick-Precise Logic
All calculations are snapped to configurable tick sizes (BTC: $24, ETH: $2, SOL: $0.1, or manual). This ensures the indicator correctly represents the granularity of the underlying asset.
Tick Settings
Tick Preset
Selects a predefined tick size for the asset. BTC = $24, ETH = $2, SOL = $0.10. Choose MANUAL to enter a custom value.
Manual Tick Size
Active only when Tick Preset is set to MANUAL. Defines the price increment for profile row construction. Should match the asset's meaningful price granularity.
Naked POC Settings
Show Daily nPOC
Enables nPOC lines from daily sessions. Each completed day that has not had its POC revisited will show a horizontal line.
Show Weekly nPOC
Same as above but for weekly sessions. Weekly nPOCs tend to be stronger, longer-lasting reference points.
Single Prints Settings
Show Daily SPs
Enables Single Print boxes from daily sessions.
Show Weekly SPs
Enables Single Print boxes from weekly sessions.
Keep Touched SPs
When enabled, fully filled SP zones are not deleted. Instead they are recolored to a faded gray and stop extending, leaving a visual record of where fills occurred.
How traders use this
nPOC as Magnet Levels
Markets statistically tend to revisit past POC levels. Naked POCs are strong candidates for mean-reversion targets, especially when price is trending away from a cluster of unfilled levels.
Single Prints as Impulse Markers
Single prints form during fast, directional moves with little acceptance. When price returns to these zones, it often does so quickly — making them useful for entries in the direction of the original move. Indicator

AG Pro Pivot Points Reaction Map [AGPro Series]AG Pro Pivot Points Reaction Map
Overview / What it does
AG Pro Pivot Points Reaction Map is an overlay indicator designed to analyze how price behaves around classical pivot levels rather than only plotting those levels as static horizontal references. The script builds Daily or Weekly pivot structures from prior period OHLC data and then tracks the currently active pivot in order to highlight nearby price interaction, reaction quality, and short-term context.
Instead of treating every pivot line equally at all times, the script uses an active-pivot framework. This allows the chart to stay focused on the level that is currently most relevant to price while still keeping broader pivot structure visible in the background. The goal is to help traders evaluate whether price is reacting constructively, rejecting, reclaiming, compressing, or losing a key pivot area.
The visual design is intentionally split into two layers. The first layer is the classical pivot structure itself, including PP, R1, S1, and optional extended levels such as R2 and S2. The second layer is the reaction map built around the active pivot. This layer adds an ATR-based reaction zone, state detection, filtered event labeling, active context tags, and an information panel so the chart can communicate more than a simple “price above” or “price below” condition.
This indicator is intended for chart analysis, workflow support, and structured market reading. It does not attempt to predict future prices, and it should not be interpreted as a standalone trade execution system. It is best used as a contextual overlay that helps organize price behavior around widely followed pivot references.
Unique Edge
The core distinction of this script is that it is not just another pivot plotting tool. Classical pivot indicators usually stop at drawing levels. This script continues one step further by evaluating reaction behavior around the currently active level.
Its main differentiator is the active reaction framework. The script identifies a current pivot focus, builds a dynamic reaction zone around that level, and then classifies price interaction into states such as reclaim, loss, holding behavior, rejection behavior, and compression near pivot. This moves the indicator away from passive level display and toward structured price-context mapping.
A second differentiator is the sticky active pivot logic. Instead of shifting focus too aggressively whenever price becomes marginally closer to a different level, the script attempts to keep chart attention anchored to the current active pivot until conditions justify a transition. This improves visual continuity and makes the chart easier to read during multi-bar interaction.
A third differentiator is signal hygiene. Reaction labels can be filtered through cooldown logic, score thresholds, and event selection rules so that the chart remains readable. Major events can be emphasized while weaker or more repetitive reactions remain in the background. This helps preserve interpretability instead of overwhelming the screen with every minor touch.
Finally, the script combines chart-side cues with a compact state panel. The panel reports the active pivot, pivot price, current distance, live state, last score, and directional bias. This allows users to scan the present context without losing the full visual relationship on the chart.
Methodology
The pivot engine uses prior Daily or Weekly OHLC values to construct standard pivot levels. These levels form the structural base of the indicator. Depending on settings, the script can display the central pivot point together with first and second resistance/support layers.
From that structure, the script evaluates which pivot is currently most relevant to price and assigns that level as the active pivot. A sticky selection process is then used so the active focus does not rotate too easily on minor fluctuations. This helps the script behave more like a context map and less like a constantly flickering nearest-line tracker.
Around the active pivot, the script builds a reaction zone using ATR. This means the mapped zone adapts to the instrument’s recent volatility rather than using a fixed absolute distance. A wider volatility environment naturally leads to a wider interaction zone, while a calmer environment keeps the zone tighter.
Inside that zone, the script studies price behavior using a combination of position relative to the pivot, candle body structure, wick emphasis, and short-term displacement from the level. It also computes a reaction score designed to quantify how constructive or decisive the interaction appears under the script’s logic. Stronger reclaim or rejection characteristics can therefore stand out from weaker, noisier touches.
The result is a layered read of market structure:
- classical pivot references define the environment,
- the active pivot identifies current relevance,
- the ATR-based zone frames the interaction area,
- event logic classifies notable reactions,
- the panel summarizes the current state.
Signals & Alerts
The script can identify and label several reaction types around the active pivot. Depending on settings and score thresholds, these may include reclaim events, pivot loss events, reaction holding behavior, and reaction rejection behavior.
In addition to chart labeling, the script includes alert conditions for major workflow events. These are designed to notify the user when price is showing a notable interaction around the active pivot. Available alert categories include bullish reaction confirmation, bearish reaction confirmation, pivot loss confirmation, compression near pivot, and active pivot changes.
Because this is a contextual indicator rather than a complete strategy, alerts should be interpreted as informational events. They are intended to help users monitor evolving price behavior around important pivot areas, not to replace independent analysis, execution rules, or risk management.
Key Inputs
Pivot Anchor
Selects whether the pivot structure is built from Daily or Weekly source data.
Show R2 / S2
Allows the extended pivot structure to remain visible for users who want broader context beyond PP, R1, and S1.
Base Pivot Line Width / Active Pivot Line Width
Controls the visual hierarchy between background pivot references and the currently active pivot.
Reaction Zone (ATR Multiplier)
Defines the width of the active reaction zone relative to recent volatility.
Wick Emphasis
Adjusts how strongly wick behavior contributes to reaction interpretation.
Signal Cooldown (Bars)
Prevents labels and events from clustering too tightly during noisy price interaction.
Show Reaction Labels / Label Mode / Minimum Label Score
Controls which reaction labels appear on the chart and how selective the script should be.
Focus Mode
Adjusts how aggressively non-active pivot lines fade into the background.
Reaction Label Size
Changes the chart label size for reaction events and edge tags.
Show Event Markers / Show Active Pivot Halo / Show Right Edge Active Tag
Controls optional visual layers that can make the active structure easier to follow.
Passive Context Tags
Adds simplified right-edge tags for passive pivot references so faded background levels remain interpretable.
Show Info Panel / Panel Position / Panel Theme / Panel Font Size
Configures the summary panel to match user preference and chart layout.
Limitations & Transparency
This script is based on classical pivot concepts and volatility-adjusted reaction mapping. It does not know future price direction, and it does not forecast whether any pivot will hold or fail before price interacts with that area.
Reaction labels and scores are formula-driven representations of the script’s internal logic. They are not objective truth statements about market intent, and they should not be interpreted as guaranteed support, guaranteed resistance, or guaranteed continuation/reversal behavior.
Like all level-based overlays, the script can produce different impressions depending on the selected timeframe, instrument volatility, and chart conditions. Fast-moving instruments, low-liquidity environments, and sudden news-driven candles may reduce the practical value of any fixed structural framework, including pivots.
The active pivot model is intentionally selective. That improves chart focus, but it also means the script emphasizes one current pivot context over other simultaneously visible levels. Users who want a broader or more aggressive level-tracking style may prefer different settings than the default configuration.
The indicator is also not a backtesting engine and does not provide complete entry, exit, stop, or position sizing logic. It should therefore be used as one analytical component within a broader decision process.
Risk Disclosure
This indicator is for analytical and educational use only. It does not provide investment advice, trading advice, or financial advice.
Markets involve risk. Price can move through pivot levels without respecting them, reaction quality can deteriorate quickly, and conditions that appear constructive on one bar can fail on the next. No indicator can remove uncertainty from live markets.
Users should evaluate this script together with their own market framework, timeframe selection, execution process, and risk controls. Decisions involving capital should never rely on a single indicator, label, panel reading, or alert event in isolation. Indicator

Indicator