Covenant Regime Atlas [JOAT]Covenant Regime Atlas
Introduction
Covenant Regime Atlas is an open-source Pine Script v6 market-regime indicator built to classify directional state through trend, expansion, persistence, and retest quality. Its purpose is not to predict the next trade by itself, but to create a durable bias layer that tells the trader whether the market is developing a bullish regime, a bearish regime, or a maturing directional environment worth respecting.
The problem this script solves is context instability. Many traders can spot a moving-average crossover or a burst in ATR, but that alone does not answer whether the regime is actually mature, whether momentum has real separation, or whether recent retests are behaving consistently with the dominant trend. Covenant Regime Atlas addresses this by blending multiple regime components into one overlay and dashboard.
The script uses a dual-mid framework derived from EMA and HMA references, ATR-scaled cloud and envelope bands, persistence measurement, heat normalization, slope impulse, and retest memory. This lets it move beyond a simple bullish-versus-bearish cross and instead describe whether the regime is developing, mature, expanding efficiently, or internally cooling.
The result is an indicator for traders who want a cleaner read of bias before interpreting any trigger tool. It is especially useful as a regime filter for execution indicators and strategies that should behave differently in mature directional flow versus unstable transition periods.
Core Concepts
1. Directional Mid Versus Structural Mid
The script creates a fast directional midpoint and a slower structural midpoint using blended EMA and HMA references. The spread between those two curves forms the backbone of regime direction.
float directionalMid = math.avg(emaFast, hmaFast)
float structuralMid = math.avg(emaSlow, hmaSlow)
bool trendBull = directionalMid > structuralMid
This gives the regime engine more shape than a single moving average crossover. The directional mid measures active flow. The structural mid measures slower context.
2. Regime Strength Through Separation And Heat
Regime strength is calculated from ATR-normalized spread plus the distance of normalized heat from its midpoint. In other words, the regime is strongest when the fast and slow structures are well separated and price is also positioned decisively within its recent range.
This helps avoid overvaluing tiny directional crosses that occur with little actual separation or energy.
3. Persistence And Maturity
Every regime needs time to prove itself. The script counts how long the current directional condition has been intact and compares that against a user-defined persistence floor. Once the threshold is met, the regime is treated as mature rather than merely developing.
This matters because a fresh directional flip is different from a directional condition that has held for many bars and survived multiple retest opportunities.
4. Retest Memory
After a mature regime forms, the indicator watches for controlled retests of the directional midpoint. Bull retests occur when price revisits the midline from above and closes back above it. Bear retests use the opposite condition. The last retest is stored as a dotted line and extended forward until it becomes irrelevant.
This gives the trader a simple memory of where the market most recently confirmed trend participation.
5. Pulse, Expansion, And Efficiency
The script also measures volatility expansion, slope impulse, heat drift, trend separation percentage, and directional travel efficiency. These metrics allow the dashboard to distinguish between a mature regime that is expanding forcefully and one that is mature but internally cooling or grinding.
Features
Bull and bear regime classification: Uses fast-versus-slow blended midpoints to define directional control
Maturity logic: Distinguishes developing regimes from mature ones using persistence counting
ATR-scaled cloud and envelope: Frames the current directional corridor directly on the chart
Retest memory engine: Stores the latest mature-regime retest level for forward reference
Initiation band: Preserves the regime start envelope so traders can judge distance from the original launch zone
Pulse ribbon: Adds a compact visual band around price to reflect internal heat conditions
Regime backdrop shading: Tints the chart according to the active directional state
Detailed dashboard: Displays strength, heat, persistence, expansion, slope pulse, retest distance, maturity, efficiency, and more
Confirmed-bar alerts: Includes mature bias, retest, expansion, continuation, efficient trend, and heat-reset conditions
Data-window outputs: Exposes regime internals for systematic reading or comparison
Visual Elements
Directional cloud: The gap between the fast and slow regime mids shows whether the market is operating with clean separation
Envelope bands: ATR-based boundaries help frame the active directional corridor around price
Initiation band: The regime launch area stays visible so users can measure how far the trend has traveled from origin
Retest line memory: The latest confirmed retest is preserved as a direct chart reference
Backdrop and pulse ribbon: Context shading and the pulse band make regime character readable without overloading the chart
Best Practices
Treat mature regimes differently from developing ones because the same trigger can behave very differently in each state
Watch heat drift when a regime remains mature but starts losing internal energy
Use retest memory to frame participation zones rather than chasing every extension away from the midline
Give more weight to regimes that show both persistence and expansion instead of one without the other
Use the atlas as a context engine first and an alert source second
Input Parameters
Trend Engine:
Fast Length: Sets the faster directional reference
Slow Length: Sets the slower structural reference
Heat Window: Defines the range-normalization window for heat calculations
ATR Length: Controls volatility normalization
Cloud Width Factor: Sets the width of the directional cloud and envelope
Retest Engine:
Show Retest Memory: Toggles retest storage and line rendering
Retest Cooldown Bars: Prevents retests from firing too frequently
Persistence Floor: Sets how many bars are required before a regime is considered mature
Show Initiation Band: Displays the preserved start range of the current regime
Maturity Window: Controls maturity scaling and travel-efficiency measurements
Display:
Show Dashboard toggle
Show Regime Backdrop toggle
Show Pulse Ribbon toggle
Independent bull, bear, neutral, and panel colors
How to Use This Indicator
Step 1: Read Regime Tag And Strength
Begin with the dashboard’s regime tag. It tells you whether the market is bullish or bearish and whether that state is still developing or already mature. Pair that with the strength reading to avoid confusing a weak directional bias with a strong one.
Step 2: Check Persistence And Expansion
Persistence tells you how long the regime has survived. Expansion tells you whether volatility is supporting the move. A mature regime with positive expansion usually deserves more respect than a new regime with weak expansion.
Step 3: Use Retest Memory As A Structural Anchor
When the retest line is present, it marks the last meaningful participation check inside the trend. That line can help frame whether the current move is still building from a healthy base or drifting too far away from supportive structure.
Step 4: Watch Heat Drift And Efficiency
Heat drift helps show whether the regime is internally warming or cooling. Efficiency tells you whether directional travel has been orderly. These readings are helpful when deciding whether the trend still looks clean or is becoming unstable.
Step 5: Use It As The Bias Layer For Other Tools
Covenant Regime Atlas is best used as a bias filter. It helps define whether you should be thinking continuation, pullback participation, or caution. Pair it with your own trigger logic rather than using the regime alone as a full trading plan.
Indicator Limitations
A developing regime can fail before reaching maturity, especially in choppy markets
Retest memory is useful for context, but the stored retest level is not guaranteed to hold on future tests
Efficiency and heat drift are descriptive metrics, not predictive guarantees of continuation
The indicator can still classify a directional state during periods where execution conditions are poor for actual trading
Originality Statement
Covenant Regime Atlas is original in the way it blends trend separation, maturity, retest memory, expansion, and efficiency into a unified regime overlay. It is not just a moving-average cloud with added cosmetics:
It separates directional identity from maturity, allowing the user to distinguish developing and established regimes
It stores retest memory as a living structural feature instead of relying only on static crossover logic
It combines heat, slope, expansion, and efficiency into one dashboard so regime quality can be judged from multiple dimensions
It preserves the initiation band of the current regime, which gives context that typical trend overlays do not maintain
Disclaimer
This indicator is provided for educational and informational purposes only. It is not financial advice or a recommendation to buy or sell any financial instrument. Regime readings describe current market structure and internal state based on historical prices. They do not guarantee future movement or profitable trading decisions. Always use independent judgment and proper risk management.
-Made with passion by jackofalltrades
Indicator

Compression Shift Index [JOAT]Compression Shift Index
Introduction
Compression Shift Index is an open-source Pine Script v6 indicator designed to detect transitions between compression and displacement. It measures whether price is storing energy in a tight state, whether that energy is beginning to release directionally, and whether the release is supported by enough pressure and travel efficiency to matter.
The problem this indicator solves is timing. Traders often recognize trend after the move is already mature, or they chase weak momentum bursts that never become true displacement. Compression Shift Index is built to distinguish between quiet compression, directional pressure, and confirmed shift conditions so the user can see whether price is merely active or whether a real state change is underway.
The script lives in its own pane, but it also projects tactical shift ranges onto the main chart. That means it can work as both a state engine and a visual execution aid. The pane handles classification and scoring. The overlay range preserves the high, low, and midpoint of the most recent active shift so price can be read against the trigger zone directly on the chart.
Rather than relying on one oscillator reading, the script blends moving-average spread, RSI of momentum, ATR expansion, path efficiency, and compression mathematics. The result is not a conventional trend tool. It is a state-transition tool built to show when stored pressure is becoming directional opportunity.
Core Concepts
1. Compression Score
Compression is measured by comparing the recent price range to ATR-normalized movement over a configurable window. As the range contracts relative to expected volatility, the compression score rises.
float compressionRatio = safeDiv(ta.highest(high, compressionLength) - ta.lowest(low, compressionLength), ta.atr(compressionLength) * compressionLength) * 100.0
float compressionScore = clamp(100.0 - compressionRatio, 0, 100)
This means the script is not labeling compression by candle size alone. It evaluates the market relative to its own volatility conditions.
2. Displacement Score
Displacement is measured through moving-average spread magnitude, RSI-based pressure away from neutrality, and fast-versus-slow ATR expansion. A high displacement score means price is no longer just compressed. It is pushing with enough directional force to deserve attention.
3. Pressure Confirmation
Directional pressure requires more than a large reading. Bullish pressure needs positive spread and price acceptance above the fast EMA. Bearish pressure requires the opposite. This creates a separation between raw movement and directional pressure that is actually aligned with the current path of price.
4. Shift Range Memory
When a confirmed bull or bear shift occurs, the script stores the initiating bar’s high and low, then extends that range for a configurable number of bars. As new bars arrive, the active range updates its upper and lower boundaries.
This transforms the shift from a momentary signal into a tactical map. The trader can judge whether price is holding inside the shift range, stretching away from it, or failing back through the structure.
5. Quality And Travel Efficiency
Not every shift is equal. The script measures path efficiency by comparing net travel to the cumulative path traveled across the efficiency window. That helps distinguish efficient directional release from noisy back-and-fill movement.
When displacement, pressure, and efficiency all align, the quality score rises. This is especially useful for separating impulsive continuation from unstable burst behavior.
Features
Compression and displacement state engine: Differentiates quiet conditions from directional release
Bull and bear shift detection: Confirms directional shifts only after displacement and pressure criteria align
Tactical overlay range: Projects the active shift high, low, and midpoint onto the main chart
Ribbon bias display: Adds a visual ribbon showing directional pressure inside the pane
Travel efficiency scoring: Measures whether displacement is clean or noisy
State backdrop and candle tinting: Tints both pane and chart context according to the current state
Detailed dashboard: Publishes compression, displacement, ATR ratio, heat, range, stretch, velocity, efficiency, quality, and persistence
Confirmed-bar alerts: Includes compression, bull shift, bear shift, pressure, release, fade, and quality-state alerts
Data-window exports: Makes many internal scores accessible without adding extra plots to the pane
Range-aging logic: Tracks how long the active shift has been in effect
Visual Elements
Pane state curves: The net shift, compression, and displacement lines provide a layered read of current state
Ribbon bias fill: The pane ribbon helps show whether directional pressure is leaning bullish or bearish before full shift confirmation
Overlay shift range: The active high, low, and midpoint are projected onto the price chart for tactical context
Backdrop and candle tinting: The indicator colors both pane and chart state to make transitions easier to identify at a glance
Dashboard diagnostics: The top-right panel summarizes metrics that would otherwise require several separate indicators
Best Practices
Wait for displacement to dominate compression before assuming a move has truly released
Use high-quality shifts as higher-priority context than low-efficiency state changes
Read the active shift range as a tactical map, not as a guarantee that price will respect every boundary
If pressure improves but displacement remains weak, treat the move as developing rather than already established
Use the state engine to filter your existing entries instead of trying to trade every alert in isolation
Input Parameters
Signal Engine:
Fast MA Length: Sets the fast trend reference
Slow MA Length: Sets the slow trend reference
Compression Window: Defines the state lookback for range contraction
RSI Length: Sets the smoothing period for momentum pressure evaluation
Momentum Length: Defines the raw momentum lookback
Thresholds:
Compression Threshold: Determines how compressed the market must be to count as compressed
Displacement Threshold: Determines how forceful the move must be to count as a shift
Shift Hold Bars: Controls how long the active shift range remains alive
Efficiency Length: Sets the path-efficiency lookback
Show Trigger Range: Toggles the projected overlay range on the chart
Visual Language:
Bull and bear color pairs
Neutral color and panel background
Show Dashboard toggle
Show State Backdrop toggle
Show State Ribbon toggle
How to Use This Indicator
Step 1: Identify The Current State
Start with the dashboard and pane. If compression is dominant, the market is still storing energy. If bull or bear pressure is present, directional force is building. If a bull or bear shift is confirmed, the state transition has already occurred.
Step 2: Compare Compression To Displacement
The most useful read is not the absolute number alone, but the relationship between compression and displacement. When compression is high and displacement is still low, the market is coiled. When displacement overtakes compression, the release phase is gaining control.
Step 3: Use The Active Shift Range
Once a shift is active, watch the projected upper, lower, and midpoint lines on the main chart. These define the tactical zone created by the displacement event. Price behavior around that range often provides better context than the signal bar alone.
Step 4: Check Quality And Efficiency
A high-quality state means the release is not only directional but also relatively efficient. If quality is weak, treat the shift more cautiously because the move may be noisy or unstable.
Step 5: Use It As A State Filter
Compression Shift Index is most effective as a state filter for your own process. It can help you avoid forcing breakout logic during compression and avoid fading a move that is still in active displacement.
Indicator Limitations
Compression does not guarantee that a strong displacement event will follow immediately
A shift can fail quickly if the broader market context does not support follow-through
Travel efficiency can lag during early release phases because noisy price action is still being absorbed into the lookback
The active shift range is a tactical reference zone, not an automatic support or resistance guarantee
Originality Statement
Compression Shift Index is original in the way it turns compression, displacement, pressure, efficiency, and range memory into one unified transition model. It is not simply an oscillator blend for cosmetic effect:
It frames compression and release as a state transition rather than a single threshold cross
It preserves the originating shift range on the main chart, which links pane analysis to execution context
It includes efficiency and velocity metrics that help separate orderly displacement from noisy expansion
It uses a dashboard that summarizes the full state stack rather than forcing the user to infer everything from one line
Disclaimer
This indicator is provided for educational and informational purposes only. It is not financial advice or a recommendation to buy or sell any financial instrument. Compression and displacement readings describe market state, not guaranteed future direction. Markets can remain compressed longer than expected or reverse immediately after a shift appears. Always use independent judgment and proper risk management.
-Made with passion by jackofalltrades
Indicator

Indicator

Indicator

Indicator

Wave Navigator Cycle [Adaptive]Wave Navigator Cycle
Overview
The Wave Navigator System is a comprehensive technical indicator designed to trade the "Distorted Cycle." Unlike traditional indicators that lag behind price, this system uses an Adaptive Sine Wave to map out market phases in real-time, helping traders identify when the market is in a state of Preparation, Expansion (Ride the Wave), or Distribution.
This tool integrates high-probability Smart Money Concepts (SMC) including Liquidity Sweeps, Displacement, and Fair Value Gaps (FVG) to provide a complete roadmap for trend following and reversal trading.
Key Features
1. Adaptive Sine Wave Cycle
At the core of this indicator is a dynamic sine wave anchored to an ALMA (Arnaud Legoux Moving Average).
- Preparation Phase: Price is at the cycle bottom (Low Zone), looking for Sell-Side Liquidity.
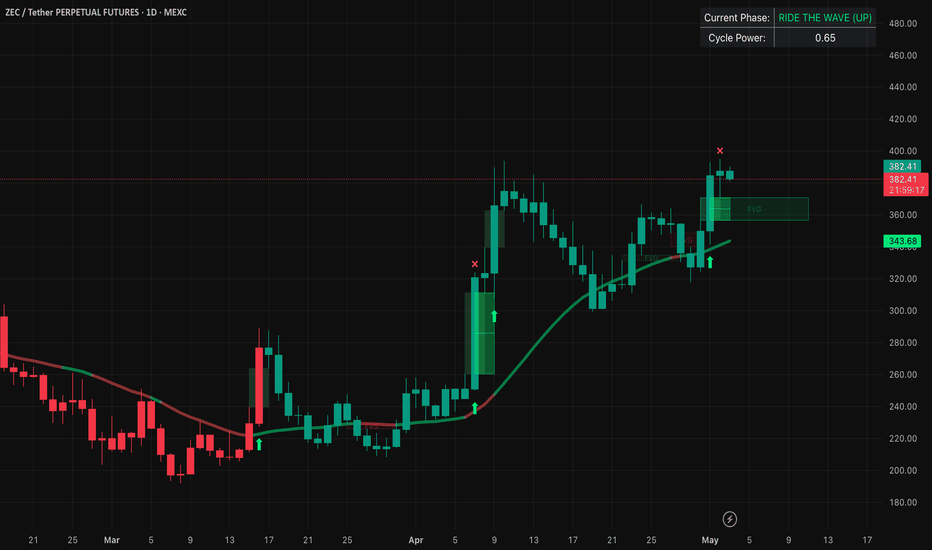
- Ride the Wave: The sine wave turns green and rises, signalling a bullish trend expansion.
- Distribution Phase: Price reaches the cycle peak (High Zone), looking for Buy-Side Liquidity.
- Displacement Down: The sine wave turns red, signalling a shift in market structure and a bearish move.
2. Liquidity Sweep Detection
The indicator automatically marks "Equal Highs" and "Equal Lows" that have been swept.
- X Marks: Buy-Side Liquidity Sweeps (Potential Short setups).
- Triangle Marks: Sell-Side Liquidity Sweeps (Potential Long setups).
3. Smart Displacement & FVGs
The system doesn't just look for big candles; it calculates Relative Displacement. When price moves with high volume and volatility, the indicator identifies Fair Value Gaps (FVG).
- Emerald Boxes: Bullish FVGs (Targets for "Retrace to FVG" longs).
- Maroon Boxes: Bearish FVGs (Targets for "Retrace to FVG" shorts).
4. Real-Time Dashboard
A built-in HUD (Heads-Up Display) in the top-right corner monitors the Cycle Power and explicitly labels the current market phase, so you never have to guess where you are in the "Distorted Cycle."
---
How to Trade with Wave Navigator
1. Identify the Zone: Look for the Sine Wave to enter the "Preparation" (Low) or "Distribution" (High) zones.
2. Wait for the Sweep: Look for a Liquidity Sweep icon to appear at the cycle extremes.
3. Confirm with Displacement: Wait for a Displacement Arrow and a coloured Sine Wave flip (Green for Up / Red for Down).
4. The Entry: Enter on the Retrace to FVG (the coloured boxes) once the wave has begun its new direction.
Settings
- Base MA Length: Adjust this to change the "frequency" of the wave (Higher = Swing Trading, Lower = Scalping).
- Displacement Sensitivity: Fine-tune how "aggressive" the price move must be to trigger an FVG.
- Sine Opacity: Customise the visual intensity of the trend wave.
Disclaimer: Trading involves significant risk. This indicator is a tool for analysis and should be used in conjunction with a robust trading plan and proper risk management.
("Updated visual presentation") Indicator
Wave Navigator Cycle [Adaptive] Wave Navigator Cycle
Overview
The Wave Navigator System is a comprehensive technical indicator designed to trade the "Distorted Cycle." Unlike traditional indicators that lag behind price, this system uses an Adaptive Sine Wave to map out market phases in real-time, helping traders identify when the market is in a state of Preparation, Expansion (Ride the Wave), or Distribution.
This tool integrates high-probability Smart Money Concepts (SMC) including Liquidity Sweeps, Displacement, and Fair Value Gaps (FVG) to provide a complete roadmap for trend following and reversal trading.
Key Features
1. Adaptive Sine Wave Cycle
At the core of this indicator is a dynamic sine wave anchored to an ALMA (Arnaud Legoux Moving Average).
- Preparation Phase: Price is at the cycle bottom (Low Zone), looking for Sell-Side Liquidity.
- Ride the Wave: The sine wave turns green and rises, signalling a bullish trend expansion.
- Distribution Phase: Price reaches the cycle peak (High Zone), looking for Buy-Side Liquidity.
- Displacement Down: The sine wave turns red, signalling a shift in market structure and a bearish move.
2. Liquidity Sweep Detection
The indicator automatically marks "Equal Highs" and "Equal Lows" that have been swept.
- X Marks: Buy-Side Liquidity Sweeps (Potential Short setups).
- Triangle Marks: Sell-Side Liquidity Sweeps (Potential Long setups).
3. Smart Displacement & FVGs
The system doesn't just look for big candles; it calculates Relative Displacement. When price moves with high volume and volatility, the indicator identifies Fair Value Gaps (FVG).
- Emerald Boxes: Bullish FVGs (Targets for "Retrace to FVG" longs).
- Maroon Boxes: Bearish FVGs (Targets for "Retrace to FVG" shorts).
4. Real-Time Dashboard
A built-in HUD (Heads-Up Display) in the top-right corner monitors the Cycle Power and explicitly labels the current market phase, so you never have to guess where you are in the "Distorted Cycle."
---
How to Trade with Wave Navigator
1. Identify the Zone: Look for the Sine Wave to enter the "Preparation" (Low) or "Distribution" (High) zones.
2. Wait for the Sweep: Look for a Liquidity Sweep icon to appear at the cycle extremes.
3. Confirm with Displacement: Wait for a Displacement Arrow and a coloured Sine Wave flip (Green for Up / Red for Down).
4. The Entry: Enter on the Retrace to FVG (the coloured boxes) once the wave has begun its new direction.
Settings
- Base MA Length: Adjust this to change the "frequency" of the wave (Higher = Swing Trading, Lower = Scalping).
- Displacement Sensitivity: Fine-tune how "aggressive" the price move must be to trigger an FVG.
- Sine Opacity: Customise the visual intensity of the trend wave.
Disclaimer: Trading involves significant risk. This indicator is a tool for analysis and should be used in conjunction with a robust trading plan and proper risk management.
(Updated visual presentation) Indicator

Indicator
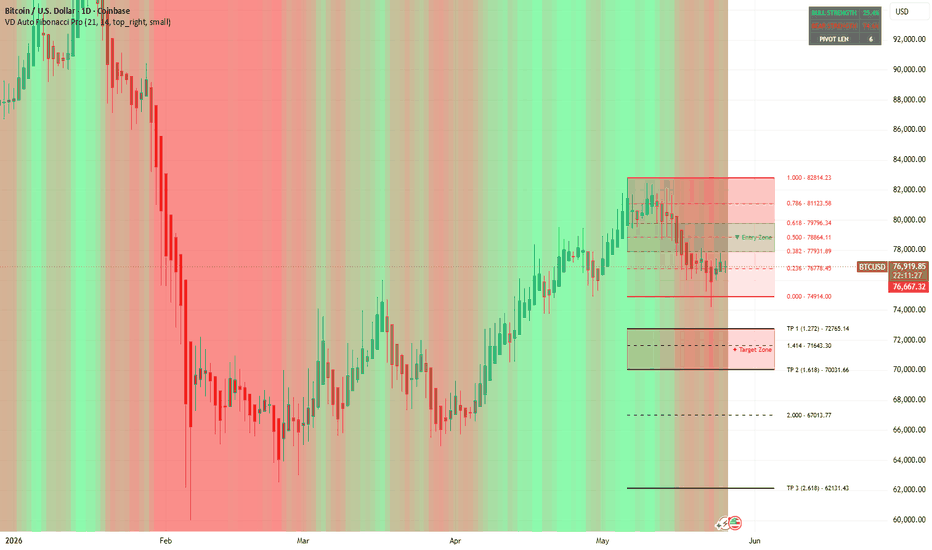
Cody Zig ZagCody Zig Zag Indicator - Complete Explanation
This is a Zig Zag indicator that replicates the MetaTrader 4 (MT4) version, which works differently than TradingView's built-in Zig Zag. Here's what it does:
🎯 What is a Zig Zag Indicator?
It filters out minor price movements to show only significant swing highs and swing lows, helping you identify trends and chart patterns (head & shoulders, double tops/bottoms, etc.).
⚙️ User Settings (Inputs)
Setting Default What It Does
Depth 6 Lookback period to find local highs/lows
Deviation 5 Minimum price change (in ticks) to form a new swing point
Backstep 2 Minimum bars between swing points
Line Thickness 2 Zig Zag line width
Bull Color Lime Color for upward moves
Bear Color Red Color for downward moves
Repaint Levels true If ON, lines/labels adjust real-time; if OFF, they lock on close
🔍 How It Works (The "Bake" Section)
Step 1: Find Potential Pivot Points
p_lw = Most recent low within Depth bars
p_hg = Most recent high within Depth bars
Checks if price moved enough (Deviation * tick size) to qualify
Step 2: Determine Direction
down = Boolean (true = bearish/downward leg, false = bullish/upward leg)
Tracks whether we're connecting a high→low (down) or low→high (up)
Step 3: Draw Zig Zag Lines
Connects alternating swing highs and swing lows
Labels each point as:
HH = Higher High
LH = Lower High
LL = Lower Low
HL = Higher Low
🏷️ Labels Explained
When price makes a new swing point, you'll see:
HH (Higher High) - Bullish continuation signal
LH (Lower High) - Bearish reversal signal
LL (Lower Low) - Bearish continuation signal
HL (Higher Low) - Bullish reversal signal
📊 Visual Features
Colored Zig Zag lines: Green for up-legs, Red for down-legs
Background color: Green during bullish legs, Red during bearish legs (90% transparent)
Labels: Tiny triangles pointing up/down with text
⚠️ Repaint Behavior (Important!)
Repaint = ON (default) Repaint = OFF
Lines/labels update in real-time Locks on bar close
Can "repaint" history More reliable for backtesting
Good for real-time trading No historical repainting
Warning: Zig Zag indicators naturally repaint because they need future bars to confirm pivot points. The repaint option controls HOW they repaint.
🚨 Alerts
This script triggers alerts when:
Direction Changed - Zig Zag switches from up to down or down to up
Bullish Direction - Switches from down to up
Bearish Direction - Switches from up to down
📈 How to Use
Identify Trend: Upward Zig Zag = Uptrend; Downward = Downtrend
Find Patterns: Look for HH/HL patterns (bullish) or LH/LL patterns (bearish)
Divergence: Compare Zig Zag swings with oscillator indicators
Support/Resistance: Swing points act as natural S/R levels
⚡ Quick Summary
This indicator draws a line connecting significant price swings, ignoring small noise. It's great for:
Visualizing trend structure
Identifying chart patterns
Finding entry/exit levels
Spotting trend reversals Indicator

Cody Zig Zag Cody Zig Zag – MT4-Style Zig Zag for TradingView
The ZigZag indicator that actually works like the classic MT4 version!
🔍 Overview
Cody Zig Zag is a powerful, fully customizable ZigZag indicator that replicates the exact behavior of the popular MetaTrader 4 (MT4) ZigZag. Unlike TradingView's built-in ZigZag, this version behaves identically to what MT4 traders know and love – making it perfect for Elliott Wave traders, support/resistance hunters, and breakout specialists.
⚙️ Input Parameters (Just like MT4!)
Parameter Default Description
Depth 12 Minimum number of bars between swing points
Deviation 5 Minimum price movement (in ticks) to form a new swing
Backstep 2 Minimum bars between swing points of the same type
Line Thickness 2 Visual weight of the ZigZag line
Bull Color Lime Color for upward swings
Bear Color Red Color for downward swings
Repaint Levels True Enables real-time repainting (MT4 style)
🎯 Key Features
✅ TRUE MT4 BEHAVIOR – Exact replication of MetaTrader 4's classic ZigZag algorithm
✅ INTELLIGENT LABELS – Automatically identifies HH (Higher High), LH (Lower High), LL (Lower Low), and HL (Higher Low)
✅ REAL-TIME UPDATES – Optional repainting mode for live market analysis
✅ DIRECTION BACKGROUND – Visual market direction indicator (Green = Bullish, Red = Bearish)
✅ ALERT CONDITIONS – Get notified when the ZigZag direction changes
💡 How to Use
For Beginners:
Just add the indicator to your chart – the default settings (12,5,2) work perfectly for most timeframes!
For Advanced Traders:
Lower Depth (5-8) → More swings, more detail (scalping/1min charts)
Higher Depth (12-20) → Cleaner swings, fewer signals (swing trading/4H+ charts)
Adjust Deviation → Control minimum swing size based on volatility
🎨 Visual Guide
Lime Line = Price moving UP
Red Line = Price moving DOWN
HH Label = Higher High (uptrend continuation)
LH Label = Lower High (potential reversal down)
LL Label = Lower Low (downtrend continuation)
HL Label = Higher Low (potential reversal up)
📊 Best For
📌 Elliott Wave Counting – Perfect for identifying wave structure
📌 Support & Resistance – Automatically marks swing highs/lows
📌 Breakout Trading – Visualize clear break levels
📌 Divergence Trading – Spot hidden/regular divergences with RSI/MACD
📌 Harmonic Patterns – Identify XABCD patterns easily
⏰ Alert Conditions
Direction Changed – Triggered whenever the ZigZag changes direction
Bullish Direction – When price starts moving up
Bearish Direction – When price starts moving down
🔧 Troubleshooting
Q: Why does the indicator "repaint"?
A: That's how MT4 ZigZag works! Repainting shows the most accurate real-time swing points. Turn OFF "Repaint Levels" if you prefer traditional non-repainting behavior.
Q: What timeframes work best?
A: Works on ALL timeframes! Lower Depth values (5-8) for lower timeframes, higher Depth (12-20) for higher timeframes.
Q: Can I use this for automated strategies?
A: Yes! The alert conditions can trigger tradingview alerts for manual or webhook-based trading.
🙏 Credits
Original MT4 ZigZag logic ported to Pine Script™ v6 by lucemanb
Renamed and optimized as Cody Zig Zag
📝 Keywords
ZigZag MT4 Elliott Wave Swing High Swing Low Support Resistance Divergence Breakout Harmonic Patterns Price Action Trend Reversal Higher High Lower Low Technical Analysis TradingView Indicator Free Indicator
⭐ Support & Feedback
If you find this indicator useful:
Like & Follow for more tools
Leave a review with your suggestions
Share with your trading community
Happy Trading! 🚀
Disclaimer: This indicator is for educational and analytical purposes. Past performance does not guarantee future results. Always practice proper risk management. Indicator

Indicator

Indicator

MINICRORE V2.0================================================================================
COMPLETE HOW-TO-USE GUIDE
ATP Pro v2 | Pine Script v6
================================================================================
ZONES: 4 Levels | SIGNALS: Buy & Sell | ALERTS: 4 Types | MTF: 1H 4H D W
================================================================================
SECTION 1 — OVERVIEW & INSTALLATION
================================================================================
WHAT IS THIS INDICATOR?
------------------------
(ATP Pro v2) is a professional-grade TradingView indicator
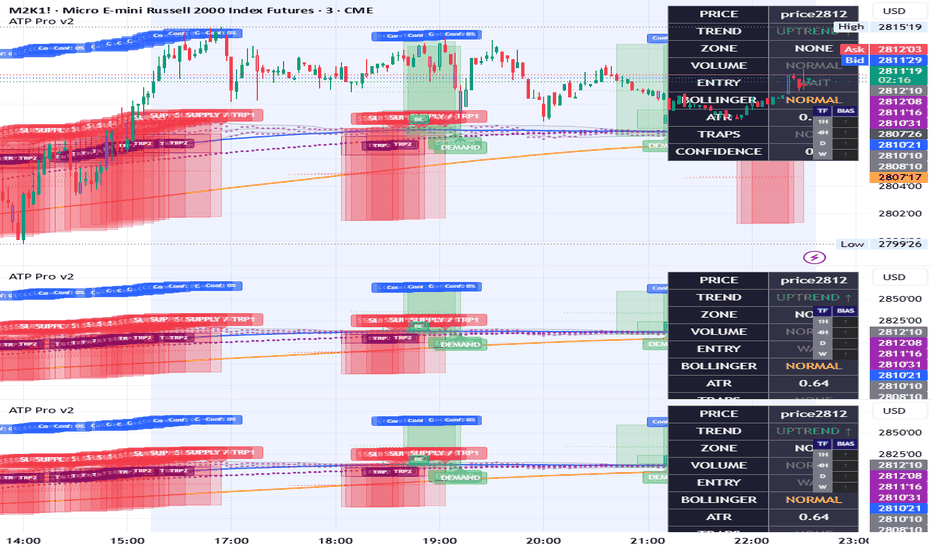
that replicates the . It identifies high-probability supply
and demand zones across multiple levels, detects trade traps, and provides
multi-timeframe trend analysis — all in one Pine Script v6 script.
HOW TO INSTALL ON TRADINGVIEW (8 Steps)
-----------------------------------------
1. Open TradingView.com and load any futures chart (e.g. M2K1! Russell Micro)
2. Click Pine Script Editor at the bottom of the screen
3. Click New → Blank Script — delete all existing code
4. Open the file ATP_Pro_v2_FINAL.pine and copy ALL the code
5. Paste the code into the Pine Script Editor
6. Click Save and name it: Ghost Trade Pro Clone
7. Click Add to Chart — the indicator appears immediately
8. Right-click the indicator name → Settings to customize
================================================================================
SECTION 2 — UNDERSTANDING THE 4 ZONES
================================================================================
The indicator draws 4 distinct zone types matching exactly:
┌─────────────┬───────────────┬──────────────┬──────────────────────────────┐
│ Zone Label │ Color │ Direction │ What It Means │
├─────────────┼───────────────┼──────────────┼──────────────────────────────┤
│ GHST_TRP1 │ Salmon / Red │ Supply (Sell)│ Primary swing high resistance│
│ GHST_TRP2 │ Dark Red │ Supply (Sell)│ Tighter secondary supply zone│
│ GHST_LVT │ Green │ Demand (Buy) │ Primary swing low support │
│ GHST_BE │ Teal / Cyan │ Demand (Buy) │ Break-even precise entry zone│
└─────────────┴───────────────┴──────────────┴──────────────────────────────┘
TRP1 — Primary Supply Zone (Red/Salmon)
What it is: Most recent 20-bar swing high. Price rejected here before.
What to do: When price returns → SELL. Wait for bearish candle + volume
spike inside the zone before entering short.
TRP2 — Secondary Supply Zone (Dark Red)
What it is: Tighter inner band inside TRP1. Confirmed by 40-bar swing high.
Stronger signal than TRP1 alone.
What to do: If price stalls inside TRP2, higher-confidence short entry.
Tighter stop loss possible.
GHST_LVT — Primary Demand Zone (Green)
What it is: Most recent 20-bar swing low. Price bounced from here before.
Buyers are likely to defend it again.
What to do: When price returns → BUY. Wait for bullish candle + volume
spike inside the zone before entering long.
GHST_BE — Break-Even Zone (Teal/Cyan)
What it is: Tightest inner zone inside LVT. Confirmed by 40-bar swing low.
Most precise bounce level.
What to do: Ideal for tight stop entries. Highest-confidence long entry
with minimal risk when price bounces from BE specifically.
================================================================================
SECTION 3 — DOT LINES, CHANNEL & MOVING AVERAGES
================================================================================
DOTTED CIRCLE LINES
--------------------
Horizontal dotted lines with circle markers (●) span the entire chart.
These represent key price levels extending into the future.
GREEN dotted → Supply swing high → Upper resistance, price rejects here
RED dotted → Demand swing low → Lower support, price bounces here
ORANGE dotted → Midpoint level → 50% between supply/demand, pivot point
● Circle markers appear every 10 bars along each line as visual anchors.
REGRESSION CHANNEL LINES (the diagonal blue lines)
----------------------------------------------------
Three diagonal lines form a price channel using linear regression:
Upper Line (Blue) → Regression of highs → Upper channel boundary
Middle Line (Light Blue) → Regression of close → Trend direction midline
Lower Line (Blue) → Regression of lows → Lower channel boundary
HOW TO USE:
• Price bouncing off lower channel = Buy opportunity
• Price hitting upper channel = Sell opportunity
• Price breaking outside channel = Potential trend change
MOVING AVERAGES (3 Lines)
--------------------------
┌────────────┬──────┬────────┬────────┬──────────────────────────┐
│ MA │ Type │ Length │ Color │ Purpose │
├────────────┼──────┼────────┼────────┼──────────────────────────┤
│ Fast EMA │ EMA │ 9 │ Red │ Immediate momentum │
│ Mid EMA │ EMA │ 21 │ Blue │ Short-term trend filter │
│ Slow SMA │ SMA │ 50 │ Blue │ Major trend confirmation │
└────────────┴──────┴────────┴────────┴──────────────────────────┘
GOLDEN RULE: Only BUY when Fast EMA > Mid EMA > Slow SMA (all up).
Only SELL when Fast EMA < Mid EMA < Slow SMA (all down).
================================================================================
SECTION 4 — TRADING SIGNALS
================================================================================
THE 4 SIGNAL TYPES
-------------------
┌─────────────┬────────────────────┬────────┬──────────────────────────────────┐
│ Signal │ Shape │ Color │ Trigger Condition │
├─────────────┼────────────────────┼────────┼──────────────────────────────────┤
│ BUY │ Label Up Arrow │ Green │ Demand zone + volume + uptrend │
│ SELL │ Label Down Arrow │ Red │ Supply zone + volume + downtrend │
│ BULL TRAP │ Triangle Down │ Orange │ Higher high but closes bearish │
│ BEAR TRAP │ Triangle Up │ Purple │ Lower low but closes bullish │
└─────────────┴────────────────────┴────────┴──────────────────────────────────┘
THE PERFECT BUY SETUP — Step by Step
--------------------------------------
Price drops into GREEN demand zone (GHST_LVT or GHST_BE)
Volume bar spikes — volume > 1.5x the 20-bar average
A bullish candle closes INSIDE the demand zone
All 3 MAs aligned upward: Fast EMA > Mid EMA > Slow SMA
BUY label appears on the chart
ENTER LONG — stop below the zone, target at TRP1 supply above
THE PERFECT SELL SETUP — Step by Step
---------------------------------------
Price rallies into RED supply zone (GHST_TRP1 or GHST_TRP2)
Volume bar spikes — volume > 1.5x the 20-bar average
A bearish candle closes INSIDE the supply zone
All 3 MAs aligned downward: Fast EMA < Mid EMA < Slow SMA
SELL label appears on the chart
ENTER SHORT — stop above the zone, target at LVT demand below
================================================================================
SECTION 5 — TRADE TRAPS
================================================================================
BULL TRAP (Orange Triangle Down)
-----------------------------------
What it is: Price breaks above a previous high (looks like a breakout),
then closes as a large bearish (red) candle.
Bulls are trapped long at the highs.
WHAT YOU SEE: YOUR ACTION:
• Price spikes above resistance • DO NOT buy the breakout
• Large RED candle closes below • Wait for next bearish candle + volume
• Orange triangle appears • Short the rejection at TRP1 zone
• GHST_TRP1 label fires • Target: LVT demand zone below
BEAR TRAP (Purple Triangle Up)
---------------------------------
What it is: Price breaks below a previous low (looks like a breakdown),
then closes as a large bullish (green) candle.
Bears are trapped short at the lows.
WHAT YOU SEE: YOUR ACTION:
• Price spikes below support • DO NOT short the breakdown
• Large GREEN candle closes above• Wait for next bullish candle + volume
• Purple triangle appears • Long the bounce at LVT/BE demand zone
• GHST_BE label fires • Target: TRP1 supply zone above
================================================================================
SECTION 6 — INFO PANEL & MTF TABLE
================================================================================
INFO PANEL (Top Right Corner)
-------------------------------
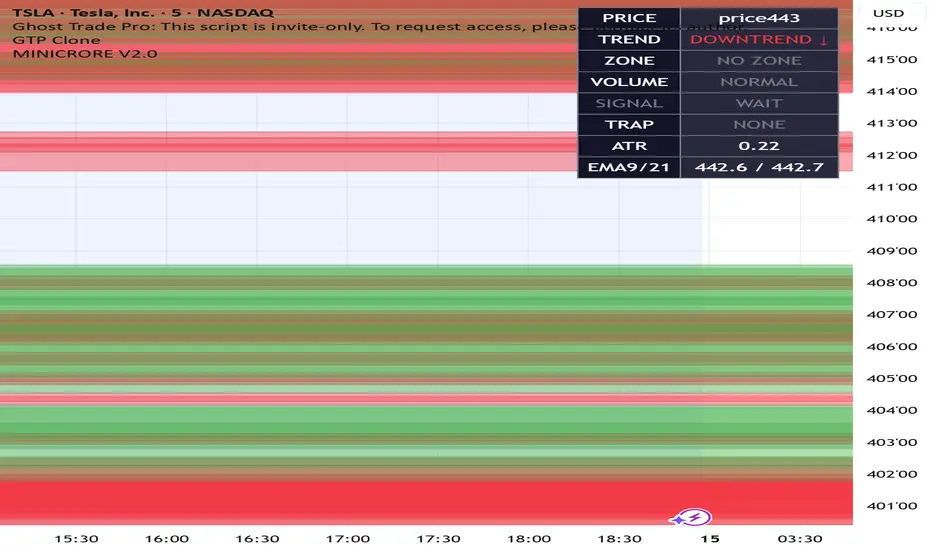
Real-time dashboard showing all key data in one place:
┌─────────────┬──────────────────────────────────────────────────┐
│ Row │ What It Shows │
├─────────────┼──────────────────────────────────────────────────┤
│ PRICE │ Current market price │
│ TREND │ UPTREND ↑ / DOWNTREND ↓ / RANGING ↔ │
│ ZONE │ Which zone price is in (SUPPLY / DEMAND / NONE) │
│ VOLUME │ SPIKE ↑ or NORMAL │
│ SIGNAL │ BUY ↑ / SELL ↓ / WAIT │
│ TRAP │ BULL TRAP / BEAR TRAP / NONE │
│ ATR │ Current volatility value (use for stop sizing) │
│ EMA 9/21 │ Fast and Mid EMA values │
└─────────────┴──────────────────────────────────────────────────┘
QUICK CHECK: Before any trade, panel should show:
→ TREND matches your direction
→ ZONE shows SUPPLY or DEMAND
→ VOLUME shows SPIKE
→ SIGNAL shows BUY or SELL
→ TRAP shows NONE
MTF TABLE (Middle Right — Multi-Timeframe)
-------------------------------------------
Shows trend bias across 4 timeframes simultaneously:
┌────────────┬──────────────────────────────┬──────────────────┐
│ Timeframe │ How Calculated │ Arrow Up = Buy │
├────────────┼──────────────────────────────┼──────────────────┤
│ 1H │ 50 EMA vs 200 EMA │ 50 EMA > 200 EMA │
│ 4H │ Price vs 50 EMA │ Close > 50 EMA │
│ D │ Price vs 200 SMA │ Close > 200 SMA │
│ W │ Fast MA vs Slow MA │ EMA9 > SMA50 │
└────────────┴──────────────────────────────┴──────────────────┘
BEST TRADES: All 4 arrows point same direction
4x UP ↑↑↑↑ = Strongest buy environment
4x DOWN ↓↓↓↓ = Strongest sell environment
MIXED ↑↓↑↓ = Avoid or reduce position size
================================================================================
SECTION 7 — SETTINGS REFERENCE
================================================================================
ZONE SETTINGS
--------------
TRP1 Supply Lookback default: 20 M2K11 rec: 15-20 (bars to find swing high)
TRP2 Supply Lookback default: 40 M2K11 rec: 30-40 (broader confirmation)
TRP1 Demand Lookback default: 20 M2K11 rec: 15-20 (bars to find swing low)
TRP2 Demand Lookback default: 40 M2K11 rec: 30-40 (broader confirmation)
Zone Width (ATR x) default: 0.3 M2K11 rec: 0.25-0.40 (height of boxes)
VOLUME & ATR SETTINGS
----------------------
Volume Avg Length default: 20 Tight: 20 Volatile: 10-15 (faster)
Spike Multiplier default: 1.5 Tight: 1.3 Volatile: 2.0 (only big)
ATR Length default: 14 Tight: 14 Volatile: 10 (reactive)
MOVING AVERAGE SETTINGS
------------------------
┌──────────┬─────────┬──────────────┬────────────────┬──────────────┐
│ MA │ Default │ Scalping │ Day Trading │ Swing │
│ │ │ (1-5 min) │ (15m-1H) │ (4H-D) │
├──────────┼─────────┼──────────────┼────────────────┼──────────────┤
│ Fast EMA │ 9 │ 5 │ 9 │ 20 │
│ Mid EMA │ 21 │ 13 │ 21 │ 50 │
│ Slow SMA │ 50 │ 34 │ 50 │ 200 │
└──────────┴─────────┴──────────────┴────────────────┴──────────────┘
CHANNEL SETTINGS
-----------------
Channel Length default: 50 Lower = tighter channel, Higher = smoother
================================================================================
SECTION 8 — RISK MANAGEMENT & POSITION SIZING
================================================================================
STOP LOSS RULES
----------------
• Place stop OUTSIDE the zone — beyond the edge, not at it
• BUY trades: stop below the bottom of GHST_BE (teal) zone
• SELL trades: stop above the top of GHST_TRP1 (red) zone
• Formula: stop = zone edge + 1x ATR value from panel
TAKE PROFIT RULES
------------------
• Primary target: opposite zone (buy LVT → take profit at TRP1)
• Scale out: take 50% at zone midline, let 50% run to full target
• Secondary target: regression channel upper/lower line
• Minimum Risk/Reward required: 1:1.5 (never accept less)
POSITION SIZING FOR M2K11 (Russell Micro)
------------------------------------------
Note: 1 point on M2K11 = $5. A 20-point stop = $100 risk per contract.
┌─────────────┬───────────────────┬─────────────┬─────────────┐
│ Account │ Risk Per Trade 2% │ Stop (pts) │ Contracts │
├─────────────┼───────────────────┼─────────────┼─────────────┤
│ $5,000 │ $100 │ 20 pts │ 1 contract │
│ $10,000 │ $200 │ 20 pts │ 2 contracts │
│ $25,000 │ $500 │ 20 pts │ 5 contracts │
│ $50,000 │ $1,000 │ 20 pts │ 10 contracts│
└─────────────┴───────────────────┴─────────────┴─────────────┘
RULE: Never risk more than 2% of account on any single trade.
================================================================================
SECTION 9 — PRE-TRADE CHECKLIST
================================================================================
Complete ALL items before EVERY trade. If fewer than 8/10 pass → DON'T trade.
1. Price is at a clear supply or demand zone (TRP1, TRP2, LVT, or BE)
2. Volume spike confirmed (Info panel shows SPIKE)
3. Moving averages aligned with trade direction
4. MTF table shows at least 3 of 4 arrows in trade direction
5. No active Bull or Bear trap (panel shows NONE)
6. Reversal candle present inside the zone
7. Stop loss level identified (beyond zone + 1x ATR)
8. Take profit target at opposite zone identified
9. Risk/Reward is at least 1:1.5
10. Position size calculated (max 2% account risk)
================================================================================
SECTION 10 — COMMON MISTAKES TO AVOID
================================================================================
┌────────────────────────────────┬──────────────────────────────────────────┐
│ MISTAKE │ CORRECT APPROACH │
├────────────────────────────────┼──────────────────────────────────────────┤
│ Trading without volume spike │ Only enter when panel shows SPIKE │
│ Buying into a Bull Trap signal │ Orange triangle = skip or short instead │
│ Ignoring the MTF table │ Need 3+ arrows in your direction │
│ Stop too tight (inside zone) │ Place stop beyond zone + 1 ATR │
│ Taking partial zone signals │ ALL 10 checklist items must pass │
│ Overtrading (forcing setups) │ Max 2-3 high quality trades per day │
│ Moving stop to BE too fast │ Move stop only after 1:1 achieved │
│ Trading against MTF trend │ Trade only with the dominant trend │
└────────────────────────────────┴──────────────────────────────────────────┘
================================================================================
QUICK REFERENCE — SIGNAL CHEAT SHEET
================================================================================
AT GREEN DEMAND ZONE (LVT or BE):
Need: Bullish candle + Volume spike + MAs up + 3+ MTF arrows up
Do: BUY | Stop: below zone | Target: TRP1 supply above
AT RED SUPPLY ZONE (TRP1 or TRP2):
Need: Bearish candle + Volume spike + MAs down + 3+ MTF arrows down
Do: SELL | Stop: above zone | Target: LVT demand below
ORANGE TRIANGLE (Bull Trap):
Do NOT buy the breakout → Look to short the rejection instead
PURPLE TRIANGLE (Bear Trap):
Do NOT short the breakdown → Look to buy the bounce instead
MTF ALL UP ↑↑↑↑: Strongest buy environment — trade full size
MTF ALL DOWN ↓↓↓↓: Strongest sell environment — trade full size
MTF MIXED ↑↓: Reduce size or skip entirely
================================================================================
THE GOLDEN RULE
ZONE + VOLUME + TREND = HIGH PROBABILITY TRADE
If any one of these three is missing — wait for a better setup.
================================================================================
ATP Pro v2 | Pine Script v6 | TradingView
================================================================================
Indicator

MINICRORE V2.0# ADVANCED TRADING ZONES PRO (ATP Pro)
## QUICK REFERENCE CARD - 1 PAGE CHEAT SHEET
---
## COMPONENTS AT A GLANCE
| Component | Color | Meaning | Action |
|-----------|-------|---------|--------|
| **Bollinger Bands** | Gray | Price volatility levels | Trade within bands, watch for breakouts |
| **Fast MA (50)** | Blue | Short-term trend | Should be above Slow MA for uptrend |
| **Slow MA (200)** | Orange | Long-term trend | Should be below Fast MA for downtrend |
| **SUPPLY Zone** | Red box | Resistance area | SELL if price rejects here + volume |
| **DEMAND Zone** | Green box | Support area | BUY if price bounces here + volume |
| **BULL TRAP** | Orange label | Price makes HH but closes red | DON'T BUY - SELL instead |
| **BEAR TRAP** | Magenta label | Price makes LL but closes green | DON'T SELL - BUY instead |
| **Volume Spike** | Blue volume | Abnormal volume | CONFIRM all signals with volume |
| **ATR Bands** | Purple dots | Volatility expansion | Wide = breakout likely, Narrow = squeeze |
---
## 6 CORE TRADING RULES
### RULE #1: VOLUME OR NOTHING
❌ Don't trade zones without volume spike
✅ Only trade when volume bar is BLUE
### RULE #2: TREND IS KING
❌ Don't buy below moving averages
✅ Only buy above Fast MA (blue line)
❌ Don't sell above moving averages
✅ Only sell below Fast MA (blue line)
### RULE #3: ZONE + VOLUME + TREND = SIGNAL
```
ENTRY CONDITIONS (ALL 3 REQUIRED):
1. Price at supply/demand zone
2. Blue volume bar visible
3. Price above/below moving average (depending on direction)
→ THEN: Take the trade
```
### RULE #4: AVOID TRAPS
✅ See BULL TRAP → SHORT (don't buy)
✅ See BEAR TRAP → LONG (don't sell)
### RULE #5: ZONES ARE TARGETS
```
Entry at Demand Zone 2,790
→ Take Profit at Supply Zone 2,820
Entry at Supply Zone 2,840
→ Take Profit at Demand Zone 2,790
```
### RULE #6: RISK/REWARD RATIO
```
Stop Loss: Width of the zone (or 20-50 points)
Take Profit: Next zone
Minimum Risk/Reward: 1:1
Target Risk/Reward: 1:2 or better
```
---
## TRADING SIGNALS AT A GLANCE
### SIGNAL #1: DEMAND ZONE BOUNCE (BUY) 🟢
```
Price hits green DEMAND zone
+ Blue volume bar appears
+ Price above blue MA (50)
→ BUY
Stop Loss: Below the zone
Take Profit: At red supply zone above
Probability: 75-80%
```
### SIGNAL #2: SUPPLY ZONE REJECTION (SELL) 🔴
```
Price hits red SUPPLY zone
+ Blue volume bar appears
+ Price below blue MA (50)
→ SELL
Stop Loss: Above the zone
Take Profit: At green demand zone below
Probability: 75-80%
```
### SIGNAL #3: BULL TRAP REVERSAL (SELL) 🟠
```
Price makes higher high (breaks resistance)
LABEL appears: "BULL TRAP"
Closes with large RED candle
→ SHORT the rejection
Stop Loss: Above the high
Take Profit: Back at previous support
Probability: 70-75%
```
### SIGNAL #4: BEAR TRAP REVERSAL (BUY) 🟣
```
Price makes lower low (breaks support)
LABEL appears: "BEAR TRAP"
Closes with large GREEN candle
→ LONG the bounce
Stop Loss: Below the low
Take Profit: Back at previous resistance
Probability: 70-75%
```
### SIGNAL #5: MOVING AVERAGE CROSSOVER (TREND CHANGE)
```
Golden Cross (Blue crosses above Orange)
→ UPTREND confirmed
Next pullback = BUY opportunity
Death Cross (Blue crosses below Orange)
→ DOWNTREND confirmed
Next rally = SELL opportunity
```
### SIGNAL #6: BOLLINGER BAND SQUEEZE (WAIT)
```
Bands are narrowing = LOW VOLATILITY
Bands are separating = HIGH VOLATILITY
→ Wait for breakout from squeeze
→ Trade in direction of break with volume
```
---
## SETTINGS FOR YOUR TIMEFRAME
| Timeframe | Use | Bollinger Length | MA1/MA2 | Zone Height |
|-----------|-----|------------------|---------|-------------|
| **5-min** | ⚠️ Fast trading | 15 | 20/50 | 15-25 |
| **15-min** | ✅ RECOMMENDED | 20 | 50/200 | 30-50 |
| **1-hour** | ✅ EXCELLENT | 20 | 50/200 | 50-100 |
| **4-hour** | ✅ EXCELLENT | 25 | 50/200 | 100-150 |
| **Daily** | ✅ GOOD | 30 | 50/200 | 200+ |
---
## POSITION SIZING FOR M2K11 (MICRO RUSSELL)
**Using $5,000 Account:**
```
Margin per contract: $50 (from broker comparison)
Risk per trade: 2% = $100
Stop loss: 20 points = $100 risk
→ Position: 1 contract (standard)
For aggressive traders:
Risk per trade: 3% = $150
Stop loss: 30 points = $150 risk
→ Position: 1 contract (still 1 because micro)
NEVER use more than 3 contracts even with $5,000
```
---
## QUICK TRADING CHECKLIST
Before EVERY trade:
- Price at clear supply/demand zone?
- Volume spike visible (blue bar)?
- Price in trend (above/below fast MA)?
- No bull trap or bear trap visible?
- Risk/Reward at least 1:1?
- Position size correct for account?
- Stop loss set BEFORE entering?
- Take profit target at opposite zone?
If ANY checkbox is empty → DON'T TRADE
---
## WIN RATE EXPECTATIONS
| Signal Type | Accuracy | Frequency |
|-------------|----------|-----------|
| Demand zone + volume | 75-80% | 5-10 per day |
| Supply zone + volume | 75-80% | 5-10 per day |
| Trade traps | 70-75% | 2-5 per day |
| Moving average crossover | 55-60% | 1-3 per week |
| Bollinger band bounce | 60-65% | 5-15 per day |
**Expected Results (with proper risk management):**
- 2% risk per trade
- 75% win rate signal
- 4:1 reward ratio
= ~2% account growth per trade
---
## MOST COMMON MISTAKES
❌ Trading without volume confirmation
❌ Trading against the moving average trend
❌ Entering at the zone (use the bounce/rejection)
❌ Overleveraging position size
❌ Not using stop losses
❌ Not taking profits at targets
❌ Trading too many times (only best signals)
❌ Changing settings too often
❌ Not tracking trades in journal
---
## INSTALLATION & SETUP (5 MINUTES)
1. Open TradingView.com
2. Click "Pine Script Editor"
3. Paste the indicator code
4. Click "Add to Chart"
5. Right-click indicator → Settings
6. Adjust for your timeframe
7. Click OK
8. Enable Notifications (bell icon)
9. Practice on DEMO account first
10. Go live when comfortable
---
## KEY NUMBERS TO REMEMBER
**Default Settings:**
- Fast MA: 50 periods
- Slow MA: 200 periods
- Bollinger: 20 periods, 2.0 std dev
- Volume multiplier: 1.5x average
- ATR: 14 periods
**Trade Sizing (M2K11 on $5,000):**
- Margin: $50 per contract
- Risk: $100-150 per trade (2-3%)
- Contracts: 1-2 max
- Stop: 20-30 points
**Signal Strength:**
- With zone + volume + trend: 75% win rate
- With zone + volume only: 60-65% win rate
- With volume only: 45-50% win rate
- Avoid: Trading without volume
---
## REMEMBER
✨ **Simple = More Profitable**
- Use ONLY the clearest signals
- More trades ≠ More profit
- Quality > Quantity
- Patient traders win
✨ **Risk Management is Everything**
- Small position sizes
- Consistent stop losses
- Always know max loss before entering
- 1% account risk = Sustainable trading
✨ **The Indicator is a Tool, Not Magic**
- Works best on 15-min to 4H charts
- Works best in liquid markets (M2K11 liquid)
- Works best with proper discipline
- Works best with consistent rules
---
## NEED HELP?
1. Check the full guide
2. Review examples in documentation
3. Practice on demo 5-10 times
4. Track results in trading journal
5. Adjust based on YOUR market experience
**Most Important:** Start small, be patient, follow the rules!
Good luck! 📊📈
Indicator
Indicator

Indicator

maXXit LevelTRG [V6 2.0]# maXXit Level Trigger — Overview
**Platform:** TradingView Pine Script v6 · Overlay indicator
---
## What does the Level Trigger do?
The Level Trigger automates trade entries and exits based on a freely configurable price level. False breakouts are filtered by an **N-closes confirmation** — only after N consecutive candles close through the level is an action triggered. The trigger fires JSON alerts to an external webhook server connected to a broker API (IBKR, OANDA, IG Markets).
If the signal generation is based on futures contracts (highly recommended), the mirror instruments are mapped through configurable parameters inside the script to the pre-configured broker API. The trigger does not fire position entries or exits inside TradingView directly. A plain-text message can be sent as an alternative.
All state machine logic runs **live only** — no historical replay arming.
---
## Flow (State Machine)
```
1. ARMED — Price touches the trigger level from the opposite side (intrabar, live bar only)
2. ENTRY — N consecutive closes back through the level → BUY / SELL alert
3. POSITION — Stop and TP monitor the open position
4. EXIT — SL or TP fires → closing order alert
```
---
## Features
| Feature | Description |
|---|---|
| **Long & Short** | Both directions configurable |
| **N-Closes (1–3)** | Consecutive closes required for arming confirmation, entry and SL/TP (Close mode) |
| **Live arming only** | Trigger arms only on real-time bars — no historical replay |
| **Trigger-level stop** | N closes back through the trigger level = automatic stop exit. Active only when no Absolute SL is set |
| **Absolute Stop Loss** | A separate SL level — fires immediately on intrabar touch, no close confirmation. When set, the trigger-level stop is deactivated |
| **Take Profit — Close mode** | TP arms on intrabar touch (high/low crosses TP level), exits on N consecutive closes back through TP |
| **Take Profit — Touch mode** | Exit fires immediately on intrabar TP touch |
| **Trailing stop** | Auto-stop locks at the TP level when TP is first reached — acts as a floor stop while price runs |
| **JSON alerts** | Direct broker integration (IBKR, OANDA, IG Markets) via webhook |
| **Symbol mapping** | Pre-defined instrument parameters for 15+ futures/CFDs |
| **Lock to Symbol** | Trigger stays bound to the selected instrument ticker prefix across chart changes |
| **Position Lock** | Preserves position state (LONG/SHORT) when inputs are changed mid-trade |
| **Fractal Grid** | Optional overlay of highest-high / lowest-low grids (5 levels, 10–50 bars) |
---
## Stop Loss Logic — Three-tier hierarchy
Only one tier is active at a time:
| Priority | Condition | Stop mechanism | Trigger |
|---|---|---|---|
| **1 — Absolute SL** | SL Level > 0 | Fixed price level | Intrabar touch — immediate |
| **2 — Auto-SL (TP lock)** | TP reached → auto_sl set | Old TP level becomes new stop | N consecutive closes through the level |
| **3 — Trigger-level stop** | No SL, no auto_sl | Trigger level acts as stop | N consecutive closes |
### How tiers interact
- When **Absolute SL is set**: tiers 2 and 3 are deactivated. Only the intrabar stop fires.
- When **TP is reached** (intrabar touch in Close mode): the TP level locks as a trailing stop (`auto_sl`). The Absolute SL can now be removed — `auto_sl` takes over with N-close confirmation.
- When **neither SL nor auto_sl is active**: the trigger level itself acts as the stop (N closes back through it).
### After a stop fires
The trigger does not re-arm automatically. To re-activate, change the Trigger Level input — this resets all state.
---
## Worked Example — LONG, N = 2 closes
**Setup:** Direction = LONG · Trigger = 5000 · TP = 5100 · Closes required = 2
### Phase 1 — Entry
| Event | What happens |
|---|---|
| Price dips below 5000 (intrabar, live) | Trigger **arms** — indicator starts watching |
| Price rises, 2 consecutive closes above 5000 | **Entry alert fired** → BUY order sent · stop activates at 5000 |
| Price dips back, 2 closes below 5000 (before TP) | **Stop exit** → SELL alert · trigger deactivates |
### Phase 2a — TP exit (Close mode, price reverses after TP)
| Event | What happens |
|---|---|
| Price rises through 5100 (intrabar) | TP **arms** — stop locks at 5100, indicator waits for reversal |
| Price falls back, 2 consecutive closes below 5100 | **TP exit alert** → SELL order sent · position closed |
### Phase 2b — Trailing stop (price keeps running above TP)
| Event | What happens |
|---|---|
| Price rises through 5100 | TP arms — stop **locks at 5100** (yellow line) |
| Price continues above 5100 | Position stays open · stop remains at 5100 |
| User raises TP to 5200 | `tp_armed` resets · stop stays locked at old 5100 level (use Active Position to preserve state) |
| Price reaches 5200 | Stop locks at 5200 |
| Price falls, 2 closes below 5200 | **Stop exit alert** → SELL order sent |
> The locked stop (old TP level) works exactly like the trigger-level stop: N consecutive closes through the level fire the exit.
### Workflow — raising TP while stop is locked
Pine Script resets all computed state (`tp_armed`, `auto_sl`) on every input change. To preserve the locked stop when raising TP:
| Step | Action |
|---|---|
| 1 | Note the current locked stop level (yellow line, e.g. 5100) |
| 2 | Set **Active Position** = `LONG` (or `SHORT`) |
| 3 | Set **Trigger Level** = locked stop value (e.g. 5100) |
| 4 | Set **TP Level** = new target (e.g. 5200) |
| 5 | After recalc: position restored · Trigger Level acts as stop · new TP active |
> **Why Trigger Level:** it is a persistent input that survives recalculation. When in position with no Absolute SL and no `auto_sl`, the trigger level acts as the N-closes stop.
---
## Visual Display
### Trigger label (at trigger level)
| State | Label | Color |
|---|---|---|
| Armed, LONG direction | TOUCHED ↑ | Green |
| Armed, SHORT direction | TOUCHED ↓ | Red |
| Active LONG position | LONG ↑ | Green |
| Active SHORT position | SHORT ↓ | Red |
| SL/Trigger crossed while in position | CAUTION | Orange |
| TP armed (acting as SL) | IDLE | Gray |
| No trigger configured | IDLE | Gray |
### SL label (at SL level)
| State | Label | Color |
|---|---|---|
| In LONG position | ARMED ▼ | Dark orange |
| In SHORT position | ARMED ▲ | Dark orange |
| Armed, LONG direction | ARMED ▼ | Dark orange |
| Armed, SHORT direction | ARMED ▲ | Dark orange |
| Hidden when TP is armed (TP line acts as SL) | — | — |
### TP label (at TP level)
| State | Label | Color |
|---|---|---|
| Position open, TP not yet reached | TP ACTIVE | Green |
| TP reached, acting as trailing stop (LONG) | SL ACTIVE ↑ | Green |
| TP reached, acting as trailing stop (SHORT) | SL ACTIVE ↓ | Red |
| TP exit just fired | TP CLOSED | Gray |
| No position | IDLE | Gray |
### Lines
- **Trigger line** — dashed · color matches trigger label state
- **SL line** — solid · dark orange when armed or in position · hidden when TP is acting as SL
- **TP line** — dashed · green (active) · color matches TP label state
- **Auto-SL line** — solid yellow · shows locked stop level when TP has armed
---
## Design Decisions & Rationale
### Why live-only arming (`barstate.isrealtime`)
All state machine logic runs only on real-time bars. Trigger levels are set manually based on the current Elliott Wave analysis. A historical simulation of manually-set levels would be meaningless — the level is valid only in the context of the current wave structure. Live-only arming ensures clean state on each session start and prevents false fills from historical data replay.
### Why the trigger does not re-arm automatically after exit
After a trade closes, re-entry at the same level requires re-analysis and a conscious decision. Re-arming is triggered by changing the Trigger Level input, which reloads all state. This is intentional: the wave structure has either confirmed or invalidated at that level.
### Why position sizing is manual
Risk per trade depends on the SL distance, which varies with each wave setup. The analyst calculates `quantity = max_risk_USD / (entry_price - SL_level)` before setting inputs. Automating this inside the script would require the entry price to be known in advance, which conflicts with the trigger-based entry mechanism.
### Why TradingView webhooks (no direct broker connection)
TradingView provides the charting and signal generation layer. The broker API integration lives in a separate webhook server. This separation keeps the Pine Script simple and broker-agnostic — switching brokers requires only a server-side change, not a script rewrite.
### Why N-closes confirmation instead of intrabar triggers
Intrabar wicks frequently penetrate Elliott levels without confirming. N confirmed closes through a level provide meaningful structure confirmation — a wick is noise, a close is a statement. The cost is a few points of slippage on the entry; the benefit is fewer false signals.
### Why TP Close mode arms on intrabar touch (not N closes)
TP is a profit target, not a structural level. Waiting for N closes above the TP level before arming would delay the trailing stop activation unnecessarily — the first intrabar touch is sufficient evidence that the target was reached. The exit itself still requires N closes back through the TP level, preserving the confirmation logic on the way out.
---
## Settings Reference
| Input | Group | Description |
|---|---|---|
| Send JSON Alert | Account & Broker | ON = JSON webhook · OFF = plain-text alert |
| Webhook Secret | Account & Broker | Token included in JSON payload for server authentication |
| Account ID | Account & Broker | Broker account identifier (IBKR, OANDA, IG Markets, etc.) |
| Use predefined mapping | Instrument | Uses built-in symbol → broker mapping table |
| Mirror Trade | Instrument | NO = trade the chart future · YES = trade mirror instrument (STK/CFD) |
| Mirror Instrument | Instrument | STK (IBKR ETF) or CFD (OANDA / IG Markets) |
| Quantity | Instrument | Size of the order |
| Direction | Level Trigger | LONG or SHORT |
| Trigger Level | Level Trigger | Price level. 0 = disarmed |
| Stop Loss Level | Level Trigger | Absolute SL. 0 = use trigger-level stop instead |
| TP Level | Level Trigger | Take profit level. 0 = disabled |
| TP Arm Mode | Level Trigger | Touch = immediate intrabar exit · Close = N-close reversal confirmation |
| Closes required | Level Trigger | 1–3 consecutive closes needed for arming, entry and SL/TP |
| Lock to Symbol | Level Trigger | Ticker prefix to lock trigger to one instrument (e.g. MNQ, FXXP) |
| Active Position | Level Trigger | Auto / LONG / SHORT — preserves position state across input changes |
| Fractal Grid | Position Management | Shows highest-high / lowest-low grid overlay |
---
## Supported Instruments
| Prefix | Instrument | Exchange | Mirror (STK) | Mirror (CFD OANDA) | Mirror (CFD IG) |
|---|---|---|---|---|---|
| MNQ | Micro Nasdaq-100 | CME | QQQ | NAS100_USD | NASDAQ |
| MES | Micro S&P 500 | CME | SPY | SPX500_USD | SPTRD |
| MYM | Micro Dow Jones | CBOT | DIA | US30_USD | DOW |
| FXXP / FSXE | Euro Stoxx 50 | EUREX | IMEU | EU50_EUR | STXE |
| MGC | Micro Gold | COMEX | GLD | XAU_USD | SPOTGOLD |
| MCL | Micro Crude Oil | NYMEX | USO | WTICO_USD | USOIL |
| MNG | Micro Nat Gas | NYMEX | — | NATGAS_USD | NATURALGAS |
| MHG | Micro Copper | COMEX | — | XCU_USD | COPPER |
| ZW | Wheat | CBOT | — | WHEAT_USD | — |
| ZN | 10Y T-Note | CBOT | — | USB10Y_USD | — |
| CN1 | FTSE China A50 | SGX | — | CN50_USD | — |
| EURUSD | EUR/USD Spot | IDEALPRO | — | EUR_USD | — |
| BTCUSD | Bitcoin | — | — | BTC_USD | BITCOIN |
| ETHUSD | Ethereum | — | — | ETH_USD | ETHUSD |
---
## Later Enhancements Planned
| # | Enhancement | Rationale |
|---|---|---|
| **1** | **Multi-level trigger** — two simultaneous trigger levels with independent directions | Allows monitoring Wave 3 and Wave 5 levels simultaneously without two separate chart instances |
| **2** | **Partial exits / scale-out** — e.g. 50% at TP1, remainder with trailing stop | Elliott Wave extensions are common; closing the full position at the first TP level often leaves significant profit on the table |
| **3** | **Volatility-adaptive N-closes** — automatically tighten/loosen confirmation count based on ATR or session volatility | A single N-close setting behaves differently in a quiet overnight session vs. a high-impact news event |
Indicator

Indicator
Swing Delta Pressure | julzALGO📊 Swing Delta Pressure | julzALGO
🔷 1. Overview
Swing Delta Pressure is a swing-anchored directional pressure framework that combines market structure, estimated buy/sell participation, delta imbalance, and a pressure-weighted trend path into one integrated overlay.
The script is designed to help traders evaluate not only where price is moving, but whether buyer or seller participation is supporting that movement.
By combining swing detection with candle anatomy and directional participation modeling, Swing Delta Pressure can be used for:
• Initial swing flip detection
• Pullback observation
• Retest continuation planning
• Directional pressure confirmation
• Risk-to-reward execution planning
🔷 2. Core Concept
Traditional indicators often focus mainly on price movement, standard volume, or static smoothing.
Swing Delta Pressure expands this by integrating:
• Swing high / swing low structure
• Estimated buy volume
• Estimated sell volume
• Delta volume
• Pressure acceleration
• Participation weighting
• Swing-anchored pressure path
• Dynamic RR zones
The core idea is simple:
Each new swing establishes a structural anchor point.
From that anchor:
• Buyer and seller participation are estimated
• Delta pressure is accumulated
• Price is weighted by participation strength
• The active pressure path updates until the next structural swing flip
Where volume calculation starts:
Buy Volume (B), Sell Volume (S), Delta (Δ), and Imbalance (%) begin calculating from the swing anchor pivot marker and continue accumulating through each new bar until the next confirmed swing flip occurs.
Simple rule:
Swing Anchor Pivot → Present Active Bar
Bullish swing:
When a bullish swing is confirmed, volume tracking starts from the swing low anchor.
Bearish swing:
When a bearish swing is confirmed, volume tracking starts from the swing high anchor.
Reset rule:
When a new opposite swing flip occurs:
• Previous swing totals stop
• Previous path becomes historical
• New swing totals reset
• New cumulative tracking begins
Important:
B / S / Δ / % values are not single-candle values.
They represent cumulative estimated directional participation from the swing origin to the current active bar.
This helps traders evaluate whether the full active swing remains buyer- or seller-dominant, even during pullbacks or retests.
🔷 3. How It Works
The Swing Engine continuously tracks rolling swing highs and lows using the selected swing detection length.
This identifies:
• Bullish swing flips
• Bearish swing flips
• Structural pivots
• Active anchor zones
The Delta Pressure Engine estimates buyer and seller participation using:
• Candle body size
• Upper wick behavior
• Lower wick behavior
• Close position within candle range
• Relative volume intensity
• Delta acceleration
Instead of treating every candle equally, the pressure path weights price using directional participation.
High-participation candles influence the path more strongly than weak candles. This creates a more adaptive flow path compared with standard smoothing.
The RR system can project:
• Entry
• Stop Loss
• Take Profit
This allows traders to combine structure, participation, and visual risk planning in one workflow.
Visual interpretation:
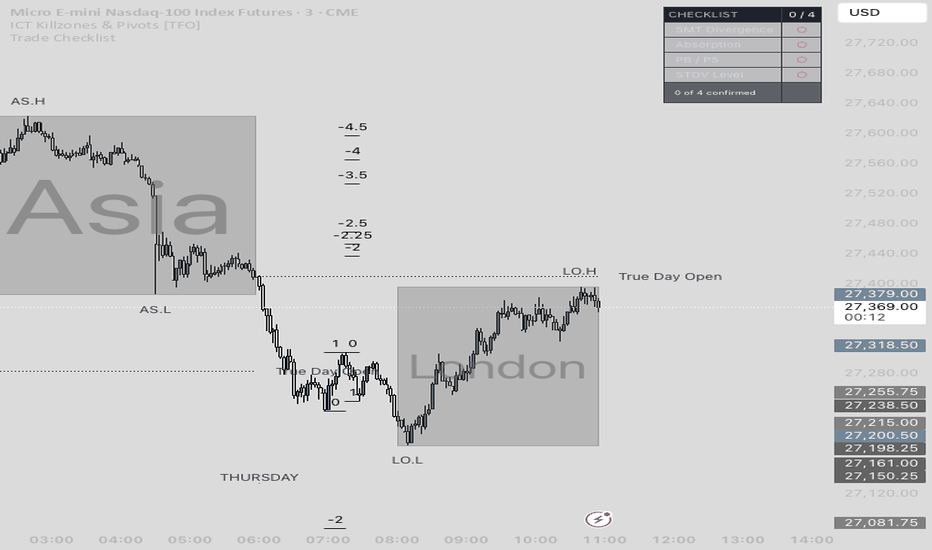
• Blue path = Bullish directional pressure
• Purple path = Bearish directional pressure
• Blue anchor marker = Bull swing anchor where volume tracking starts
• Purple anchor marker = Bear swing anchor where volume tracking starts
• B = Estimated buyer participation from anchor to present bar
• S = Estimated seller participation from anchor to present bar
• Δ = Delta pressure from anchor to present bar
• % = Active swing imbalance strength
🔷 4. Settings
Swing Detection Length
Controls the sensitivity of structural swing flips.
Suggested reference:
• 20–30 = Faster / scalping
• 40–60 = Balanced / intraday
• 80+ = Higher timeframe / smoother
Weight Mode
Participation:
Balanced swing participation and stable path behavior.
Delta Absolute:
More reactive directional shifts.
Smart Pressure:
Higher sensitivity to stronger impulse moves.
Volume Mean / StdDev Length
Controls participation normalization.
Suggested reference:
• 100 = More reactive
• 200 = Balanced
• 300+ = Smoother
Stop Loss Type
ATR:
Adaptive volatility-based stop.
Pivot:
Structure-based stop.
ATR Multiplier
Suggested reference:
• 1.5 = Tight
• 2.0 = Balanced
• 2.5+ = Wider
Risk:Reward
Suggested reference:
• 1.5 = Conservative
• 2.0 = Balanced
• 3.0 = Extended trend target
General preset:
• Swing Length: 50
• Weight Mode: Participation
• Stop Loss Type: Pivot or ATR depending on strategy
• ATR Multiplier: 2.0–3.0
• Risk:Reward: 2.0
🔷 IMPORTANT NOTES
• This indicator does not guarantee profits and should not be used in isolation
• Market conditions can vary; always apply proper risk management
• Past performance does not indicate future results
🔷 DISCLAIMER
This script is for educational and informational purposes only.
It does not constitute financial advice. Always do your own analysis before making trading decisions.
Indicator

Impulse Follow-Through Quality [AGPro Series]Impulse Follow-Through Quality
🧠 Core Idea
Did the impulse receive enough follow-through to remain valid?
📌 Overview / What it does
Impulse Follow-Through Quality is a chart-first momentum expansion planner built to evaluate what happens after a strong impulse candle appears.
Instead of treating every strong candle as a standalone signal, the script starts a follow-through review window and measures whether price extends, pauses constructively, pulls back too deeply, reaches a target-room guide, or crosses a failure rail. These elements are converted into a 0-100 Impulse Quality score and a clear next-action state.
The script produces an impulse highlight, follow-through box, failure rail, measured target guide, compact labels, alerts, and a clean AGPro planning panel. It does not predict continuation, automate trades, or guarantee that momentum will continue.
🎯 Purpose & Design Philosophy
This script was built for traders who want to separate a meaningful impulse from a candle that only looks strong for one bar.
Many momentum tools focus on the impulse itself. The practical question often comes after that candle: does the move attract follow-through, or does it begin to fail? This planner fills that gap by turning the post-impulse phase into a readable decision process.
The design supports a patient review mindset: identify the impulse, watch the follow-through window, evaluate pullback depth, check target room, and review the failure rail before reacting.
⚡ Why This Script Is Different
Most tools focus on strong candles, volume spikes, momentum bursts, or basic continuation labels.
This script does NOT act as a Volume Climax Detector, does NOT rebuild an Institutional Candle Detector, and does NOT reduce the chart to a simple buy/sell momentum signal.
Instead, it evaluates what happens after the impulse. The key output is not the candle itself. The key output is the follow-through quality state: IMPULSE, WAIT FT, FT WATCH, VALID FT, PULLBACK RISK, WEAK FT, FAILED, or TARGET REVIEW.
⚙️ Methodology
1. Context Detection
The script detects qualified bullish or bearish impulse candles using ATR-normalized range, body efficiency, close location, trend context, and participation.
2. Reference Mapping
Once an impulse qualifies, the script maps the impulse origin, follow-through box, failure rail, and target-room guide.
3. Reaction Evaluation
The model evaluates follow-through progress, closes beyond the impulse close, retracement depth, participation support, target room, and whether price crosses the failure rail.
4. Visual Output
The result is displayed through an impulse highlight, centered follow-through box label, failure rail, target guide, compact labels, deterministic alerts, and a premium AGPro panel.
🗺️ How to Read the Chart
Impulse Highlight = the latest qualified impulse leg that starts the review window.
Follow-Through Box = the active planning area between the impulse close and the measured target-room guide. Its label is centered inside the box.
Failure Rail = the practical invalidation reference behind the impulse. It is an analytical line, not a stop order.
Target Guide = a measured target-room reference based on the impulse range.
Labels = compact state markers for impulse start, constructive follow-through, weak follow-through, pullback risk, failure rail review, and target review.
Colors = teal supports constructive long-side follow-through, pink supports short-side or failure context, amber marks review risk, and indigo marks watch states.
Panel = summarizes Impulse Quality, Follow-Through, Pullback Risk, Target Room, and Action.
🚦 Signals & States
• IMPULSE → a qualified impulse candle has started a review window.
• WAIT FT → the impulse exists, but follow-through is not confirmed yet.
• FT WATCH → follow-through conditions are improving but not strong enough for the highest state.
• VALID FT → follow-through quality is constructive according to the rule set.
• PULLBACK RISK → retracement depth is elevated inside the impulse range.
• WEAK FT → the follow-through window is aging without enough progress.
• FAILED → price crossed the failure rail behind the impulse.
• TARGET REVIEW → price reached the measured target-room guide and context should be reviewed.
🔔 Alerts Logic
Alerts can trigger when a new impulse starts, follow-through becomes constructive, follow-through enters watch state, the move weakens, pullback risk rises, price crosses the failure rail, or price reaches the target-room guide.
Each alert is an attention marker. Alerts are not trade instructions, entry commands, exit commands, or automated strategy rules.
🧩 Confluence Logic
The strongest context appears when a clean impulse candle is followed by measurable progress, multiple closes beyond the impulse close, controlled retracement depth, supportive participation, and readable target room.
When these components weaken, the planner can shift toward WAIT FT, FT WATCH, PULLBACK RISK, WEAK FT, or FAILED.
📊 When to Use
• After strong momentum candles where continuation quality matters.
• During trend continuation attempts that need follow-through review.
• After breakout or expansion bars where a one-bar move may be misleading.
• On liquid symbols where ATR, candle structure, and volume behavior are readable.
• When you want a post-impulse planning map instead of another raw momentum signal.
⚠️ When NOT to Use
• Very low-liquidity symbols with unstable candles or unreliable volume.
• Extremely noisy micro-timeframes where impulse candles appear too frequently.
• News-driven spikes where one-bar expansion can distort the model.
• Markets with large gaps that make ATR and failure-rail references less useful.
• Situations where the user expects guaranteed continuation or automated trade signals.
🎛️ Key Inputs
• Follow-Through Side → controls Auto, Long Follow-Through, or Short Follow-Through mode.
• Minimum Impulse ATR → changes how large a candle must be before review begins.
• Minimum Body Efficiency → controls how clean the impulse body must be.
• Minimum Edge Close → controls how near the candle must close to its directional edge.
• Follow-Through Window → controls how many bars are used to judge early continuation.
• Required Progress ATR → defines preferred movement after the impulse close.
• Maximum Pullback Ratio → controls when retracement depth becomes elevated risk.
• Failure Rail Buffer ATR → adjusts the analytical failure rail behind the impulse.
• Visual settings → control the impulse highlight, follow-through box, failure rail, target guide, labels, panel visibility, panel location, theme, and font sizes.
🖥️ Interface & Visual Design
The interface is designed to stay chart-first.
The impulse highlight gives the origin. The follow-through box gives the active planning area. The failure rail and target guide define the practical review frame.
The AGPro panel provides a compact decision summary with a merged blue title row, adjustable panel location, adjustable theme, and adjustable font size.
🧪 Practical Usage Workflow
1. Read the panel Impulse Quality score and Action.
2. Check the impulse highlight and the direction of the follow-through box.
3. Review whether price is extending beyond the impulse close.
4. Compare pullback depth with the failure rail.
5. Use the target guide as a context-review reference, not as a guarantee.
6. Treat alerts as attention markers inside broader analysis.
🔍 Interpretation Guidelines
Think in terms of follow-through quality, not prediction.
A higher score means the impulse has more constructive continuation characteristics according to the script's rule set. A weaker score means the move may be aging, retracing too deeply, lacking progress, or crossing its failure reference.
VALID FT does not mean price must continue. FAILED does not mean the market cannot recover later. The states organize the review process.
🚫 What This Script Is NOT
• Not a prediction engine.
• Not financial advice.
• Not an auto-trading system.
• Not a guaranteed signal tool.
• Not a buy/sell signal service.
• Not a Volume Climax Detector.
• Not an Institutional Candle Detector.
• Not a generic momentum oscillator.
⚠️ Limitations & Transparency
The script is rule-based and depends on recent price action, ATR, candle structure, selected inputs, and volume behavior.
Different timeframes can produce different impulse and follow-through readings. Volatility spikes can temporarily distort the score. Symbols with unreliable volume may produce weaker participation readings.
Outputs should always be interpreted with broader market structure, liquidity, and trader-defined risk controls.
🧠 Market Context Notes
Impulse candles are only useful when the market confirms or rejects them through follow-through.
A clean impulse that receives controlled extension may deserve more attention than a larger candle that immediately retraces. A smaller impulse can also become meaningful when the follow-through window stays organized.
🧾 Use Case Examples
When price prints a strong bullish impulse, closes near the high, then follows through with multiple closes above the impulse close while pullback depth remains controlled, the planner may classify the move as VALID FT.
When an impulse appears but price fails to extend, retraces deeply, or crosses the failure rail, the planner may shift toward WEAK FT, PULLBACK RISK, or FAILED.
🧱 System Philosophy
AGPro planning tools are designed to help traders evaluate context before reacting.
This script follows that philosophy by turning impulse follow-through into a structured planning question: did the move receive enough confirmation, progress, and risk clarity to remain worth reviewing?
🔐 Non-Promise Statement
No indicator can guarantee continuation, reversal, breakout success, or outcome.
This tool provides structured visual context and rule-based attention markers. It does not provide certainty.
📉 Risk Disclosure
Trading involves risk.
Market conditions can change quickly, and no script can remove uncertainty.
Users are responsible for their own analysis, risk management, position sizing, and trading decisions.
This script is for educational and analytical use only and does not provide financial advice.
📚 Educational Note
Use the planner to study how strong candles behave after they appear, how follow-through quality changes across timeframes, and how pullback depth affects the readability of momentum continuation.
Indicator

Indicator

Indicator

MR DU Elliott Wave FOR IX0001Curtis, here's the English translation:
🌊 Complete Elliott Wave Structure Breakdown for Taiwan Stock Market (Figure 3-167)
Starting Point: Beginning of the 8th Major Stock Market Cycle
Key LevelDate (ROC Calendar)Description3,955.43 (Cycle Low)Nov 21, 2008 (ROC 97)Previous cycle trough; declined 5,904 points / -59.88%22,975.71 (Opening)Jan 2, 2025 (ROC 114)Observation starting point for this cycle
Wave I (Initial Advance)
Start: 17,306.97 (Apr 9, 2025 — tariff-shock low)
High: 28,594.61 (Nov 4, 2025)
Gain: +11,787.19 points (+68.16%)
Wave II (Corrective Wave)
Multiple minor pullbacks within the correction zone:
25,469.04 (Sep 26, 2025): down 924.99 pts / -3.50%
26,395.98 (Nov 21, 2025): down 2,158.63 pts / -7.56%
27,350.77 (Dec 28, 2025): down 1,217.25 pts / -4.26%
Although consolidation lasted roughly 5 months, the magnitude remained moderate.
Wave III (Main Advance) — Current Position
MilestoneDateLevelCumulative GainWave III startApr 9, 202517,306.97—Wave I highNov 4, 202528,594.61+65.22%Wave II highJan 29, 202632,090.07+85.4%Wave III peakFeb 26, 202635,579.34+105.58%Pullback lowMar 9, 202631,529.36Down 4,049.98 pts / -11.38%V-shaped new highApr 16, 202637,135.55+114.57%Closing priceApr 16, 202637,132.02YTD +28.02%
Wave III has now lasted 13 months, consistent with Teacher Du's original forecast of "April 2025 to April 2026, totaling 13 months."
📐 Fibonacci Target Price Calculations
Teacher Du provided two methods for calculating target levels:
1.618× target zone:
11,787 × 1.618 + 17,096 ≈ 36,378 points (already reached during the initial advance)
2.0× target zone:
11,787 × 2.0 + 17,306 ≈ 40,880 points (maximum extension target for the main advance)
Assessment: The main advance could end around 36,378 (already surpassed). If it extends further, the upper limit is approximately 40,880. At 37,135, the index has already exceeded the 1.618× target, meaning the main advance may conclude at any time, transitioning into the Wave IV correction.
Wave IV (Corrective Phase) — Approaching
Pattern: A 5-month sideways a-b-c-x-a-b-c-x box-range consolidation ("correction through time rather than price")
Estimated low: approximately 31,000 points (-16.5% from 37,135)
Expected bottom: before the October 2026 local elections
Strategic implication: Do not chase rallies in Q2/Q3 2026; wait patiently for the pullback.
Wave V (Final Advance) — Launching October 2026
Rally starting point: approximately 31,000 points
Price target: 43,000 points by May 2027
Volume: combined TWSE + OTC turnover expected to expand to NT$2.4 trillion
TSMC target price: NT$2,400
Indicator