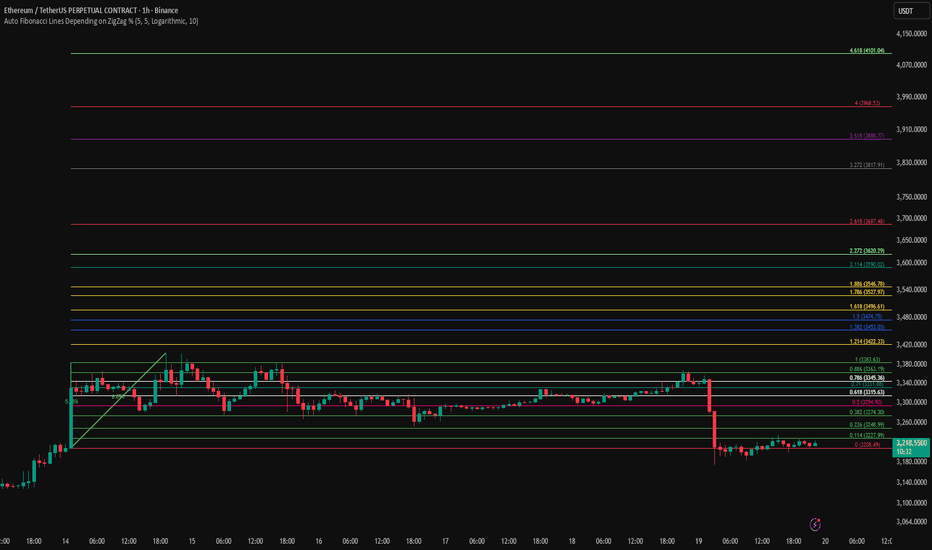
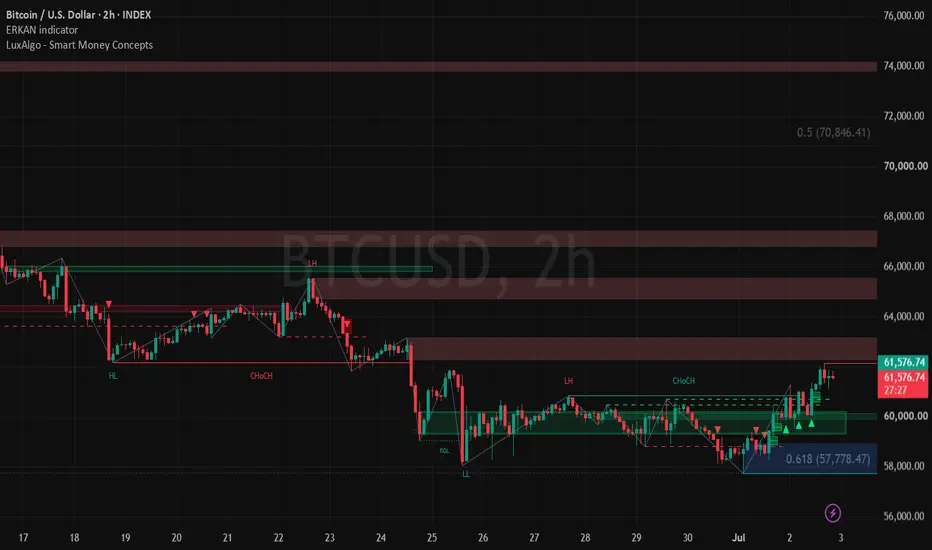
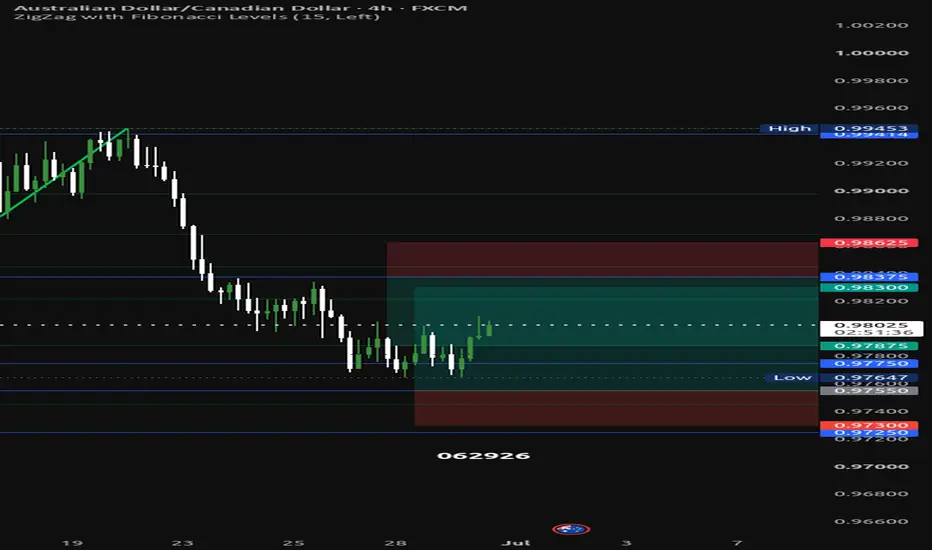
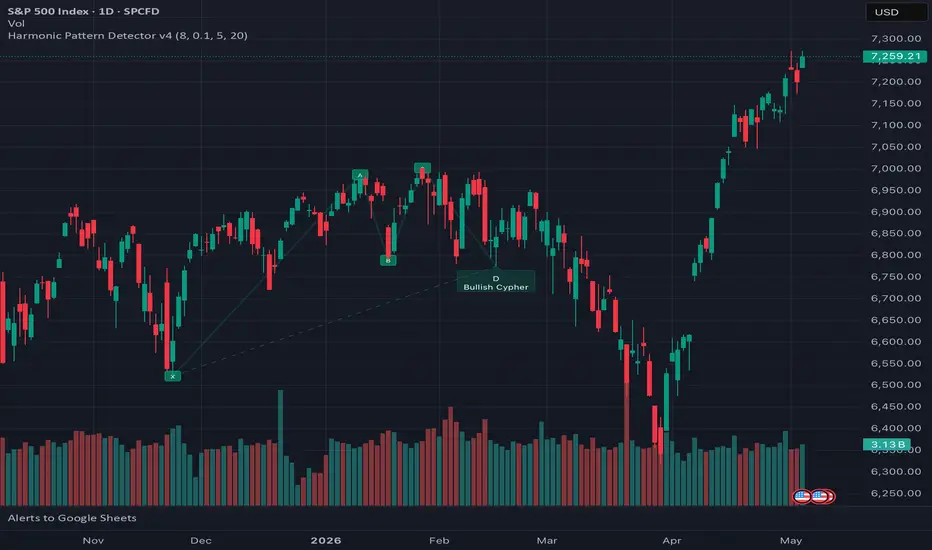
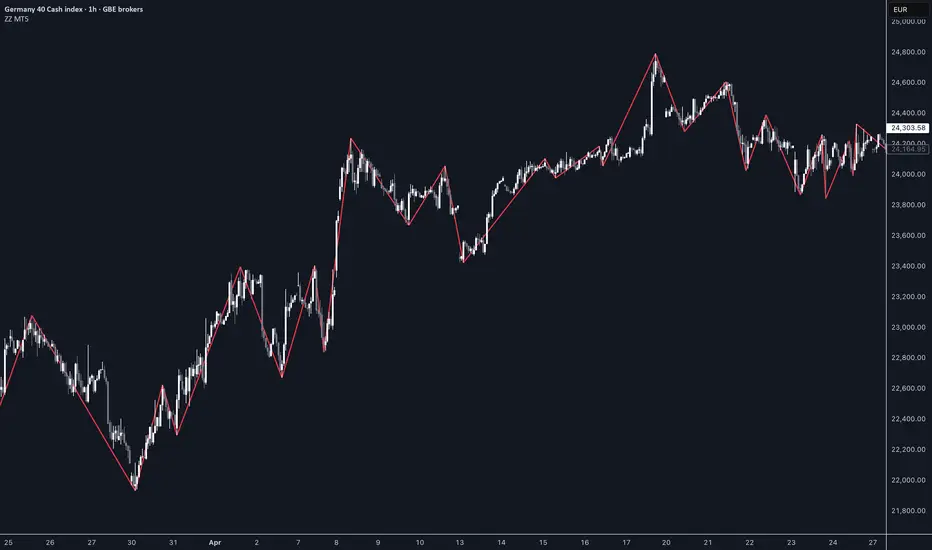
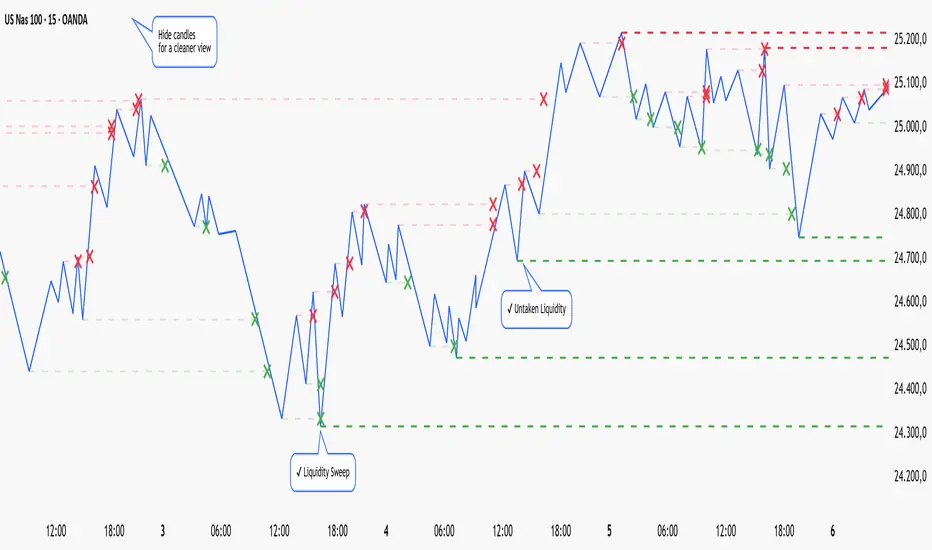
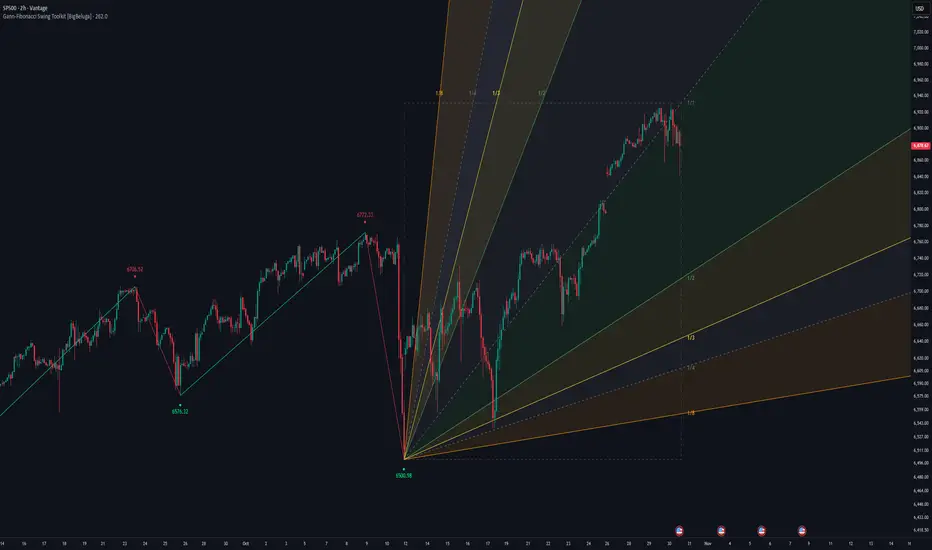
Liquidity Sweep SequenceThis indicator marks stop-hunt sweeps and, more importantly, counts how many
consecutive sweeps have occurred on the same side.
WHAT A SWEEP IS
Traders cluster their stops in predictable places: longs put theirs below the
last swing low, shorts put theirs above the last swing high. Those clusters are
resting liquidity. A sweep happens when price spikes through one of those levels,
triggers the stops, and then closes back on the original side — a wick through,
not a break.
The distinction that matters:
• Close beyond the level = a real breakout, trend continuation
• Close back inside = a sweep, failed breakout, potential reversal
WHY THE SEQUENCE COUNT
A single sweep is often just noise. What I found more useful is when they stack:
the first sweep traps, price fails to reverse, then a second sweep takes out an
even lower low. The second one is where selling pressure is actually exhausted.
The indicator labels these SWEEP, SWEEP², SWEEP³ and so on. The count resets when
an opposite-side sweep appears or when too many bars pass. By default the second
sweep must take out a deeper low (or higher high) to continue the sequence —
otherwise the count restarts at 1.
HOW IT WORKS
1. Swing highs and lows are tracked as liquidity levels using pivots.
2. A level is dropped as soon as price CLOSES through it. Once price closes above
a swing high, that liquidity has already been taken and the level can no longer
produce a sweep signal. This is the single most important filter here — without
it, stale levels from far back generate false signals during trends.
3. A sweep requires: wick through an untouched level, close back inside, a minimum
wick ratio, a minimum reclaim distance, and the bar must be a genuine local
extreme (if the wick does not exceed recent bars, no stops were actually hit).
4. Next-bar confirmation requires the following candle to close in the reversal
direction before the label is drawn.
5. Significance tiering: a sweep is marked "major" only when the wick is the
extreme of the last N bars. Minor sweeps inside ranges are hidden by default.
All labels are drawn on confirmed bars only, so nothing repaints.
HOW I USE IT
My own preference is the 1H chart, entering on SWEEP² — the second sweep in a
sequence. The first sweep tells me the level is being attacked; the second one is
where I act.
This is built for short-term perpetual futures trading and works best there. The
reason is mechanical: perps run 24/7 with no gaps, they are heavily leveraged, and
liquidation clusters are dense and public. Stop hunts on perps are a real, visible
event rather than a metaphor. On instruments with overnight gaps, daily price
limits, or low leverage, a long wick often does not represent a genuine sweep at
all, and signal quality degrades noticeably.
Suggested timeframes: 15m to 4H. Lower is noisy; the daily compresses multi-hour
hunts into a single candle and loses the event.
LIMITATIONS — please read
• This is a mean-reversion tool, not a trend tool. A sweep is by definition a
FAILED breakout, while a trend start is a SUCCESSFUL one. The two are mutually
exclusive, so this indicator will not flag the beginning of a large trend, and
it is not designed to.
• It only detects double-top and double-bottom style reversals. A V-shaped top
that simply prints a new high and falls has no prior level above it to sweep,
so no signal can appear there.
• Signals occur more frequently in ranging conditions. That is inherent to the
concept, not a defect.
• Next-bar confirmation costs one bar of delay. Turn it off for immediacy at the
cost of more failed signals.
• Pivot detection needs bars on both sides, so levels are registered with a lag
equal to the swing sensitivity setting.
• Parameters need adjusting per market and timeframe. On 15m, the major-sweep
lookback should be lowered to roughly 40–60.
SETTINGS WORTH TOUCHING FIRST
• Swing sensitivity — the main tightness control
• Major sweep lookback — how significant a sweep must be to display
• Show 2nd sweep and beyond only — reduces the chart to sequence signals alone
• Show untouched liquidity levels — draws the levels currently being tracked so
you can verify the structure logic yourself
Alerts are included for major sweeps and for the second sweep in a sequence.
This indicator is a visualization and analysis tool. It does not generate buy or
sell recommendations and nothing here is financial advice. Test any approach on
your own before risking capital.
────────────────────────────────────────────────────────────────────
【繁體中文說明】
本指標標記獵殺止損的掃蕩訊號,並且會計算同方向連續掃蕩的次數。
什麼是掃蕩
交易者的停損放在可預測的位置:做多的放在前低下方,做空的放在前高上方。這些成堆
的停損就是「流動性」。當價格刺破那個價位、觸發停損,然後收盤又收回原本那一側,
就是一次掃蕩——是影線穿過,不是真正突破。
關鍵區別:
• 收盤站在價位外側 = 真突破,趨勢延續
• 收盤收回內側 = 掃蕩,假突破,可能反轉
為什麼要算連續次數
單一次掃蕩常常只是雜訊。比較有用的是它們接連出現:第一次掃蕩是陷阱,價格沒能反
轉,接著第二次掃蕩創了更低的低點——第二次才是賣壓真正耗盡的地方。
指標會標成 SWEEP、SWEEP²、SWEEP³。出現反向掃蕩或間隔過久就歸零重算。預設要求第
二次必須創更低低點(或更高高點)才算延續,否則計數從 1 重新開始。
運作方式
1. 用 pivot 追蹤前高前低作為流動性價位。
2. 價格一旦「收盤」穿過某個價位,該價位立刻作廢。收盤站上前高,代表那裡的流動性
已經被吃掉,不再是掃蕩目標。這是本指標最重要的過濾——沒有這一層,久遠以前的
死線會在趨勢中不斷產生假訊號。
3. 掃蕩成立條件:影線穿過未被吃掉的價位、收盤收回、影線佔比達標、收回幅度達標,
且該K棒必須創局部極值(影線若沒超過近期K棒,代表根本沒有停損被觸發)。
4. 隔根確認:要求下一根收盤朝反轉方向,才畫出標籤。
5. 重要度分級:影線必須是近 N 根的極值才標為「主要」。震盪區間的次要掃蕩預設隱藏。
所有標籤都在收K後才繪製,不會重繪。
我自己怎麼用
我個人偏好 1 小時線,在 SWEEP²(連續第二次掃蕩)進場。第一次告訴我這個價位正在被
攻擊,第二次才是我動手的地方。
這支是為短線永續合約設計的,在那裡效果最好。原因是機制上的:永續 24 小時不間斷、
沒有跳空、槓桿高,清算價位密集而且公開。永續上的獵殺止損是實際發生、看得見的事件,
不是比喻。在有隔夜跳空、漲跌幅限制、或低槓桿的商品上,一根長影線常常根本不代表真
正的掃蕩,訊號品質會明顯下降。
建議時框:15 分鐘到 4 小時。更低太雜;日線把數小時的獵殺壓縮成一根K棒,事件本身就
消失了。
限制(請務必閱讀)
• 這是均值回歸工具,不是趨勢工具。掃蕩的定義就是「突破失敗」,而趨勢起點是「突破
成功」,兩者互斥。所以它不會標出大趨勢的起點,也不是為此設計的。
• 只偵測得到雙頂/雙底型的反轉。直接創新高然後下跌的 V 型頂,上方根本沒有前高可
掃,不可能出現訊號。
• 震盪盤中訊號較密集。這是概念本身的性質,不是缺陷。
• 隔根確認會延遲一根。關掉可即時,但假訊號會變多。
• Pivot 需要左右兩側的K棒,所以價位登記會延遲,延遲根數等於靈敏度設定值。
• 參數需依市場與時框調整。15 分鐘線建議把主要掃蕩回看根數降到 40–60。
本指標為視覺化與分析工具,不產生買賣建議,內容不構成投資建議。任何做法請自行驗證
後再投入資金。 Indicator

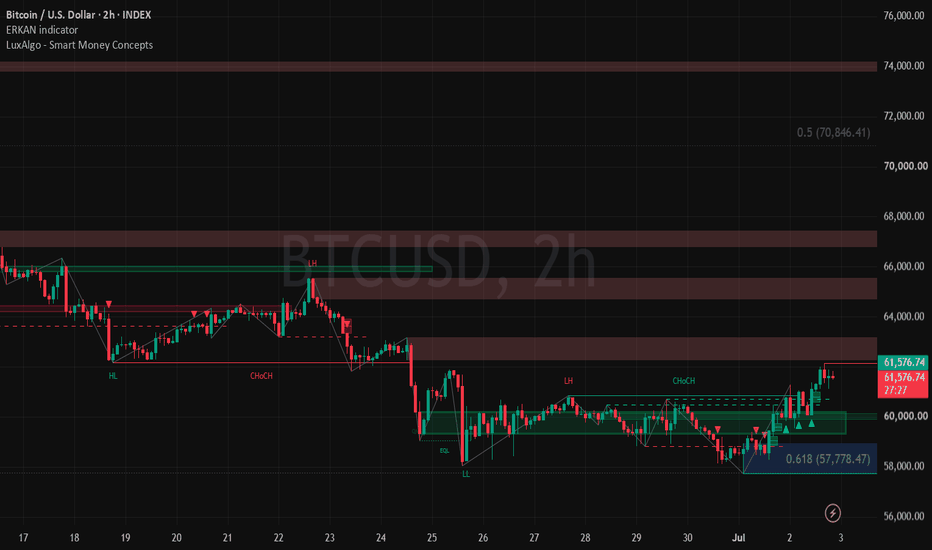
Ultimate Deep Fibonacci & Institutional Chart Matrix ProUltimate Deep Fibonacci and Institutional Chart Matrix Pro
Overview
The Ultimate Deep Fibonacci and Institutional Chart Matrix Pro is a comprehensive visual framework designed for Pine Script v6. It combines Smart Money Concepts, dynamic support and resistance zones, session liquidity levels, and structural Fibonacci pricing into a unified chart layout.
This tool maps market structure transitions, identifies key institutional high and low swing levels, tracks Asian session ranges, and visualizes overall price flow through a custom smooth wave with integrated volume price background fill.
Core Features
Natural Price Wave and Shadow Fill
Maps underlying market momentum using a smoothed wave calculation.
Dynamically fills the space between the current close price and the wave line to visualize expanding or contracting momentum.
Color coded green for bullish conditions and red for bearish conditions.
Deep Institutional Fibonacci Matrix
Plots critical institutional Fibonacci levels based on recent market swings:
0.50 Equilibrium (EQ): The midpoint balance level.
0.618 Golden Zone: A primary level for premium or discount interest.
0.786 Deep Discount: A deep structural reversal or continuation level.
Dynamic Support and Resistance Zones
Automatically draws extended resistance and support boxes using dynamic pivot points and Average True Range buffering.
Labels automatically project forward on the chart without obscuring live price action.
Major ITH and ITL Badges
Identifies significant Intermediate Term Highs (ITH, colored Red) and Intermediate Term Lows (ITL, colored Green).
Configurable lookback parameters filter out minor noise, focusing solely on major swing structural points.
Smart Money Concepts Structure
Detects and plots structural breaks:
BOS (Break of Structure): Signals trend continuation.
CHoCH (Change of Character): Signals potential market trend shifts.
Asian Session Liquidity Tracking
Tracks the high and low levels established during the Asian trading session.
Plots dotted projection lines until price breaks or sweeps these liquidity levels.
Dynamic Projection Arrow and Low Resistance Liquidity
Projects short term expected direction using Average True Range volatility metrics.
Highlights major liquidity pools based on key high and low boundaries.
On Screen Live Dashboard
Displays real time market stats in the top right corner, including Market Flow, Golden Zone values, Asian Session status, Volatility, and Market Structure Alignment.
Settings Breakdown
Price Wave and Shadow Settings
Show Natural Price Wave and Fill Shadow: Enables or disables the wave line and its background fill.
Wave Sensitivity: Adjusts the lookback period for the wave calculation (Default: 20).
Shadow Transparency (0-100): Controls the background fill opacity.
Deep Fibonacci Matrix
Show Deep Institutional Fib: Enables or disables structural Fibonacci lines.
Fib Swing Lookback: Determines the number of bars evaluated for top and bottom Fibonacci anchors (Default: 40).
Dynamic Support and Resistance Box Zones
Show Dynamic Box S/R Zones: Toggles support and resistance box zones.
S/R Sensitivity: Controls the pivot detection length for drawing zones (Default: 20).
Major ITH and ITL Settings
Show Major ITH and ITL Badges: Toggles ITH and ITL visual markers.
Major ITH and ITL Lookback: Controls swing sensitivity to filter minor noise (Default: 20).
Projection and Liquidity Settings
Show Direction Projection Arrow: Toggles the forward projection arrow.
Arrow Forward Bars: Controls how far ahead the arrow projects (Default: 12).
Show Low Resistance Liquidity: Toggles liquidity baseline highlights.
Asian Liquidity and SMC Settings
Show Active Asian High / Low: Toggles Asian range tracking lines.
Show BOS and CHoCH Structure: Enables market structure labels.
Structure Sensitivity: Controls pivot lookback for structural breaks.
How to Use
Context Identification: Look at the Market Flow and Price Wave Fill Shadow to determine the directional bias (Bullish = Green, Bearish = Red).
Key Zone Mapping: Identify price interaction with the Support Zone or Resistance Zone. Monitor how price behaves near the 0.618 Golden Zone or 0.786 Deep Discount lines.
Structure Confirmation: Confirm structural updates via BOS or CHoCH markers. Look for ITH (Red) or ITL (Green) labels to mark key swing pivots.
Session Liquidity: Monitor the ASIA H and ASIA L dotted lines for potential liquidity sweeps during peak trading hours.
Things to Avoid
Avoid Over-Leveraging at Single Levels: Never rely on a single line or zone in isolation; always seek confluence across structural breaks and dynamic zones.
Avoid High Sensitivity on Low Timeframes: Setting swing sensitivities too low on lower timeframes can lead to excessive noise. Adjust lookback values according to your target timeframe.
Avoid Trading directly into major Resistance or Support: Exercise caution when opening new directional positions directly inside established Resistance or Support boxes.
Disclaimer
Trading financial markets involves significant risk and can result in the loss of your capital. This indicator is designed strictly for educational and analytical purposes to assist with visual market structure identification. It is not financial advice, investment recommendation, or a signal service. Always manage your risk responsibly, conduct your own independent research, and follow your own personalized trading plan. Indicator

S&R + Trends | Polytrends Method (gracefultrading)SUPPORT & RESISTANCE + TRENDS | POLYTRENDS METHOD
Maps market structure automatically: every trend is detected, classified, and turned into support/resistance levels that know their own state. Built around the polytrends method of reading structure through trends and progression. This is my own independent, open-source interpretation of the framework, coded from scratch based on publicly available material. For educational purposes only — not financial advice.
TRENDS AND CONTAINMENT
Every pivot is compared against the previous pivot in the same direction. A swing that pushes past the prior trend is a valid continuation and draws in the trend colour. A swing that fails to exceed it — a lower high on the way up and or a lower low on the way down — is a containment trend, drawn in its own colour and style.
The current in-progress leg draws dashed, so you always see the swing being built. Pivot detection reacts to wick pullbacks, close-breaks of the prior candle, structural breaks, and same-bar reversals — not fixed-length lookbacks.
LEVELS WITH STATE
Each trend leaves a level at the candle body, committed only after the next opposite pivot confirms it. Every label shows the level's current state at a glance:
G — gained
SG — support gained
L — lost
RL — resistance lost
State updates bar by bar as price closes through or reclaims a level. An optional break/test offset (in ticks or percent) means a level only counts as gained, lost, or tested once price clears it by your buffer.
PAIRED STRUCTURE
Levels come from trends and draws in colour-matched pairs from a 12-colour set, each pair originating from the same piece of structure.
Tested levels draw in a different line style from untested ones and can be hidden entirely; when hidden, you choose whether each pair still shows its tested partner so pairs stay intact. At high relevance settings, clustered tested levels within a tick distance thin down to the strongest one.
POLYBOUNDS
Experimental.
A corner readout that reduces the chart to the two prices that matter:
▲ hold above — the key gained level below price. Bulls are in control while price holds above it.
▼ hold below — the key lost level above price. Bears are in control while price holds below it.
Each line is coloured to match its pair on the chart, and the box only quotes levels that are actually drawn. A Trend Day row (1H and below) reads whether the session is shaping up bullish, bearish, or rangebound based on where price sits against the bounds.
SETTINGS
Levels above/below counts. A relevance dial controlling how deep into history levels are pulled from (50 bars to full history). Independent colours, styles, and widths for trends, containment trends, and levels. Configurable label background and twelve pair colours. A right-offset so all level rays align cleanly ahead of price.
HOW TO READ IT
The market is always in progression — always attempting either a new high or a new low. Every swing this indicator draws is one attempt in that sequence, and every level is the footprint it leaves behind.
Progression rule: in an uptrend, price should not lose the previous swing low if it intends to go higher — losing it shifts probability toward the opposite objective. Mirror logic in a downtrend. Watch the level states: a support flipping from SG to L is that shift happening in real time.
Containment is the early warning. A containment trend (lower high in an uptrend, higher low in a downtrend) means the progression is failing before any level has broken. Trend weakness is the warning; level failure is the confirmation.
Levels mark accepted value. They're built from candle bodies, not wicks — the goal is to see where the market accepted or rejected value, which is why the break/test offset exists to filter wick noise.
Untested levels react first. Fresh levels are the highest-priority reaction zones; tested levels remain valid structure and become targets when price is nearer to them. The pair colours show you which structure each level came from.
Timeframes nest. Higher-timeframe levels are destinations; lower-timeframe levels are the navigation between them. Significant trends typically start from higher-timeframe pivots — the biggest swings on your chart usually trace back to them. RTH-formed levels tend to carry the most weight.
Works on any symbol and timeframe; the Trend Day readout is built for intraday. This is a tool for reading structure, not a signal service — nothing replaces risk management. Indicator

Indicator

Indicator
Indicator

ZigZag Confluence [Probalist Essentials]ZigZag Confluence draws swing structure with a clear line between what is settled and what is still moving. A confirmed leg is solid and does not redraw once it forms; the developing leg is dashed and labelled, so you can tell the fixed structure from the live edge at a glance. It is non-repainting where it counts: the part that genuinely cannot be final yet is shown as provisional, not dressed up as done. Every confirmed pivot carries a two-line balloon (the signed %-change of the leg and the pivot price) plus a weighted dot sized by how big the completing leg was relative to history. An optional marker shows the bar each pivot actually confirmed, so the confirmation lag — the cost of not repainting — is there to see rather than hidden.
And it keeps score. Over a fixed window after each confirmed pivot it records three things per direction: the favorable run (MFE — how far the move travelled your way), the adverse heat (MAE — how far it went against you first), and the net return at the end of the window. The run and heat percentiles project forward from the live pivot as stop/target rails — the favorable target in the leg's colour, the stop in the opposite — and the favorable-run distribution is drawn as a bell to the right of the chart. The edge verdict is judged separately, on the net follow-through: was it reliably positive on this chart's own history, with a Wilson-bounded win rate? Description, not prediction — and the code is open, so you can count it yourself.
🟡 WHY THIS VERSION
Most ZigZag indicators redraw their last leg silently — they look perfectly timed in hindsight because they were. This one doesn't: confirmed pivots are frozen the moment they form and never move, the developing leg is dashed with the lag spelled out, and an optional ✓ marker shows the exact bar each pivot became actionable. The other thing worth having is that it keeps score where it matters for a swing tool. Instead of a static pivot count, it measures — over a real holding window — how far past legs ran in your favour, how much heat they took first, and whether the net follow-through actually held. You get stop/target rails sized from that history and an honest edge read: a range and a verdict, not a guarantee. And the confirmation timeframes and the HTF overlay derive from your chart, so the multi-timeframe confluence means something on a 5-minute chart as much as on a daily.
🟡 HOW IT WORKS
The pivot detection uses a scale-free ATR threshold: price must reverse from a running extreme by at least k × ATR(14) before the extreme is frozen as a confirmed pivot. A fixed-percentage threshold breaks on low-priced assets and behaves differently in high-volatility regimes; the ATR multiple adjusts naturally. A minimum 'depth' in bars adds a secondary filter so very brief wicks don't confirm pivots on noisy markets.
Once a pivot is confirmed, a solid coloured leg is drawn from the previous pivot (gold for up-legs, blue for down-legs), a two-line balloon labels it, and a weighted dot marks the confirmation bar. The developing leg — from the most recent confirmed pivot to the current running extreme — is drawn dashed and updated every bar. It may extend or be replaced; this is explicitly the confirmation trade-off made visible, not a repaint. The classic ZigZag's flaw is that it draws this same provisional leg as if it were final and then silently redraws it — which is exactly why it looks flawless on historical bars; separating confirmed (solid, frozen) from developing (dashed, labelled) is the honest fix.
It then keeps score over a fixed horizon after each confirmed pivot. For every signal it tracks the running favorable excursion (MFE) and adverse excursion (MAE) from the entry anchor, and the net return once the horizon completes — recorded only on closed bars, non-repainting by construction. A single ZigZag leg is monotonic, so the heat within one leg is near zero; the fixed window is what captures real adverse movement, including pivots that fail and reverse. The run and heat percentiles size the projected stop/target rails — the stop sits at the 90th-percentile heat, because the median heat is ~0 (most entries take no drawdown below them) and the real risk lives in the tail. The edge verdict is judged on the net return: the Wilson-score lower bound of the share of positive-net pivots, with the recent window catching regime shifts faster than the full history. The favorable-run distribution is drawn as a kernel-smoothed bell to the right of the chart. Two anchor modes: Confirmation (the realistic entry, with real heat) and Pivot extreme (the idealized ceiling — anchored at the exact swing, so net is positive by construction and the edge read is suppressed as not meaningful there).
🟡 KEY FEATURES
Honest two-tone rendering: confirmed legs solid and permanent, the developing leg dashed and labelled — the distinction is explicit, not hidden. An optional marker shows the exact bar each pivot confirmed (the lag = the price of not repainting).
ATR-scaled reversal threshold: scale-free across assets, adjusts to volatility regimes automatically. A depth-in-bars filter rejects brief wicks.
Per-pivot two-line balloon labels: signed %-change on top, pivot price below, leg duration in the hover tooltip.
Weighted signal dots sized by leg-size percentile (self-calibrating 60th/90th tiers), carrying an evidence glyph: ● recent net-backed · ◐ has stats but not backed · ○ gathering. A ◈ prefix marks pivots that land at a prior confirmed pivot level — a fixed, tight invalidation (geometry, not extra probability).
Excursion read per direction: over a fixed horizon after each pivot it measures the favorable run (MFE) and the adverse heat (MAE), projected forward from the live pivot as stop/target rails — favorable target in the leg's colour, the stop (90th-percentile heat) in the opposite. The favorable-run distribution is drawn as a kernel-smoothed bell with the live leg's percentile marked.
Honest net-edge verdict: judged on the net return at the horizon (not the trivially-positive run), with a Wilson-score lower bound, a recent-vs-long-run read and a dual edge-clock. Suppressed under the pivot-extreme anchor, where net is positive by construction and labelled the idealized ceiling, not an edge.
Evidence-gated alerts: standard and net-history-backed variants of bull/bear pivot confirmations, plus BOS/CHoCH and pivot-at-prior-level — all non-repainting (bar-close vs pre-fixed levels).
MTF ✓-badges with auto-derived rungs: the confirmation timeframes come from your chart (the next steps up the ladder 1·5·15·60·240·D·W·M, so a 5m chart checks 15m/1h/4h, not D/W; change the chart TF and the rungs follow). When a higher TF later confirms the same swing, the balloon is stamped (e.g. ✓4h) — confluence shown when it actually exists, never before, since a higher timeframe confirms later by construction.
Ghost pivots: faint ● dots in the accent colours (gold = a would-be swing high, blue = a would-be swing low) at superseded extremes that stood at least the confirmation depth before price pushed through — every spot where a repainting ZigZag would have printed a pivot and silently erased it. The honest counterpart of never repainting.
Market structure layer: every balloon tagged HH/HL/LH/LL, with BOS and CHoCH flagged when a bar closes beyond the last confirmed swing level — the level is fixed before the break, so the call is non-repainting by construction.
Optional HTF ZigZag overlay with the same auto-derived ladder (two rungs up the chart): a thin dotted higher-timeframe structure for context. Display only — it never filters or alters signals.
🟡 HOW TO USE
Use confirmed (solid) legs as your structure reference: they define swing highs and lows that won't move. A sequence of higher lows on solid lines is an uptrend; lower highs is a downtrend.
Treat the dashed developing leg as provisional — its endpoint updates every bar. The 'confirms X' trigger level shows the close that would confirm it; the optional confirmation-bar marker shows, after the fact, how many bars the confirmation lagged the extreme. That lag is the honest cost of non-repainting structure.
Read the stop/target rails on the active developing leg: the favorable target is the median (and 75th-percentile) run past legs made in this direction; the stop rail sits at the 90th-percentile heat — beyond where the normal adverse move stayed on ~90% of past legs. The reward:risk on the label is descriptive of this chart, not a promise.
Use the net-edge read as context, not an entry trigger. A 'net follow-through reliably positive' verdict means past pivots here held up on a Wilson-bounded majority — weigh it against fees, spread and your holding period before acting.
Check the developing leg's percentile in the favorable-run distribution: a leg already at the 85th percentile is well-extended by historical standards and may be closer to a pivot than a fresh one at the 20th.
Costs honesty: pivot signals on low timeframes can show a tiny median net (e.g. +0.10–0.30% over the horizon). On most venues that does not survive round-trip costs — use the read for directional bias and higher-timeframe confluence, not as a standalone scalp entry.
Size alerts around the evidence tier: the 'history-backed' alert variants fire only when the recent net clears the Wilson threshold; standard alerts fire on every confirmation. Use the backed variant for stronger-filter setups.
Anchor choice: keep Confirmation (default) for the tradeable read — the entry you could actually take, with its real heat. Switch to Pivot extreme only to see the idealized ceiling (full run, ~zero heat); the edge verdict is intentionally suppressed there because net is positive by construction.
Enable Show HTF ZigZag for the higher-timeframe structure as a thin dotted overlay (the timeframe auto-derives from your chart). Chart-timeframe pivots that align with an HTF leg in the same direction carry more structural weight — and the MTF ✓-badges quantify exactly that. Display only; it never filters or alters signals.
🟡 PAIRS WELL WITH
ZigZag structure tells you where the swings are but not what drives them. A momentum oscillator like RSI or MACD adds a read on whether momentum is confirming the swing — a swing low into an OS zone with divergence is a more complete setup than a pivot alone. A volume indicator helps distinguish pivots that occurred on meaningful participation from low-volume reversals. For trend bias, a moving average or Supertrend on a higher timeframe filters which pivot direction to trade with versus against. Key S/R levels (daily highs/lows, prior swing clusters) give the structural context this tool measures but doesn't assess quality-wise — a confirmed pivot at a prior level is a different read than one in open air.
ZigZag Confluence gives you swing structure you can trust: pivots that don't move after the fact, a developing leg that tells you honestly it's still forming, and an excursion read that shows what this chart has actually done after past pivots — how far they ran, how much heat they took, and whether the net follow-through held — not what a backtest on a different instrument claims. The rails and the distribution are displays, not filters; the trader reads the evidence and decides.
Open source under MPL-2.0. The probability layer describes past signals on your chart — it is a measurement, not a prediction, and nothing here is financial advice.
Indicator

Smart ZigZagIts "Smart ZigZag" indicator for TradingView.
It connects significant price highs and lows to filter out market noise, but unlike a standard ZigZag, it uses a statistical, volume-weighted approach to dynamically identify trend reversals.
Here is a detailed breakdown of what this script does:
1. Main Functions & Statistical Engine
Instead of using fixed percentages or points to find pivot points, this script uses Z-Score and Standard Deviation:
- Baseline Calculation: If the asset has trading volume, it calculates a Volume Weighted Average Price (VWAP) as a baseline. If there is no volume (like on some forex or crypto pairs), it automatically falls back to an ALMA (Arnaud Legoux Moving Average).
- Dynamic Volatility Threshold: It calculates the Standard Deviation of the price relative to that baseline. It multiplies this value by your Z-Score Threshold.
- Trend Filtering: A reversal (new ZigZag leg) is only triggered if the price deviates from the previous peak/trough by more than this dynamic statistical threshold.
2. Core Operational Logic
- Minimum Bar Count (Backstep): To prevent frequent, erratic trend shifts, the script enforces a rule that a specific number of candles (default: 14) must pass before a new trend direction can be confirmed.
- Peak and Trough Updating: While a trend continues in one direction (e.g., an uptrend), the indicator will continuously update and stretch the current line to the newest, highest high. It only locks in a permanent pivot point when a valid reversal occurs in the opposite direction.
- Array Management: It uses internal arrays (zz_values and zz_bars) to efficiently keep track of historical pivot prices and time coordinates.
3. Visuals and Customization
- Real-time Drawing: The script draws dynamic trend lines directly on the chart, using green for uptrends and red for downtrends by default.
- Informative Labels: At every major peak and trough, it places a text box. Depending on user settings, these labels display the exact price level, the percentage change from the previous pivot, or both.
Summary for Traders
This tool helps you see the underlying structure of market trends. Because it utilizes Standard Deviation, the indicator automatically widens its criteria during highly volatile periods (preventing false signals) and tightens them during quiet, consolidating markets. Indicator

Indicator

Indicator

Indicator

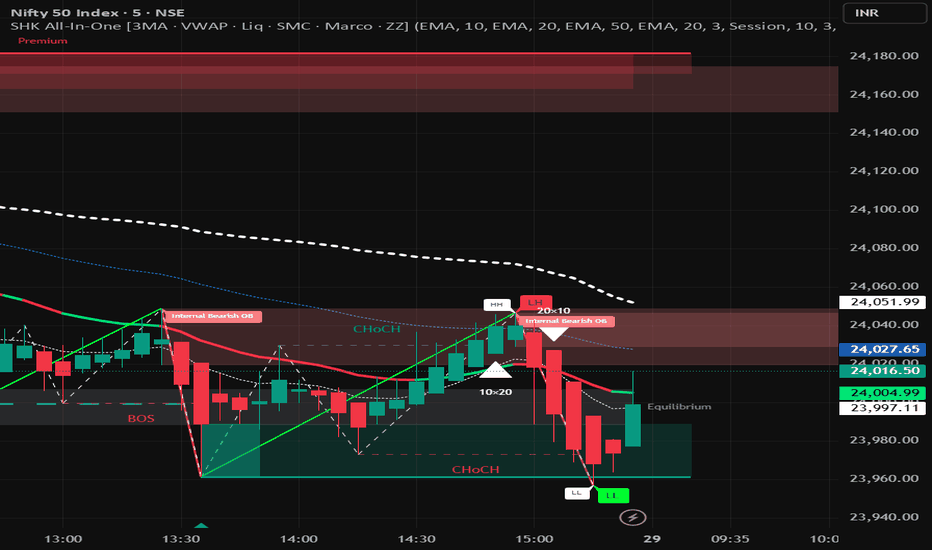
SHK All-In-One | 3MA - VWAP - Liq - SMC - Marco - ZZ╔══════════════════════════════════════════════════════════════════╗
║ SHK All-In-One ║
║ by SHK · Pine Script v6 ║
╚══════════════════════════════════════════════════════════════════╝
━━━━━━━━━━━━━━━━━━━━━━━━━━━━━━━━━━━━━━━━━━━━━━━━━━━━━━━━━━━━━━━━
🏅 CREDITS & ORIGINAL AUTHORS
━━━━━━━━━━━━━━━━━━━━━━━━━━━━━━━━━━━━━━━━━━━━━━━━━━━━━━━━━━━━━━━━
This script is a combined, extended and restructured version of
several outstanding open-source indicators. Full credit belongs
to the original authors listed below. I have only merged,
organised and added connecting logic.
① Smart Money Concepts (SMC)
→ Original: LuxAlgo — "SMC Lite" (open-source, TradingView)
→ Includes: BOS, CHoCH, Order Blocks, FVG, EQH/EQL,
MTF Levels, Premium/Discount Zones, STH/STL
② Liquidity Swings (BSL / SSL)
→ Original: LuxAlgo — "Liquidity Levels" (open-source)
→ Includes: Buy-Side & Sell-Side Liquidity zones,
sweep detection, volume/count filtering
③ Marco Polo Top Detective
→ Original: Marco Polo — community TradingView adaptation
→ Includes: Custom pivot top/bottom detection,
BBands 3-bar reversal confirmation
④ ZigZag Engine (Swing + Internal)
→ Original: Classic TradingView community ZigZag
(multiple open-source contributors)
→ Includes: Swing ZigZag with HH/HL/LH/LL labels,
Internal ZigZag with separate settings
⑤ UT Bot Filter (inside Signal MA)
→ Original: QuantNomad — "UT Bot Alert" (open-source)
→ Used as one of three Signal MA colour filters
⑥ Supertrend Filter (inside Signal MA)
→ Built-in ta.supertrend() — Pine Script standard library
→ Used as one of three Signal MA colour filters
⑦ 3 MA + Signal MA System + VWAP
→ Original work by SHK
→ Includes: 3 independent MAs, a colour-coded Signal MA
combining HA + Supertrend + UT Bot filters,
and an anchored VWAP
Combined, unified and extended by SHK.
━━━━━━━━━━━━━━━━━━━━━━━━━━━━━━━━━━━━━━━━━━━━━━━━━━━━━━━━━━━━━━━━
📌 WHAT IS THIS INDICATOR?
━━━━━━━━━━━━━━━━━━━━━━━━━━━━━━━━━━━━━━━━━━━━━━━━━━━━━━━━━━━━━━━━
SHK All-In-One brings together five of the most powerful
open-source market analysis tools into a single, clean,
modular indicator. Instead of adding 5 separate scripts to
your chart and dealing with clutter and conflicts, everything
lives in one place.
Each of the five modules can be INDEPENDENTLY TURNED ON OR OFF
using the Master Toggles at the top of the settings. Use only
what you need — run all five at once or pick just one.
Designed primarily for Indian markets (Nifty, BankNifty,
Sensex, MCX commodities) but works on any symbol and timeframe.
━━━━━━━━━━━━━━━━━━━━━━━━━━━━━━━━━━━━━━━━━━━━━━━━━━━━━━━━━━━━━━━━
① 3 MA + VWAP MODULE
━━━━━━━━━━━━━━━━━━━━━━━━━━━━━━━━━━━━━━━━━━━━━━━━━━━━━━━━━━━━━━━━
Three fully independent Moving Averages, each with its own
type, length and colour setting.
SUPPORTED MA TYPES:
• EMA — Exponential Moving Average
• SMA — Simple Moving Average
• WMA — Weighted Moving Average
• HMA — Hull Moving Average (smooth, low lag)
• TEMA — Triple EMA (very low lag)
• DEMA — Double EMA (reduced lag)
• ZLEMA — Zero-Lag EMA (lag corrected using looback)
All three MAs default to EMA 9 / 21 / 50 — the classic
short, medium and long-term trend framework.
SIGNAL MA:
A fourth moving average acts as a dynamic trend signal line.
It changes colour based on THREE combined market filters:
Filter 1 — Heiken Ashi:
Reads the Heiken Ashi close vs open to determine if price
action is in a bullish or bearish HA candle. Smooths out
noise from regular candles.
Filter 2 — Supertrend:
Uses ta.supertrend() with configurable ATR length and
factor. Adds a trend-following layer to the signal.
Filter 3 — UT Bot:
QuantNomad's UT Bot trailing stop logic using ATR.
Identifies momentum direction based on a key value
multiplier and ATR period.
Scoring system:
Each filter votes +1 (bullish) or -1 (bearish).
Total score > 0 → Signal MA turns GREEN (bullish)
Total score < 0 → Signal MA turns RED (bearish)
Total score = 0 → Signal MA turns GREY (neutral)
You can enable or disable any of the three filters
individually. Running all three gives the most robust signal.
MA CROSSOVER LABELS:
Whenever MA1 crosses MA2, or MA2 crosses MA3, a small
triangle label appears on the chart automatically.
Upward triangle = bullish cross (below bar)
Downward triangle = bearish cross (above bar)
The label shows the two MA lengths that crossed.
VWAP (Volume Weighted Average Price):
A fully anchored VWAP is included with anchor options:
Session / Week / Month / Quarter / Year
VWAP is calculated from scratch using cumulative
TPV (typical price × volume) for accuracy.
Displayed as a bold coloured line (default yellow).
━━━━━━━━━━━━━━━━━━━━━━━━━━━━━━━━━━━━━━━━━━━━━━━━━━━━━━━━━━━━━━━━
② LIQUIDITY SWINGS MODULE
━━━━━━━━━━━━━━━━━━━━━━━━━━━━━━━━━━━━━━━━━━━━━━━━━━━━━━━━━━━━━━━━
Identifies areas where resting liquidity (stop losses and
pending orders) is likely clustered above swing highs and
below swing lows. Based on LuxAlgo's Liquidity Levels logic.
HOW IT WORKS:
Uses ta.pivothigh() and ta.pivotlow() with a configurable
lookback length to detect swing pivot points.
For each detected swing high → marks a BSL zone
(Buy-Side Liquidity — stop losses of shorts clustered above)
For each detected swing low → marks a SSL zone
(Sell-Side Liquidity — stop losses of longs clustered below)
A horizontal line is drawn at the pivot level and extends
to the right until price sweeps through it.
When price closes beyond the level:
• Line turns DASHED
• Label updates to "✓ BSL Swept" or "✓ SSL Swept"
• Zone box fades
SWING AREA MODES:
Wick Extremity — Zone top/bottom uses the wick extreme
vs the candle body edge (tighter zone)
Full Range — Zone spans full candle high to low
FILTERING:
Filter by Count — minimum number of bars that touched
the zone (liquidity density)
Filter by Volume — minimum cumulative volume inside
the zone (institutional interest)
LABELS:
Each level shows "▲ Buy Side Liquidity" or
"▼ Sell Side Liquidity" with the cumulative volume.
Label size and BSL/SSL label size are configurable.
━━━━━━━━━━━━━━━━━━━━━━━━━━━━━━━━━━━━━━━━━━━━━━━━━━━━━━━━━━━━━━━━
③ SMART MONEY CONCEPTS (SMC) MODULE
━━━━━━━━━━━━━━━━━━━━━━━━━━━━━━━━━━━━━━━━━━━━━━━━━━━━━━━━━━━━━━━━
The most comprehensive module. Based on LuxAlgo's SMC Lite
open-source indicator, adapted and integrated for this script.
─── STRUCTURE ───────────────────────────────────────────────
SWING STRUCTURE:
Identifies the major market structure by tracking swing
highs and swing lows over a configurable lookback length.
BOS (Break of Structure):
Price closes beyond the last swing high/low in the
SAME direction as the current trend. Confirms trend
continuation.
CHoCH (Change of Character):
Price closes beyond the last swing high/low in the
OPPOSITE direction of the current trend. First signal
of a potential trend reversal.
A line is drawn from the broken level to the current bar,
labelled BOS or CHoCH. Bullish = green, Bearish = red.
INTERNAL STRUCTURE:
Same BOS/CHoCH logic applied to a shorter lookback (5 bars)
to catch intrabar / internal structure shifts.
Internal structure lines are dashed to distinguish from
swing structure.
Confluence Filter option: when enabled, only shows
internal structure that aligns with candle body direction
(filters out weak signals).
SWING POINTS:
Optional labels showing HH (Higher High), HL (Higher Low),
LH (Lower High), LL (Lower Low) at each pivot.
STRONG / WEAK HIGH-LOW LABELS:
STH (Short-Term High) and STL (Short-Term Low) mark the
most recent swing extreme. When both occur at the same
bar, shows a combined STH/STL label.
─── ORDER BLOCKS ────────────────────────────────────────────
Order Blocks are the last up/down candle before a BOS or
CHoCH. They represent areas where institutional orders
were placed and price is likely to react on a return visit.
INTERNAL ORDER BLOCKS:
Derived from internal structure BOS/CHoCH events.
Show the 5 most recent (configurable up to 20).
SWING ORDER BLOCKS:
Derived from swing structure BOS/CHoCH events.
Disabled by default (toggle on if needed).
OB FILTER:
ATR Filter — removes OBs from high-volatility candles
(candle range ≥ 2× ATR is excluded as noise)
Cumulative Mean Range Filter — uses average range
instead of ATR as the volatility measure
OB MITIGATION:
Close — OB is mitigated when price CLOSES inside it
High/Low — OB is mitigated when price WICKS into it
Each OB is drawn as a coloured box that extends to the
right until price mitigates it.
─── FAIR VALUE GAPS (FVG) ───────────────────────────────────
A Fair Value Gap is a 3-candle imbalance where:
Bullish FVG: candle 3 low > candle 1 high (gap up)
Bearish FVG: candle 3 high < candle 1 low (gap down)
FVGs are drawn as semi-transparent boxes.
Auto Threshold option filters out micro-gaps below
0.5× ATR (reduces noise).
Optional multi-timeframe FVG via timeframe input —
you can display FVGs from a higher timeframe on your
current chart.
─── EQUAL HIGHS / EQUAL LOWS (EQH/EQL) ─────────────────────
Detects when two consecutive swing highs or lows are within
a configurable ATR threshold of each other, indicating
clustered liquidity at that level.
Drawn as a dotted line between the two equal levels,
labelled EQH or EQL.
─── MULTI-TIMEFRAME HIGHS & LOWS ────────────────────────────
Draws the previous period's High and Low for:
• Daily (previous day high/low)
• Weekly (previous week high/low)
• Monthly (previous month high/low)
Each level has its own style (solid/dashed/dotted) and
colour. Useful as key support/resistance reference levels.
─── PREMIUM / DISCOUNT / EQUILIBRIUM ZONES ──────────────────
Based on the current swing high and swing low (trailing
extremes), the visible range is divided into three zones:
Premium Zone (top 5%):
Price is trading at a premium. Bearish bias —
institutions tend to SELL in premium.
Equilibrium Zone (middle 5% around 50%):
Price is at fair value. Neutral zone.
Discount Zone (bottom 5%):
Price is at a discount. Bullish bias —
institutions tend to BUY in discount.
Display modes:
Historical — draws ALL historical structure and OBs
Present — draws only the MOST RECENT instance
(cleaner chart for live trading)
Style modes:
Colored — standard green/red/blue colours
Monochrome — single grey tone (for minimal charts)
─── SMC ALERTS ──────────────────────────────────────────────
Full alert conditions available for:
Internal Bullish / Bearish BOS
Internal Bullish / Bearish CHoCH
Swing Bullish / Bearish BOS
Swing Bullish / Bearish CHoCH
Equal Highs / Equal Lows
Bullish / Bearish Fair Value Gap
Internal Bullish / Bearish Order Block (mitigated)
Swing Bullish / Bearish Order Block (mitigated)
━━━━━━━━━━━━━━━━━━━━━━━━━━━━━━━━━━━━━━━━━━━━━━━━━━━━━━━━━━━━━━━━
④ MARCO POLO TOP DETECTIVE MODULE
━━━━━━━━━━━━━━━━━━━━━━━━━━━━━━━━━━━━━━━━━━━━━━━━━━━━━━━━━━━━━━━━
A pivot detection tool that identifies significant swing
tops and bottoms using a custom algorithm — different from
the standard ta.pivothigh() approach.
PIVOT DETECTION:
Uses a rolling highest/lowest scan over a configurable
Depth. A pivot is confirmed only when the price found
deviates from the previous pivot by more than a threshold:
Threshold = ATR(10) / close × 100 × Deviation input
This prevents trivial micro-swings from being plotted and
focuses only on significant structural pivots.
Labels appear DEPTH bars back (offset) so they appear
at the actual pivot bar, not the confirmation bar.
→ "Top Pivot" label (red, above bar)
→ "Bot Pivot" label (blue, below bar)
BOLLINGER BANDS REVERSAL CONFIRMATION:
A second layer — the 3-bar BBands pattern — identifies
short-term exhaustion reversals:
Bear Reversal (bearish):
• 2 bars ago: close > BBands upper AND green candle
• 1 bar ago: close > BBands upper AND red candle
• Current bar: close < 1-bar-ago high
→ "Bear Rev" label (orange, above bar)
Bull Reversal (bullish):
• 2 bars ago: close < BBands lower AND red candle
• 1 bar ago: close < BBands lower AND green candle
• Current bar: close > 1-bar-ago low
→ "Bull Rev" label (lime green, below bar)
This pattern catches short-term mean-reversion setups
at Bollinger Band extremes with candle confirmation.
ALERTS:
Marco Top Detected — pivot top or bear reversal found
Marco Bottom Detected — pivot bottom or bull reversal
━━━━━━━━━━━━━━━━━━━━━━━━━━━━━━━━━━━━━━━━━━━━━━━━━━━━━━━━━━━━━━━━
⑤ ZIGZAG MODULE (SWING + INTERNAL)
━━━━━━━━━━━━━━━━━━━━━━━━━━━━━━━━━━━━━━━━━━━━━━━━━━━━━━━━━━━━━━━━
A dual ZigZag engine with a main Swing ZigZag and a
faster Internal ZigZag — each fully independent.
SWING ZIGZAG:
Depth — minimum bars before a pivot is confirmed
Deviation — minimum % price move required for a new leg
Backstep — minimum bars between two pivots
Each ZigZag leg is drawn as a line connecting consecutive
swing highs and lows. Bull legs (rising) and Bear legs
(falling) use separate configurable colours.
HH / HL / LH / LL LABELS:
Each pivot is automatically classified and labelled:
• HH — Higher High (bullish trend continuation)
• HL — Higher Low (bullish trend continuation)
• LH — Lower High (bearish trend continuation)
• LL — Lower Low (bearish trend continuation)
Label size is configurable (Tiny / Small / Normal).
INTERNAL ZIGZAG:
A faster ZigZag with smaller depth and deviation to
capture internal market structure swings within the
main ZigZag legs. Displayed with a different colour
and style (default dashed) to separate it visually
from the main swing ZigZag.
The internal ZigZag is disabled by default. Turn it on
in the Internal ZigZag settings group.
LINE STYLES (both ZigZags):
⎯⎯⎯ Solid
---- Dashed
···· Dotted
Line width: 1–4
━━━━━━━━━━━━━━━━━━━━━━━━━━━━━━━━━━━━━━━━━━━━━━━━━━━━━━━━━━━━━━━━
⚙️ SETTINGS OVERVIEW
━━━━━━━━━━━━━━━━━━━━━━━━━━━━━━━━━━━━━━━━━━━━━━━━━━━━━━━━━━━━━━━━
◆ Master Toggles
Enable / Disable each of the 5 modules independently.
① MA 1 / MA 2 / MA 3 — Type, Length, Colour
① Signal MA — Type, Length, Width, Bull/Bear/Neutral colours
① Signal MA Filters — HA toggle, Supertrend toggle, UT Bot toggle
① Supertrend — ATR Length, Factor
① UT Bot — Key Value, ATR Period
① VWAP — Show toggle, Anchor, Colour
② Liquidity Swings — Pivot Lookback, Swing Area mode
② Filter — Count or Volume, threshold value
② Style — Swing High colour, Swing Low colour,
area colours, label sizes, BSL/SSL labels
③ Smart Money Concepts — Mode (Historical/Present),
Style (Colored/Monochrome)
③ Internal Structure — Show toggle, Bull/Bear filter, label size,
Confluence Filter
③ Swing Structure — Show toggle, Bull/Bear filter, label size,
Swing Points toggle + length,
Strong/Weak High/Low toggle
③ Order Blocks — Internal OB toggle + size,
Swing OB toggle + size,
OB Filter type, OB Mitigation type,
4 individual OB colours
③ EQH/EQL — Show toggle, Bars Confirmation,
Threshold (ATR multiplier), Label size
③ Fair Value Gaps — Show toggle, Auto Threshold,
Timeframe, Bull/Bear colours, Extend
③ Highs & Lows MTF — Daily / Weekly / Monthly toggles,
style and colour for each
③ Premium & Discount — Show toggle, Premium / Equilibrium /
Discount zone colours
④ Marco Polo — Deviation, Depth, Text colour,
BBands Length, BBands Multiplier
⑤ Main ZigZag — Depth, Deviation, Backstep,
Bull/Bear colours, Width, Style,
HH/HL labels toggle + size
⑤ Internal ZigZag — Same settings as main ZigZag,
independently configured
━━━━━━━━━━━━━━━━━━━━━━━━━━━━━━━━━━━━━━━━━━━━━━━━━━━━━━━━━━━━━━━━
🔔 ALERTS SUMMARY
━━━━━━━━━━━━━━━━━━━━━━━━━━━━━━━━━━━━━━━━━━━━━━━━━━━━━━━━━━━━━━━━
SMC Alerts:
✦ Internal Bullish BOS ✦ Internal Bearish BOS
✦ Internal Bullish CHoCH ✦ Internal Bearish CHoCH
✦ Swing Bullish BOS ✦ Swing Bearish BOS
✦ Swing Bullish CHoCH ✦ Swing Bearish CHoCH
✦ Equal Highs ✦ Equal Lows
✦ Bullish Fair Value Gap ✦ Bearish Fair Value Gap
Marco Polo Alerts:
✦ Marco Top Detected (pivot top or bear reversal)
✦ Marco Bottom Detected (pivot bottom or bull reversal)
━━━━━━━━━━━━━━━━━━━━━━━━━━━━━━━━━━━━━━━━━━━━━━━━━━━━━━━━━━━━━━━━
📝 USAGE TIPS
━━━━━━━━━━━━━━━━━━━━━━━━━━━━━━━━━━━━━━━━━━━━━━━━━━━━━━━━━━━━━━━━
• On lower timeframes (1m–5m), disable Fair Value Gaps
and Swing Order Blocks to reduce visual clutter.
• For Nifty/BankNifty intraday, recommended setup:
Signal MA (EMA 20) with all 3 filters ON +
Liquidity Swings + Internal SMC structure only.
• For positional/swing trading, enable the full SMC
module with Historical mode to see all past structure.
• Use Master Toggles to turn off modules you don't need —
this significantly improves chart performance.
• ZigZag and SMC Swing Structure complement each other:
ZigZag shows the visual wave, SMC labels the reason
(BOS/CHoCH) at each pivot.
• Marco Polo works best on 15m and above for pivot
detection. On 1m it may generate excessive signals.
━━━━━━━━━━━━━━━━━━━━━━━━━━━━━━━━━━━━━━━━━━━━━━━━━━━━━━━━━━━━━━━━
📜 LICENSE
━━━━━━━━━━━━━━━━━━━━━━━━━━━━━━━━━━━━━━━━━━━━━━━━━━━━━━━━━━━━━━━━
CC BY-NC-SA 4.0 — Attribution-NonCommercial-ShareAlike 4.0
creativecommons.org
✅ Free to use for personal and educational purposes
✅ Free to share with proper credit to SHK and original authors
✅ Free to adapt and modify with credit and same license
❌ Commercial use is NOT permitted
❌ Cannot be republished as invite-only or paid script
━━━━━━━━━━━━━━━━━━━━━━━━━━━━━━━━━━━━━━━━━━━━━━━━━━━━━━━━━━━━━━━━
⚠️ DISCLAIMER
━━━━━━━━━━━━━━━━━━━━━━━━━━━━━━━━━━━━━━━━━━━━━━━━━━━━━━━━━━━━━━━━
This indicator is published for EDUCATIONAL and INFORMATIONAL
purposes only. It is NOT financial advice, investment advice,
or a recommendation to buy or sell any financial instrument.
Trading and investing in financial markets — including stocks,
indices, commodities, currencies and derivatives — involves
substantial risk of loss. Past performance of any indicator,
strategy or signal does NOT guarantee future results.
The signals, labels, zones and levels produced by this script
are based purely on mathematical calculations applied to
historical price and volume data. They do not predict the
future with certainty. No indicator can.
YOU are solely responsible for your own trading decisions.
Always do your own research and analysis before entering any
trade. Always use proper risk management — including stop
losses and position sizing — on every trade.
The author (SHK) and the original authors of all combined
modules (LuxAlgo, QuantNomad, Marco Polo, ZigZag community)
accept NO liability for any financial losses incurred from
the use of this script, directly or indirectly.
This script is provided "AS IS" without warranty of any kind,
express or implied. The author makes no guarantee that the
script will function correctly on all symbols, timeframes,
brokers or data feeds.
By using this script, you acknowledge and accept that:
• All trading decisions are made entirely at your own risk
• No profit is guaranteed by using this indicator
• The author bears zero responsibility for your P&L
If you are unsure about any trade, consult a registered
financial advisor before taking action.
Trade safe. Manage your risk. Protect your capital. 🙏
━━━━━━━━━━━━━━━━━━━━━━━━━━━━━━━━━━━━━━━━━━━━━━━━━━━━━━━━━━━━━━━━ Indicator
SHK CCI+RSI Merged | ZigZag Swing | HA Signal | Dual Divergence// ============================================================================
// DISCLAIMER: This script is for educational purposes only.
// The author is NOT responsible for any trading losses.
// Past performance does not guarantee future results.
// Trade entirely at your own risk.
// ============================================================================
━━━━━━━━━━━━━━━━━━━━━━━━━━━━━━━━━━━━━━━━
🔷 SHK CCI+RSI MERGED — FULL CONFLUENCE INDICATOR
━━━━━━━━━━━━━━━━━━━━━━━━━━━━━━━━━━━━━━━━
A clean, all-in-one oscillator that merges CCI and RSI into a
single blended line — eliminating indicator clutter while
preserving the best signals from both.
━━━━━━━━━━━━━━━━━━━━━━━━━━━━━━━━━━━━━━━━
📐 HOW THE BLEND WORKS
━━━━━━━━━━━━━━━━━━━━━━━━━━━━━━━━━━━━━━━━
RSI is normalized to the CCI scale before blending:
• RSI 50 → 0 (zero line)
• RSI 70 → +100 (upper level)
• RSI 30 → -100 (lower level)
The two oscillators are then averaged:
Blended = (CCI + Normalized RSI) / 2
This means ±100 is the true overbought/oversold boundary
for BOTH indicators simultaneously.
━━━━━━━━━━━━━━━━━━━━━━━━━━━━━━━━━━━━━━━━
📊 WHAT YOU SEE — 2 LINES ONLY
━━━━━━━━━━━━━━━━━━━━━━━━━━━━━━━━━━━━━━━━
🟢 CCI+RSI Blended Line
Dynamic color based on position vs Signal MA and zero line:
• Bright green → above MA and above zero (strong bull)
• Faded green → above MA but below zero (weak bull)
• Bright red → below MA and below zero (strong bear)
• Faded red → below MA but above zero (weak bear)
🟡 Signal MA Line (EMA / SMA / WMA — your choice)
Colored by Heikin Ashi candle direction:
• 🟢 Green → HA candle is bullish (momentum rising)
• 🔴 Red → HA candle is bearish (momentum falling)
The MA color flip gives early trend change warning.
📊 Histogram bars behind the lines show trend strength
with intensity — brighter = deeper into extreme zone.
━━━━━━━━━━━━━━━━━━━━━━━━━━━━━━━━━━━━━━━━
🔀 ZIGZAG — SWING & INTERNAL
━━━━━━━━━━━━━━━━━━━━━━━━━━━━━━━━━━━━━━━━
ZigZag is drawn directly ON the blended oscillator —
not on price — so you see market structure on the
indicator itself.
✅ Main Swing ZigZag — major HH / HL / LH / LL pivots
✅ Internal ZigZag — minor swings inside the main structure
✅ Labels: HH, HL, LH, LL at every confirmed pivot
✅ Customizable: depth, deviation, backstep, color, style
━━━━━━━━━━━━━━━━━━━━━━━━━━━━━━━━━━━━━━━━
📉 DUAL DIVERGENCE DETECTION
━━━━━━━━━━━━━━━━━━━━━━━━━━━━━━━━━━━━━━━━
Two independent divergence engines running simultaneously:
🟩 CCI+RSI Divergence (solid lines)
Detected on the blended oscillator pivots vs price pivots
• Lime line + "Bull Div" label → bullish divergence
• Red line + "Bear Div" label → bearish divergence
🟦 RSI-Only Divergence (dashed lines)
Detected on raw RSI pivots, drawn at normalized scale
• Aqua dashed + "RSI Bull Div" → RSI bullish divergence
• Orange dashed + "RSI Bear Div" → RSI bearish divergence
━━━━━━━━━━━━━━━━━━━━━━━━━━━━━━━━━━━━━━━━
⚡ ZERO LINE CROSSES
━━━━━━━━━━━━━━━━━━━━━━━━━━━━━━━━━━━━━━━━
🔼 Green triangle (bottom) → blended crossed above zero
🔽 Red triangle (top) → blended crossed below zero
━━━━━━━━━━━━━━━━━━━━━━━━━━━━━━━━━━━━━━━━
🎨 EXTREME ZONE HIGHLIGHTING
━━━━━━━━━━━━━━━━━━━━━━━━━━━━━━━━━━━━━━━━
Background shading activates when blended crosses ±100:
• 🟢 Green background → strong bullish zone
• 🔴 Red background → strong bearish zone
━━━━━━━━━━━━━━━━━━━━━━━━━━━━━━━━━━━━━━━━
🔔 ALERTS INCLUDED
━━━━━━━━━━━━━━━━━━━━━━━━━━━━━━━━━━━━━━━━
✅ Strong Bullish / Bearish signal
✅ Zero line cross (bull & bear)
✅ CCI+RSI above +100 / below -100
✅ Overbought / Oversold zone entry & exit
✅ RSI overbought / oversold / mid cross
✅ Heikin Ashi direction flip (MA color change)
✅ ZigZag swing high / swing low confirmed
━━━━━━━━━━━━━━━━━━━━━━━━━━━━━━━━━━━━━━━━
⚙️ FULLY CUSTOMIZABLE
━━━━━━━━━━━━━━━━━━━━━━━━━━━━━━━━━━━━━━━━
• CCI length and source
• RSI length, source, OB/OS levels
• Signal MA type (EMA / SMA / WMA) and length
• ZigZag depth, deviation, backstep, colors, styles
• Internal ZigZag independently configurable
• Divergence lookback and threshold (separate for CCI & RSI)
• All visual elements individually toggleable
━━━━━━━━━━━━━━━━━━━━━━━━━━━━━━━━━━━━━━━━
💡 BEST USED WITH
━━━━━━━━━━━━━━━━━━━━━━━━━━━━━━━━━━━━━━━━
• Price action / support-resistance levels
• Volume profile or VWAP on the main chart
• Higher timeframe trend confirmation
• Works on all markets: equities, futures, forex, crypto
━━━━━━━━━━━━━━━━━━━━━━━━━━━━━━━━━━━━━━━━
━━━━━━━━━━━━━━━━━━━━━━━━━━━━━━━━━━━━━━━━
⚠️ DISCLAIMER
━━━━━━━━━━━━━━━━━━━━━━━━━━━━━━━━━━━━━━━━
This indicator is published for EDUCATIONAL and
INFORMATIONAL purposes only.
❌ This is NOT financial advice.
❌ This is NOT a buy or sell recommendation.
❌ Past performance does NOT guarantee future results.
Trading financial instruments including stocks, futures,
forex, commodities and cryptocurrencies involves
SUBSTANTIAL RISK OF LOSS and is not suitable for
every investor or trader.
The creator(s) of this script — SHK — are NOT responsible
for any trading losses, damages or financial consequences
resulting from the use or misuse of this indicator.
All trading decisions are SOLELY YOUR OWN RESPONSIBILITY.
You agree to trade entirely at YOUR OWN RISK.
Always conduct your own due diligence. Consult a
qualified and licensed financial advisor before making
any investment or trading decisions.
By using this indicator you acknowledge and accept
all risks associated with trading and release the
author from any and all liability.
📌 TRADE SMART. MANAGE YOUR RISK. PROTECT YOUR CAPITAL.
━━━━━━━━━━━━━━━━━━━━━━━━━━━━━━━━━━━━━━━━
━━━━━━━━━━━━━━━━━━━━━━━━━━━━━━━━━━━━━━━━ Indicator

Macro Fibo LookBackAuto Macro Fibonacci (
Overview
Drawing Fibonacci retracements manually on higher timeframes can often be subjective and tedious. The Auto Macro Fibonacci indicator automates this process by scanning a user-defined historical period (lookback) to identify the absolute macro peak and trough, instantly plotting a flawless, rule-based Fibonacci retracement.
Whether you are looking for deep pullbacks, harmonic pattern completion zones, or major structural support/resistance, this tool filters out the intraday noise and focuses on the big picture.
Key Features
Smart Lookback Engine: Scans the last X bars (default is 300) to find the true macro high and low. You can easily expand this to 500 or 1000 bars to capture multi-year trends.
Auto Trend Detection: The algorithm mathematically calculates which pivot happened first, automatically determining if the macro trend is bullish or bearish, and aligns the 0.0 and 1.0 anchor levels correctly.
Custom Directional Control: Prefer your Fibo anchors drawn differently? Use the settings menu to override the auto-detection and force the draw from "Left to Right" or "Right to Left" to suit your personal trading style.
Includes the 0.886 Level: By default, this indicator includes the 0.886 retracement level, a critical zone for Harmonic pattern traders (specifically the Bat form) and deep liquidity grabs.
Performance Optimized: Built with a custom garbage-collection system (memory management). It dynamically deletes old historical lines on every tick, ensuring it runs lightning-fast on live markets without lagging your chart or hitting TradingView's drawing limits.
Minimalist UI: Designed to keep your charts clean. A single color setting applies to the entire Fibonacci web and the macro dashed trendline, with carefully balanced transparency levels so it doesn't distract from price action.
How to Use
Lookback Period (Bars): Adjust this number to widen or narrow the indicator's field of vision. Smaller numbers (e.g., 100) will catch intermediate swings, while larger numbers (e.g., 500+) will catch major cycle highs and lows.
Fibo Direction: Leave it on "Automatic" for algorithmic trend plotting, or manually flip the 0.0 and 1.0 levels.
Lines Color: Pick one color to seamlessly theme the entire indicator.
Disclaimer: This script is for educational and analytical purposes only. Always use proper risk management. Indicator

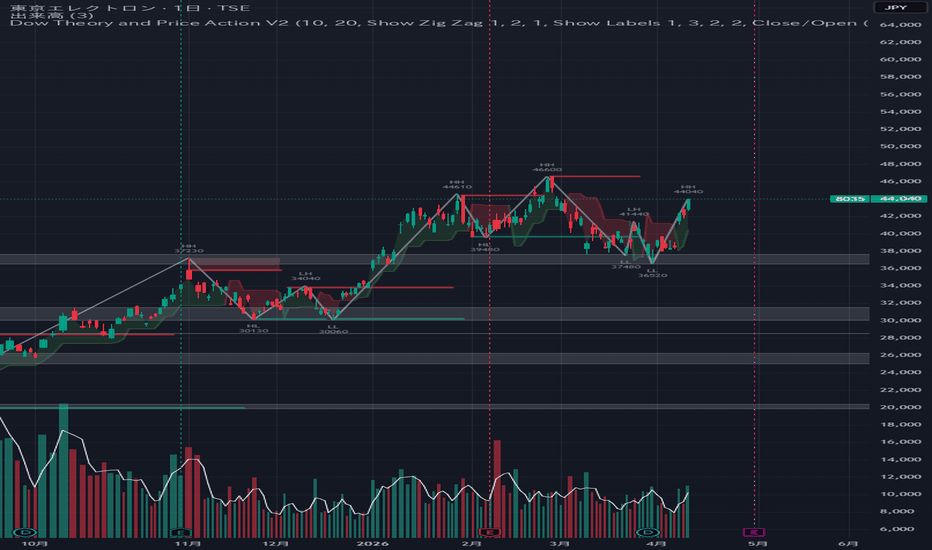
Dow Theory and Price Action V2This indicator is the successor to "T-DOW-FLOW: Final Edition". The trend visualization has been redesigned in a Supertrend style, making it cleaner and easier to read, along with various other refinements.
This indicator integrates multiple analytical tools based on Dow Theory and price action concepts, designed to help traders identify trend direction, key support/resistance levels, and multi-timeframe structure.
─── COMPONENTS ───
【 Dow Theory Trailing Line 】
An ATR-based trailing line driven by ZigZag 1 swing structure. The line rises during uptrends and falls during downtrends, helping visualize the current trend phase according to Dow Theory (Higher Highs / Higher Lows = uptrend; Lower Highs / Lower Lows = downtrend).
【 ZigZag (1 & 2) with HH/LH/HL/LL Labels 】
Two independent ZigZag oscillators with configurable periods. Each swing point is automatically labeled as Higher High (HH), Lower High (LH), Higher Low (HL), or Lower Low (LL) to make Dow Theory structure immediately readable on the chart.
【 SR Type 1 – Pivot Lines & Zones 】
Detects pivot highs and lows on the current timeframe and draws horizontal support/resistance lines. Optionally displays a "Wick-Body Zone" — the range between the wick tip and candle body at each pivot — to highlight the precise supply/demand area.
【 SR Type 2 – Auto Channel Zones 】
Automatically clusters nearby pivot points into support/resistance channels. Strength scoring and filtering parameters allow you to display only the most significant zones and reduce chart noise.
─── HOW TO USE ───
1. Observe the Dow Trailing Line color and position to determine the current trend.
2. Use HH/HL labels to confirm an uptrend, and LH/LL to confirm a downtrend.
3. Look for price reactions at SR Type 1 pivot lines and Type 2 channel zones as potential entry or exit areas.
4. Adjust Left Bars / Right Bars to control pivot sensitivity to your trading style.
─── NOTES ───
• This indicator is for analytical purposes only and does not constitute financial advice.
• Past performance of any setup is not indicative of future results.
• Best used in combination with other confluence factors and proper risk management.
━━━━━━━━━━━━━━━━━━━━━━━━━━━━━━
【日本語説明】
以前公開した「T-DOW-FLOW:Final Edition」の後継インジケーターです。トレンドを表す雲がスーパートレンド風のデザインに刷新され、より視認性が向上しました。その他、細かい調整も加えています。
ダウ理論とプライスアクションに基づく複数の分析ツールを統合したインジケーターです。トレンド方向の把握、主要なサポート・レジスタンスレベルの特定、価格構造の分析をサポートします。
─── 構成要素 ───
【 ダウ理論トレイリングライン 】
ZigZag 1のスイング構造を基にしたATRトレイリングラインです。上昇トレンド中は切り上がり、下降トレンド中は切り下がることで、ダウ理論に基づくトレンドフェーズを視覚的に表現します(HH・HL=上昇トレンド、LH・LL=下降トレンド)。
【 ZigZag(1・2)+ HH/LH/HL/LL ラベル 】
設定可能な2本の独立したZigZagに、各スイング高値・安値を自動でラベリングします。HH(高値切り上げ)・LH(高値切り下げ)・HL(安値切り上げ)・LL(安値切り下げ)を一目で把握できます。
【 SR Type 1 – ピボットライン&ゾーン 】
現在の時間足でピボット高値・安値を検出し、水平なサポート・レジスタンスラインを描画します。各ピボットのヒゲ先端とボディ端の間にゾーンを表示するオプション(ヒゲ-ボディゾーン)で、より精密な需給エリアを確認できます。
【 SR Type 2 – 自動チャンネルゾーン 】
近接するピボット群を自動的にクラスタリングし、サポート・レジスタンスチャンネルとして表示します。強度スコアとフィルタリングパラメーターにより、重要度の高いゾーンだけを絞り込めます。
─── 使い方 ───
1. ダウトレイリングラインの色と位置でトレンド方向を確認する。
2. HH・HLラベルで上昇トレンドを、LH・LLラベルで下降トレンドを確認する。
3. SR Type 1のピボットライン・Type 2のゾーン付近での価格反応を、エントリー・エグジットの根拠として活用する。
4. Left Bars・Right Barsを調整してピボット感度を自分のトレードスタイルに合わせる。
─── 注意事項 ───
• 本インジケーターは分析補助ツールであり、投資助言ではありません。
• 過去のパフォーマンスは将来の結果を保証するものではありません。
• 他の根拠・リスク管理と組み合わせてご利用ください。
Indicator
SMC EMA CROSS ZIG ZAG# Mega Trend Suite – SMC + EMA (Lightweight Edition)
**A professional Smart Money Concepts (SMC) toolkit combined with classic EMA crossovers and VWAP.**
No Heikin Ashi, no MA Cross EMA – just clean price action, order flow, and trend confirmation.
---
## 🔍 Overview
This indicator bundles the most essential tools for **institutional-style analysis**:
- ✅ **SMC Structure** (internal & swing BOS/CHoCH)
- ✅ **Order Blocks** (bullish/bearish, with box or candle highlight)
- ✅ **Fair Value Gaps (FVG)** with auto threshold & multi‑timeframe support
- ✅ **Premium / Discount Zones** + Equilibrium line
- ✅ **Multi‑Timeframe High/Low levels** (Daily / Weekly / Monthly)
- ✅ **ZigZag** (main & internal) with HH/HL/LH/LL labels
- ✅ **VWAP** – anchored to the session
- ✅ **Two EMA sets** (9/21 & 20/50) with cross signals
- ✅ **Compact Dashboard** (SMC bias & current timeframe)
- ✅ **Full alert system** for all SMC events and EMA crosses
---
## 🧠 Key Features Explained
### 1. Smart Money Concepts (SMC)
| Component | What it does |
|-----------|---------------|
| **Swing Structure** | Detects Break of Structure (BOS) and Change of Character (CHoCH) on a higher‑length pivot (default 50). Shows labels “BOS” or “CHoCH” when price crosses a swing high/low. |
| **Internal Structure** | Same as swing, but uses a shorter length (default 10) to catch micro‑structure changes. Optional confluence filter (body vs. wick). |
| **Order Blocks (OB)** | Stores the extreme bar (parsed by volatility filter) after a valid BOS/CHoCH. Displays as zone boxes or candle highlights. Mitigation detection (close / high/low). |
| **Fair Value Gaps (FVG)** | Detects 3‑bar imbalances on a chosen timeframe (or current). Uses auto‑threshold based on historical bar delta. Extendable boxes. |
| **Premium / Discount Zones** | Calculates the range between the highest swing high and lowest swing low. Shades the upper 50% (premium) and lower 50% (discount) with an equilibrium line in the middle. |
| **MTF High/Low Levels** | Plots previous period’s high/low for Daily, Weekly, Monthly. Line style (solid/dashed/dotted) and color customizable. |
| **ZigZag** | Classic pivot‑based ZigZag with HH/HL/LH/LL labels. Separate internal ZigZag available for finer swings. |
### 2. VWAP
- Standard Volume Weighted Average Price.
- Useful for intraday bias – price above VWAP = bullish tilt.
### 3. EMA Sets
Two independent EMA pairs:
- **Set 1:** 9 & 21 (fast)
- **Set 2:** 20 & 50 (slower)
Each set plots its own lines and generates up/down triangles on crossover / crossunder. Colours, widths, and signal colours are fully adjustable.
---
## ⚙️ Input Parameters (Grouped)
### 🔧 Master Controls
- `Enable SMC Module` – turn all SMC features on/off.
### 📊 SMC – General
- `Mode` – Historical (keeps all drawings) / Present (refreshes each bar).
- `Style` – Colored / Monochrome.
### 📊 SMC – Structure & Order Blocks
- Internal / Swing lengths, label sizes, BOS/CHoCH filter (All / BOS only / CHoCH only).
- OB display mode (Both / Zone Box / Candle Highlight).
- OB mitigation source (Close / High/Low).
- OB filter (ATR / Cumulative Mean Range).
### 📊 SMC – Fair Value Gaps
- Auto threshold on/off, custom timeframe, extend bars.
### 📊 SMC – MTF High/Low Levels
- Show Daily / Weekly / Monthly – each with independent line style & colour.
### 📊 SMC – Premium / Discount Zones
- Toggle zones, custom colours for premium, equilibrium, discount.
### 📊 ZigZag Swing Lines
- Main ZigZag depth/deviation/backstep, colours, width, style, labels.
- Optional internal ZigZag with separate settings.
### 📈 VWAP & EMA Sets
- VWAP on/off, colour, width.
- Two EMA sets: each with fast/slow lengths, colours, line width, cross signal colours.
### 📊 Dashboard
- Position (Top‑Left/Right, Bottom‑Left/Right), font size.
### 🎨 Colors
- Global bull / bear / neutral colours (used in dashboard).
---
## 🖥️ Dashboard
A small table shows at a glance:
- **SMC Bias** – Bullish / Bearish / Neutral (based on swing trend).
- **Current Timeframe** – e.g., “60” for 1h, “D” for daily.
The dashboard adapts to dark/light chart background.
---
## 🚨 Alerts (30+ conditions)
All alerts are available from the TradingView alert dialog:
| Category | Alerts |
|----------|--------|
| **Internal Structure** | Bull/Bear BOS, Bull/Bear CHoCH |
| **Swing Structure** | Bull/Bear BOS, Bull/Bear CHoCH |
| **Order Blocks** | Bull/Bear Internal OB mitigated, Bull/Bear Swing OB mitigated |
| **Fair Value Gaps** | Bull FVG formed, Bear FVG formed |
| **EMA Crosses** | EMA Set 1/2 Bull Cross, Bear Cross |
---
## 🧩 How to Use
1. **Add the indicator** to any chart (any symbol, any timeframe).
2. **Keep default settings** for a clean SMC + EMA experience.
3. **For scalping / intraday:**
- Enable Internal Structure (length 5–10).
- Use VWAP as bias filter.
- Watch for FVGs on 1m–15m.
4. **For swing trading:**
- Focus on Swing Structure (length 50+).
- Use Premium/Discount zones for entries (buy in discount, sell in premium).
- Confirm with EMA Set 2 (20/50) cross.
5. **Order Blocks:**
- When price returns to a bullish OB zone, look for buying opportunities.
- When a bearish OB gets mitigated, expect continuation down.
---
## 💡 Tips
- **Monochrome style** is perfect for grayscale / minimalistic setups.
- **Present mode** keeps drawings only on the current visible bars – useful for low‑resource usage.
- **FVG auto‑threshold** works best on higher timeframes (1h+). For lower timeframes, you may turn it off and use manual threshold via the `barDelta` calculation (already built‑in).
- The **ZigZag** does not repaint – it uses confirmed pivots.
---
## 📜 Credits & Version
- **Original concept:** Mega Trend Suite (SMC + HAMA + MA Cross EMA)
- **This edition:** Removed HAMA, MA Cross EMA, and Heikin Ashi Smoothed – keeping only SMC, VWAP, and EMA sets.
- **Version:** 1.0 (Pine Script v6)
---
## ❗ Notes
- This indicator is **not a financial advice** – always use proper risk management.
- Maximum drawings (labels, lines, boxes) are set to 500 each – enough for several months of data.
- Multi‑timeframe levels (Daily/Weekly/Monthly) work correctly only if the chart has enough historical data.
---
**Happy trading!**
*Mega Trend Suite – SMC + EMA* Indicator

Indicator

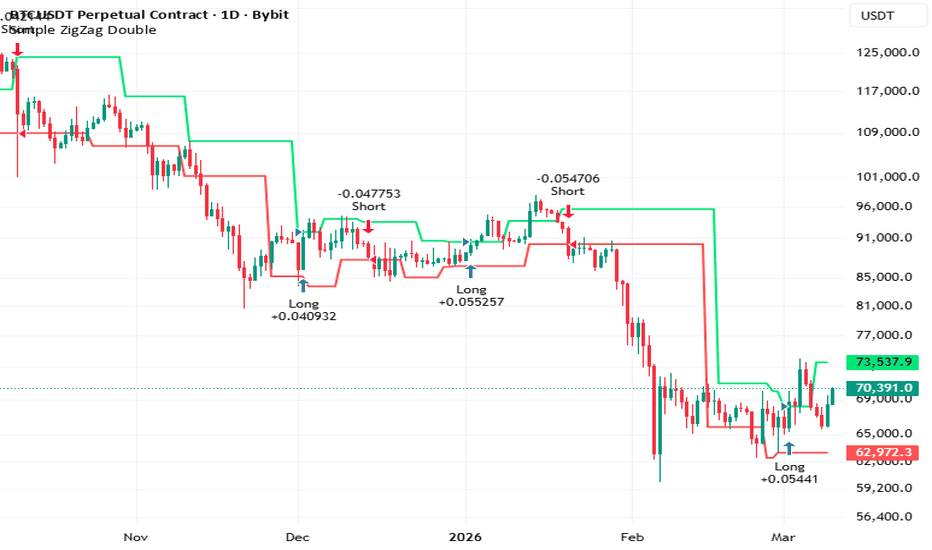
Simple ZigZag DoubleStrategy Description
A simple trend-following strategy with a minimal number of parameters.
The logic is based on the ZigZag concept, but interpreted in a different way so that the algorithm does not repaint and does not rely on pivot indicators.
The key difference from many similar approaches is that Long and Short levels have separate settings, allowing more flexible tuning of the strategy behavior.
By default, the strategy includes a 0.1% commission in the backtest.
Settings
Use Long – Enable or disable opening Long positions.
Use Short – Enable or disable opening Short positions.
Length – Affects the frequency of level creation and the position of the ZigZag point used by the algorithm.
Detection – Determines the price level. It controls how many candles after the ZigZag point are used to search for the minimum or maximum price.
Lot Long, % – Percentage of equity allocated to opening a Long position.
Lot Short, % – Percentage of equity allocated to opening a Short position.
Time Start – Start of the testing period.
Time End – End of the testing period.
Example: you can test only a specific time range (for example, August 2020).
Recommended Timeframes
The strategy is designed primarily for timeframes of 4H and higher.
Strategy Logic
The main idea of the strategy is to capture strong trending market movements as early as possible and hold the position during the trend.
Trades are opened when the price breaks predefined levels built from previous highs or lows.
The strategy generally keeps a position open and reverses from Short to Long (or vice versa) when an opposite signal occurs, unless additional modifications of the strategy are used.
⚠️ The strategy may generate losing trades during sideways markets and during sharp V-shaped reversals.
Order Type
The strategy uses Market Stop orders (on some exchanges these may be called Conditional or Trigger orders).
Green level – price where a conditional order to open a Long position is placed.
Red level – price where a conditional order to open a Short position is placed.
Order Logic
When the strategy starts:
If there is no open position and the price is between the levels, two orders are placed:
one order to open a Long position
one order to open a Short position
If the price is not between the levels, or if a position is already open, only one order will be placed.
When a position is open, the strategy maintains only one active order.
By default, the size of this order equals position size × 2, which allows the strategy to close the current position and immediately open a new one in the opposite direction when the level is triggered. Strategy
Zig Zag Liquidity Pools & Sweeps by Capitan-TradingZig Zag Liquidity Pools & Sweeps
Many traders focus only on price movement, but price alone often hides an important part of the story.
Markets constantly move between areas of liquidity .
These are zones where stop orders and pending orders accumulate around previous highs and lows.
When these levels are taken, the event is commonly known as a liquidity sweep .
Understanding where these pools exist – and when they are removed from the market – can help traders better interpret market structure and reactions .
This indicator is designed to visually map liquidity pools and highlight sweep events using a clean Zig Zag-based structure.
Instead of manually searching for equal highs or equal lows, the script automatically detects relevant pivot levels and projects them forward as potential liquidity targets.
What problem does this tool solve?
Many traders struggle with identifying:
• Where liquidity is resting
• When that liquidity has been swept
• How price reacts after a liquidity event
Manually tracking these areas across multiple swings can be time-consuming and inconsistent.
This indicator simplifies the process by providing a clear visual framework for observing liquidity .
How the indicator works
The script combines three visual components:
Zig Zag Structure Engine
A Zig Zag structure helps define the most relevant market swings , filtering minor noise and highlighting meaningful pivots.
These pivots act as reference points for identifying potential liquidity zones .
Liquidity Pools
When a significant pivot high or low forms, the indicator projects a horizontal liquidity line .
These lines extend forward until the market interacts with them.
Traders can use these levels as reference zones where stop liquidity may exist .
Liquidity Sweeps
When price trades through one of these liquidity levels, the indicator marks the event with an X , signaling that the liquidity pool has been swept .
This helps quickly identify areas where the market has removed liquidity before potentially continuing or reversing .
Clean Chart Tip
For an even clearer analysis, you may occasionally hide the price candles and observe only the liquidity structure drawn by the indicator.
On TradingView this can be done easily:
Click the three dots next to the asset name and temporarily hide the price series.
This allows you to observe only:
• Zig Zag structure
• Liquidity pools
• Sweep events
Removing the candles can create a much cleaner visual map of liquidity movements .
You can re-enable the candles anytime to reconnect the liquidity structure with price action.
Typical use cases
Traders often use liquidity mapping to observe:
• Potential stop-run areas
• Structural liquidity sweeps
• Liquidity grabs during consolidation
• Interaction between structure and liquidity
This indicator provides a clean visual representation of these dynamics .
Important
This script is designed as a visual market analysis tool .
It does not provide financial advice and should be used alongside proper market understanding, risk management, and independent analysis .
VERSIONE ITALIANA
Zig Zag Liquidity Pools & Sweeps
Molti trader si concentrano esclusivamente sul movimento del prezzo, ma il prezzo da solo spesso nasconde una parte importante della storia.
I mercati si muovono continuamente tra zone di liquidità .
Si tratta di aree in cui si accumulano stop loss e ordini pendenti attorno ai massimi e minimi precedenti.
Quando questi livelli vengono colpiti, l’evento viene comunemente chiamato liquidity sweep .
Comprendere dove si trovano queste zone – e quando vengono rimosse dal mercato – aiuta a interpretare meglio la struttura e le reazioni del prezzo .
Questo indicatore è progettato per mappare visivamente le liquidity pools e identificare gli sweep utilizzando una struttura basata sullo Zig Zag.
Lo script rileva automaticamente i pivot più rilevanti e li proietta nel futuro come possibili target di liquidità.
Quale problema risolve questo strumento?
Molti trader hanno difficoltà nell’identificare:
• Dove si trova la liquidità
• Quando questa liquidità viene presa dal mercato
• Come reagisce il prezzo dopo uno sweep
Monitorare manualmente queste aree su più swing può essere complesso e poco coerente.
Questo indicatore offre una rappresentazione visiva chiara delle zone di liquidità .
Come funziona l’indicatore
Lo script combina tre componenti principali:
Struttura Zig Zag
La struttura Zig Zag aiuta a identificare gli swing più rilevanti del mercato , filtrando il rumore minore.
Questi pivot diventano i riferimenti per individuare possibili zone di liquidità .
Liquidity Pools
Quando si forma un pivot significativo, l’indicatore traccia una linea orizzontale di liquidità .
Queste linee vengono estese fino a quando il prezzo non interagisce con esse.
I trader possono usarle come zone dove potrebbero trovarsi stop e ordini pendenti .
Liquidity Sweeps
Quando il prezzo supera uno di questi livelli, l’indicatore segna l’evento con una X , indicando che la liquidità è stata presa dal mercato .
Questo permette di individuare rapidamente le aree in cui il mercato rimuove liquidità prima di continuare o invertire il movimento.
Suggerimento per un grafico più pulito
Per una lettura ancora più chiara è possibile nascondere temporaneamente le candele del prezzo.
Su TradingView basta cliccare sui tre puntini accanto al nome dell’asset e nascondere la serie del prezzo.
In questo modo potrai osservare solo:
• Struttura Zig Zag
• Liquidity pools
• Sweep di liquidità
Senza il rumore delle candele il grafico diventa una mappa visiva molto pulita della liquidità di mercato .
Importante
Questo script è uno strumento di analisi tecnica visiva .
Non rappresenta consiglio finanziario e dovrebbe essere utilizzato insieme a una corretta gestione del rischio e comprensione del mercato . Indicator
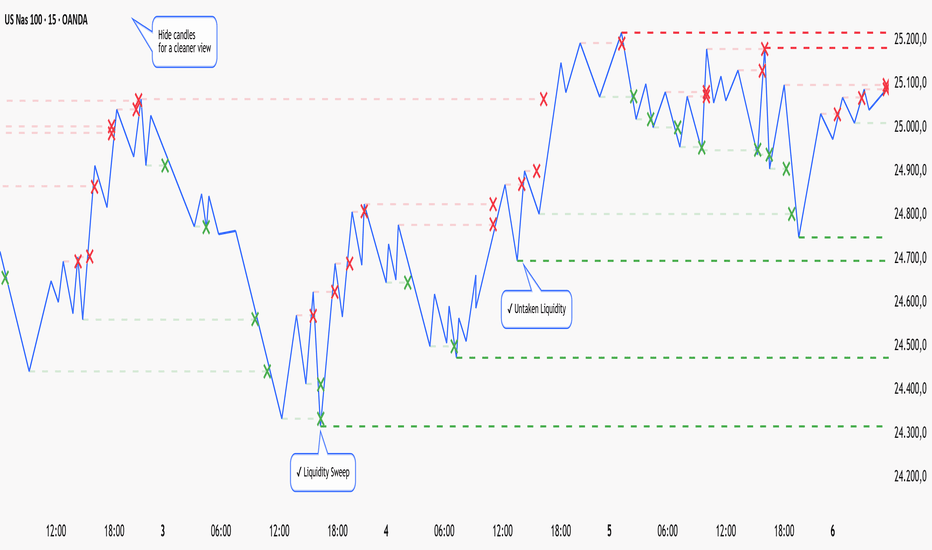
Gann-Fibonacci Swing Toolkit [BigBeluga]🔵 OVERVIEW
Gann–Fibonacci Swing Toolkit is an advanced swing-based projection tool that combines classic Gann geometry with Fibonacci ratios.
The indicator automatically detects market swings, anchors them to the most recent structure, and dynamically plots either Gann Fans or Gann Boxes to visualize price–time relationships, trend angles, retracement zones, and expansion targets.
This toolkit is designed to help traders understand not only where price may react, but also how fast it should move relative to time.
🔵 HISTORICAL BACKGROUND
The foundation of this toolkit comes from two of the most influential schools of market geometry:
W.D. Gann (early 1900s) introduced the idea that markets move according to geometric and mathematical laws, where price and time must stay in balance . His work emphasized angles (such as 1×1, 1×2, 1×3) that define how much price should advance or decline per unit of time.
Fibonacci ratios , derived from the Fibonacci sequence and popularized in trading decades later, describe natural proportional relationships observed across markets, especially during corrections and expansions.
Modern technical analysis merges these ideas by applying Fibonacci ratios to Gann’s price–time framework, creating tools that measure both distance (price) and duration (time) .
The Gann–Fibonacci Swing Toolkit follows this combined philosophy by grounding all projections in real swing structure rather than static or manually drawn anchors.
🔵 CORE CONCEPT
Swing-Based Anchoring — All calculations start from confirmed swing highs and lows detected via a rolling highest/lowest lookback.
Directional Context — The tool automatically determines bullish or bearish structure and adapts all projections accordingly.
Price–Time Geometry — Gann logic is applied by projecting price movement relative to elapsed bars, not just price distance.
🔵 KEY FEATURES
SWING DETECTION LOGIC
A swing high is confirmed when price forms a local maximum and then fails to extend higher.
A swing low is confirmed when price forms a local minimum and then fails to extend lower.
The most recent completed swing becomes the anchor point for all Gann and Fibonacci calculations.
Optional ZigZag lines visually connect completed swings for structural clarity.
GANN FAN MODE
When Fibonacci Type = Fan , the indicator plots dynamic Gann fan angles from the swing anchor.
Fan Ratios — Each fan line represents a 1/x (1/1, 1/2, 1/3, etc.), defining how much price should move per unit of time.
Trend-Aware Projection
- Bullish fans project upward from swing lows.
- Bearish fans project downward from swing highs.
Fan Fill Zones — Optional shaded regions between fan levels highlight price compression and expansion areas.
GANN BOX (FIBONACCI BOX) MODE
When Fibonacci Type = Box , the indicator builds a Gann Box using Fibonacci retracement and time ratios.
Horizontal Levels — Fibonacci price retracement levels (0.236, 0.382, 0.5, 0.618, 0.786) are projected from the swing range.
Vertical Levels — Fibonacci time divisions are applied across the swing duration to estimate timing of reactions.
Inverse Mode — Flips retracement logic to project inverted expansions instead of standard pullbacks.
OTE Zone — Optional Optimal Trade Entry zone highlights the premium/discount retracement area.
Dual-Axis Structure — Combines price and time into a single geometric framework instead of treating them separately.
MAIN FRAME LOGIC
A dynamic frame is drawn between the swing anchor and current bar, scaled by trend slope.
The frame visually represents the dominant trend channel derived from swing geometry.
VISUAL ELEMENTS
Swing anchor labels mark the exact price and bar index used for calculations.
Color-coded bullish and bearish swings improve structural readability.
Labels on fan and box levels display their exact Fibonacci ratios.
🔵 HOW TO USE
Use Gann Fans to trade dynamic trend support and resistance that evolves with time.
Use Gann Boxes to identify high-probability retracement zones and timing windows.
Combine fan angles with horizontal box levels for confluence-based entries.
Disable ZigZag if you want a cleaner chart focused only on projections.
🔵 CONCLUSION
Gann–Fibonacci Swing Toolkit is a geometry-driven market structure tool that goes beyond static Fibonacci levels.
By uniting Gann’s price–time balance with Fibonacci proportionality and anchoring everything to real swing structure, the indicator provides a deeper framework for understanding trend behavior, corrective depth, and future reaction zones — all derived directly from price action itself. Indicator

Price Simplification [LuxAlgo]The Price Simplification indicator provides a streamlined representation of price action by reducing complex market movements into essential trend segments using the Ramer-Douglas-Peucker (RDP) algorithm.
This indicator calculates its output based on a fixed window of historical data. Consequently, the line segments are displayed retrospectively and are subject to repainting as new bars develop and the calculation window shifts.
🔶 USAGE
The indicator is designed to help traders identify the core structure of price movement by filtering out "noise"—small fluctuations that do not significantly impact the overall trend. By simplifying the price into a series of connected segments, it becomes easier to visualize support/resistance levels, trend slopes, and market geometry.
Users can adjust the level of simplification to suit their needs:
A lower ATR Multiplier will result in a line that follows price closely, capturing more minor swings.
A higher ATR Multiplier will produce a more aggressive simplification, highlighting only the most significant market turns.
🔹 Extension Line
The script includes an "Extend Last Segment" feature. When enabled, it projects the trajectory of the final simplified segment into the future using a dashed line. This projection begins one bar after the most recent data point, providing a visual guide for the current price momentum without overlapping the historical simplification.
🔶 DETAILS
The core logic of this tool relies on the Ramer-Douglas-Peucker (RDP) algorithm, a classic algorithm used in computer graphics and cartography to reduce the number of points in a curve.
The algorithm works through an iterative process:
It starts with a line segment connecting the first and last points of the lookback window.
It identifies the point between these two ends that is furthest from the segment (perpendicular distance).
If this maximum distance is greater than a specified threshold, that point is kept as a "key point," and the algorithm splits the segment into two parts, repeating the process for each.
If no point is further than the threshold, all intermediate points are discarded, and the segment remains a straight line.
To ensure the simplification remains consistent across different assets and timeframes, the script normalizes price coordinates using the Average True Range (ATR) . This means the threshold for keeping a point is relative to the current market volatility rather than a fixed price value.
🔶 SETTINGS
Window Size : The number of recent bars used to apply the RDP algorithm to.
ATR Multiplier : The sensitivity of the simplification. Higher values lead to fewer segments and a simpler line.
ATR Length : The period used to calculate the ATR for price normalization.
Line Color : The color of the simplified polyline.
Line Width : The thickness of the polyline and extension.
Extend Last Segment : When enabled, projects the slope of the final segment forward as a dashed line starting one bar after the last point.
Indicator

[CT] ORB SuiteThis indicator is an Opening Range first tool that also includes an Initial Balance framework, breakout detection, and a full target and alerting package. It is designed to define a clean Opening Range at the start of the regular trading session and then turn that range into an actionable breakout structure by plotting the key levels, projecting measured targets, and visually confirming the exact breakout candle on your chart. The Opening Range component can be configured as either the first bar of the session or a true time-based duration, such as 1, 2, 5, 10, 15, 30 minutes, or 1 hour, which lets you standardize the opening structure across different chart timeframes without needing to “count bars.” As price prints during the Opening Range window, the script continuously updates the OR high and OR low, then locks those levels once the window closes so you have a stable reference for the rest of the session. The OR area can be shaded for quick visual recognition, and an optional OR midpoint line and label can be displayed to help you judge whether price is accepting above the middle of the range or failing back through it.
Once the Opening Range is formed, the script upgrades the workflow by adding breakout qualification rules that you can control. You can choose confirmation based on a body cross, a close cross, or a close above or below the range boundary, which is a meaningful improvement over simple “touch” logic because it helps reduce false signals and makes the breakout trigger more consistent with how you actually trade. When a breakout is confirmed, the indicator can highlight the breakout candle itself so there is no ambiguity about which bar triggered the signal. You can highlight the candle body, the chart background, or both, and you can select separate colors for long and short breakouts. This makes chart review and live decision-making cleaner because you can immediately see where the breakout truly occurred instead of guessing between several candles that probed the level.
The next major upgrade is the breakout target system. After a long breakout, targets are calculated as true multiples of the Opening Range size, starting from the OR high and projecting upward by the selected multiples. After a short breakout, targets are calculated from the OR low and projected downward by the same multiple logic. By default, the script supports four take-profit targets, TP1 through TP4, with sensible preset multiples that step outward in a structured way, but you can customize each multiple to match your instrument and style. This target system is a practical enhancement because it provides objective, range-based profit-taking levels that align with common intraday expansion behavior rather than arbitrary fixed tick offsets. You also get full control over whether the target lines and labels appear only after a breakout triggers, which keeps the chart clean and prevents “pre-biasing,” or whether you want to see projected targets in both directions before the breakout occurs for planning and scenario mapping. In addition, the target hit detection is configurable so you can decide whether a target is considered “hit” by a simple high or low touch or only after a close crosses the target, which is important for traders who want stricter confirmation and cleaner backtesting logic.
Beyond the OR and targets, the indicator includes a complete Initial Balance module as an additional layer of structure. The IB duration is selectable and independent, and the script can plot IB high, IB low, and an optional IB midpoint, with optional fill shading to make the balance area obvious. A key upgrade here is the ability to base the breakout targets on either the Opening Range or the Initial Balance. This means you can run a pure OR breakout playbook, a pure IB breakout playbook, or compare both structures on the same session without changing indicators. This flexibility matters because OR breakouts tend to be more sensitive and earlier, while IB-based levels often better reflect the session’s early balance and can produce more stable expansion targets.
Another major improvement is the history and session management. The script can freeze all drawings at the end of the session so lines and fills do not incorrectly extend into the next day, and it can optionally keep a configurable amount of history, such as the last 20 sessions, so you can study how price reacts to prior OR and IB structures. You also have control over whether IB should be included in that stored history, which helps if you want a cleaner chart while still retaining the OR context. To support different chart themes and personal preferences, label styling is expanded with controls for label background colors, text colors, transparency, and horizontal offsets, so the levels remain readable without covering price action.
Finally, the alerting system is upgraded into a full set of actionable events. The indicator can generate alerts for session open and session close, for the moment the Initial Balance forms, for the moment the Opening Range forms, for long and short breakouts, and for each target hit from TP1 through TP4. Alerts can be used in standard alertcondition form or as dynamic alert() calls that include price-filled messages, which is a practical enhancement for traders who want their phone or desktop notifications to contain the exact level values rather than generic labels.
This script is a derivative work built on the original Initial Balance foundation authored by © czoa under the Mozilla Public License 2.0, with extensive additions and improvements by © ChaosTrader63 to expand it into a complete Opening Range and Initial Balance breakout suite. The core upgrades are the configurable time-based Opening Range, breakout candle highlighting, multi-target measured range projections through TP4 with optional pre-projection behavior, stricter breakout confirmation modes, target hit rules, richer history controls, stronger label customization, and a comprehensive alert system that turns the session structure into a usable trade planning and execution framework directly on TradingView. Indicator

Auto Fibonacci Lines Depending on ZigZag %In the world of technical analysis, few tools are as powerful—or as misused—as Fibonacci Retracements. The Auto Fibonacci Lines Depending on ZigZag % is not just an indicator; it is a complete, automated trading system designed to eliminate subjectivity and bring institutional-grade precision to your charts.
This script automates the identification of significant market structures using a ZigZag algorithm. Once a market swing is mathematically confirmed (based on your deviation settings), it instantly projects a complete suite of Retracement and Extension levels. This allows you to stop guessing where to draw your lines and start focusing on price action.
🧠 The Logic Behind the Indicator
Understanding how your tools work is the first step to trusting them. This script operates on a three-step logic loop:
ZigZag Identification:
The script continuously monitors price action relative to the last known pivot point. It uses a user-defined Deviation % to filter out market noise. A new "Leg" is only confirmed when price reverses by this specific percentage. This ensures that the Fibonacci lines are only drawn on significant market moves, not random chop.
Automated Anchor Points:
Once a downward trend is confirmed (e.g., price drops 30% from the top), the script automatically anchors the Fibonacci tool to the Swing High (Start) and the Swing Low (End). It does this without you needing to click or drag anything.
Dynamic Cleanup:
Markets evolve. A key feature of this script is its self-cleaning mechanism. As soon as a new trend leg is confirmed, the script automatically deletes the old, invalidated Fibonacci lines and draws a fresh set for the new structure. This keeps your chart clean and focused on the now.
🎓 How to Trade This System
This indicator is color-coded to simplify your decision-making process. It moves beyond standard "rainbow" charts by categorizing price levels into three distinct actionable zones.
1. The "Reload Zone" (White Lines: 0.618 - 0.786) ⚪
Role: High-Probability Support / Entry
In institutional trading, the 0.618 (Golden Ratio) to 0.786 region is often where algorithms step in to defend a trend.
Why it works : This is the "discount" area where smart money re-accumulates positions before the next leg up.
2. The "Decision Wall" (Blue Lines: 1.382 - 1.5) 🔵
Role: Strong Resistance / Trend Check
This is a unique feature of this suite. The 1.382 and 1.5 levels often act as a "ceiling" for weak breakouts.
Strategy : If you entered in the White Zone, the Blue Zone is your first major hurdle. If price stalls here, consider securing partial profits.
Warning : A rejection from the Blue Lines often leads to a double-top formation. However, a clean break above the Blue Lines usually signals a parabolic move is beginning.
3. The "Extension Zone" (Yellow, Red, Purple > 1.618) 🟡🔴
Role : Take Profit / Exhaustion
Levels above 1.5 (starting with the 1.618 Golden Extension) are statistical extremes.
Strategy : These are Strict Take Profit levels. Do not FOMO (Fear Of Missing Out) into new long positions here. The probability of a reversal increases drastically as price climbs through these levels (2.618, 3.618, 4.618).
📐 The Mathematical Edge: Logarithmic vs. Linear
One of the most critical features of this script is the ability to toggle between Logarithmic and Linear calculations.
Why use Logarithmic?
If you are trading Crypto (Bitcoin, Altcoins) or high-growth Tech Stocks, linear Fibonacci levels are mathematically incorrect over large moves. A 50% drop from $100 is different than a 50% drop from $10.
This script calculates the percentage difference (Log Scale), ensuring your targets are accurate even during 100%+ parabolic runs.
Why use Linear?
For mature markets like Forex (EURUSD) or Indices (SPX500) where volatility is lower, Linear scaling is the industry standard.
🛠️ Configuration & Best Practices
Deviation % : This is the heartbeat of the indicator.
Swing Trading : Set to 20-30%. This filters out noise and only draws Fibs on major macro moves.
Scalping : Set to 3-5%. This will catch smaller intraday waves.
Text Place : Keeps your chart clean by pushing labels to the right, ensuring they don't overlap with the current price action.
👤 Who Is This Indicator For?
The Disciplined Trader : Who wants to remove emotional bias from their charting.
The Crypto Investor : Who needs accurate Logarithmic targets for long-term holding.
The Confluence Trader : Who combines these automated levels with Order Blocks, RSI, or Volume to find the perfect entry.
⚠️ RISK DISCLAIMER & TERMS OF USE
For Educational Purposes Only:
This script and the strategies described herein are provided strictly for educational and informational purposes. They do not constitute financial, investment, or trading advice. The "Auto Fibonacci Lines" indicator is a tool for technical analysis and should not be used as the sole basis for any trading decision.
No Guarantees:
Past performance of any trading system or methodology is not necessarily indicative of future results. Financial markets are inherently volatile, and trading involves a high level of risk. You could lose some or all of your capital.
User Responsibility:
By using this script, you acknowledge that you are solely responsible for your own trading decisions and risk management. The author assumes no liability for any losses or damages resulting from the use of this tool or the information provided. Always consult with a qualified financial advisor before making investment decisions. Indicator