APLLTD - Consolidating Above Breakout ZoneAPLLTD - After making a low near 635, the stock started a strong reversal and gradually improved its market structure.
It faced resistance around the 810 zone and later broke above it with a strong displacement move, showing buying momentum.
The subsequent pullback was shallow and held above the breakout area, which looks more like a healthy retest rather than a breakdown.
Now, the stock is consolidating above the previous resistance-turned-support zone, while the key EMAs remain aligned and
Alembic Pharmaceuticals Limited
No trades
No trades
In-depth trading ideas
Alembic Pharmaceuticals - Inverse Head & Shoulder✅ Inverse Head & Shoulders breakout confirmed.
✅ Strong breakout candle with above-average volume.
✅ Price trading above 20 DMA & 50 DMA.
✅ RSI above 70 confirms strong bullish momentum.
✅ Fresh volume expansion indicates institutional buying.
Trigger: Sustained trade above ₹825 can lead to a move towards ₹880 → ₹940 over the next 2–3 months, while ₹754 remains the key structural support.
#ALEMBIC PHARMACEUTICALS LTD. #VOLUME ACCUMALATIONAlembic Pharma looks technically constructive after a prolonged correction and base-building phase. The stock is now approaching a key resistance zone around ₹790–820 with improving price structure and gradual volume expansion. Look like accumulation at lower levels. A decisive breakout above the current consolidation range could trigger fresh momentum and trend reversal confirmation. I am adding this stock in my watchlist for further study.
Date 10/05/26
Disclaimer: I am not a SEBI registere
Alembic Pharma — After 100-Day ConsolidationAlembic Pharma has spent nearly 100 days in a tight consolidation box, holding above major support while maintaining a higher-high, higher-low structure on the long-term (1400-day) chart. This combination strongly favors a bullish continuation breakout.
Technical Outlook (Bullish Bias)
Price has remained inside a narrow consolidation band for ~100 days. Such extended compression typically leads to a single-direction strong move.
Strong Support: ~₹900 zone
Primary Resistance / Breakout Zone:
ALEMBIC PHARMAAlembic Pharma has been actively expanding its product portfolio and regulatory approvals, especially in the U.S. market and is well-positioned for multi-dimensional growth.
It operates a vertically integrated pharmaceutical business, allowing control over the entire value chain—from R&D to manufacturing and global marketing.
Key Segments:
Formulations: Branded generics and specialty drugs across therapeutic areas like cardiology, anti-infectives, diabetology, and gynecology.
APIs (Active P
APLLTDAPLLTD is getting ready, moving above 20-50ema, probability of an upside move.
Keep eyes on it.
✅ If you like my analysis, please follow me as a token of appreciation :)
in.tradingview.com/u/SatpalS/
📌 For learning and educational purposes only, not a recommendation. Please consult your financial advisor before investing.
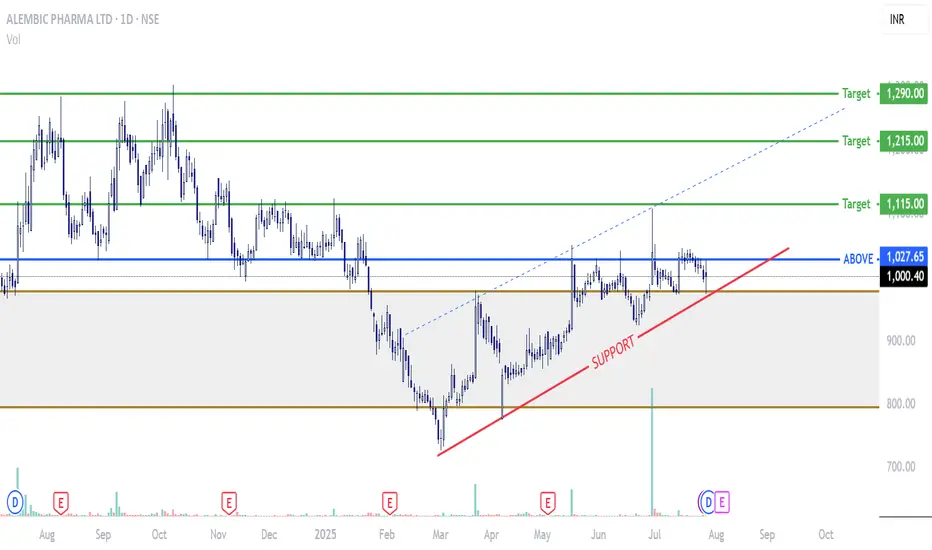
ALEMBIC PHRAMA NEAR TRENDLINE BREAKOUTThe price recently touched its support zone near 1033 , and gave a good upside move from the mentioned price point now stock is trading moving near to its trendline after multiple retest .target can be considered 1600+ and quantities can be added on pull backs view fails below 980.45.
Alembic Pharma Swing Long Setup- Alembic Pharma is currently trading at 1242
- Alembic Pharma is compressing and I think it can shoot up more
- The Pharma Index has been outperforming for weeks and I think it still has a lot of upside to move up
- 1177 can be a very good zone to look for longs and if you are looking for swings
- Invalidation below 1120 manage risk
Alembic Pharmaceuticals LtdCompany Essentials
Market Cap
₹ 24,429.85 Cr.
Enterprise Value
₹ 24,823.40 Cr.
No. of Shares
19.66 Cr.
P/E
32.79
P/B
4.8
Div. Yield
0.89 %
Book Value (TTM)
₹ 258.70
CASH
₹ 26.49 Cr.
DEBT
₹ 420.04 Cr.
Promoter Holding
69.61 %
EPS (TTM)
₹ 37.91
Sales Growth
14.08%
ROE
14.30 %
ROCE
14.62%
Profit Growth
92.22 %
Alembic Pharmaceuticals Stock Analysis - Rising Wedge Formation🔍 Technical Analysis Update: Alembic Pharmaceuticals Ltd. (NSE: APLLTD) shows a rising wedge pattern on the 15-minute chart, indicating potential bearish trends ahead. 📉 The formation of "Top 1" and "Top 2" suggests a resistance level, with the stock price potentially targeting lower levels. Keep an eye on the target zones highlighted in the chart for strategic entry and exit points.
📊 Current Price: ₹1,206.00
🔻 Potential Target: ₹1,070.00
#StockMarket #TechnicalAnalysis #AlembicPharmaceutical
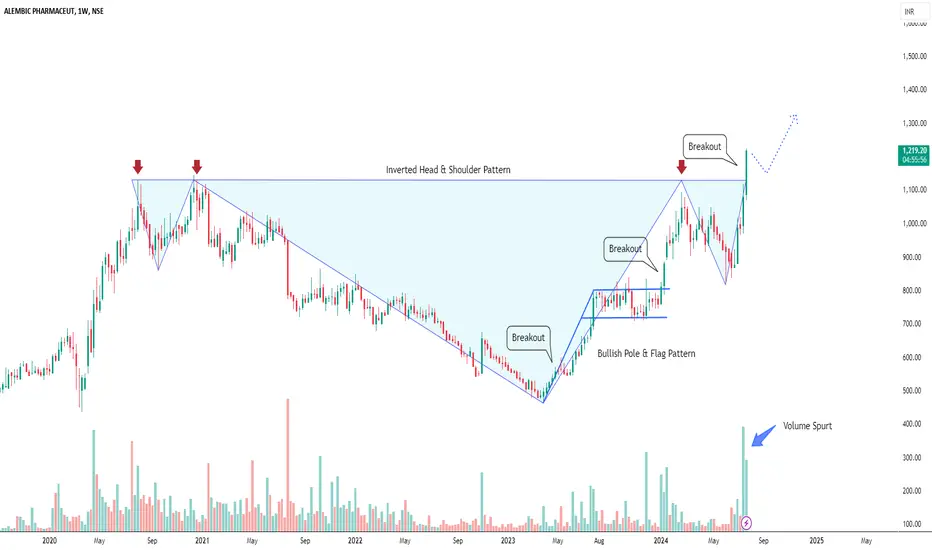
Momentum Trading Picks - Alembic Pharma & Quess Corp.Alembic Pharma
The stock encountered several rejections around the 1,130 level, leading to a significant correction in price.
Eventually, it found support near the 460 level and began to climb upwards.
During this upward movement, a Bullish Pole & Flag pattern emerged in the stock price chart, suggesting a potential continuation of the trend.
Following a breakout, the price trended upwards with a minor pullback before recently achieving a breakthrough with strong volume support.
Que
APLLTD [pitchfan tool]APLLTD ...
pitchfan trading :- first time i share this tool i use in my technical study purpose . The chart has several green and yellow circles highlighting significant zones. These typically represent areas of interest, such as support, resistance, or breakout points.
show potential support and resistance levels. They suggest the market could reverse its direction or experience a significant price movement along these lines.
Price Targets:
1st Target (1st TRG): The first target