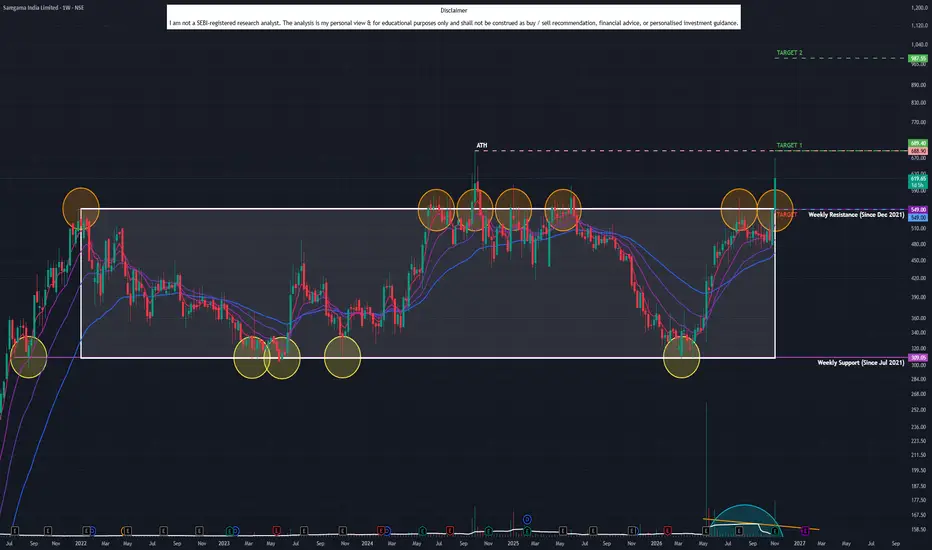
Saregama India (W): 5-YEAR MACRO BREAKOUTTimeframe: Weekly | Chart Scale: Logarithmic
Explosive +12.94% weekly surge backed by a massive 35.86M volume spike! ๐ฅ
Technical Highlights:
โ
Breakout: Cleared & closed above a massive sideways consolidation active since Dec '21!
โ
Volume: Sudden massive surge snaps a dry volume spellโtextbook accumulation.
โ
Momentum: Perfect EMA alignment (Daily/Weekly/Monthly). MACD & RSI rising. ๐
Key Levels to Watch:
๐ฏ Target 1: 690
๐ฏ Target 2: 985
๐ก๏ธ Support / Pullback: 549 (Previous
Saregama India Limited
No trades
No trades
In-depth trading ideas
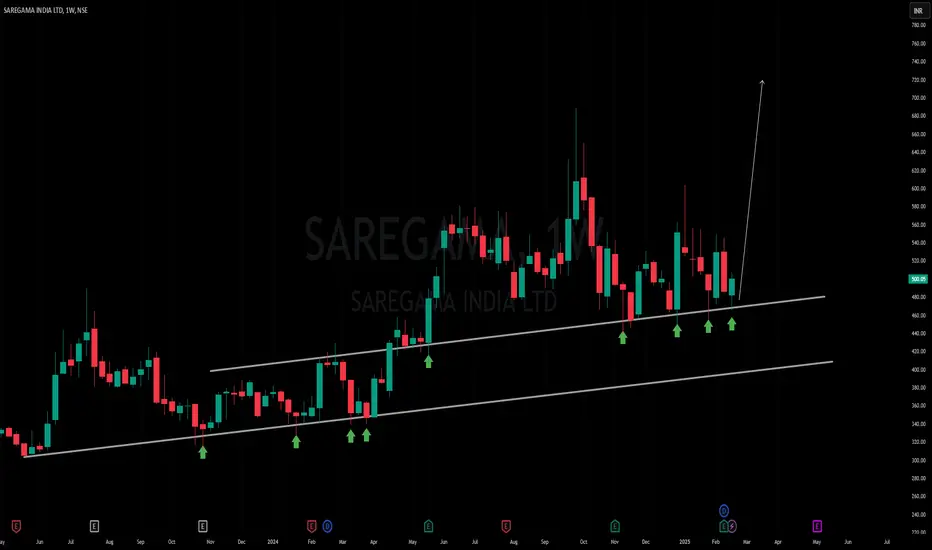
๏ปฟSAREGAMA SAREGAMA | Weekly Breakout Setup
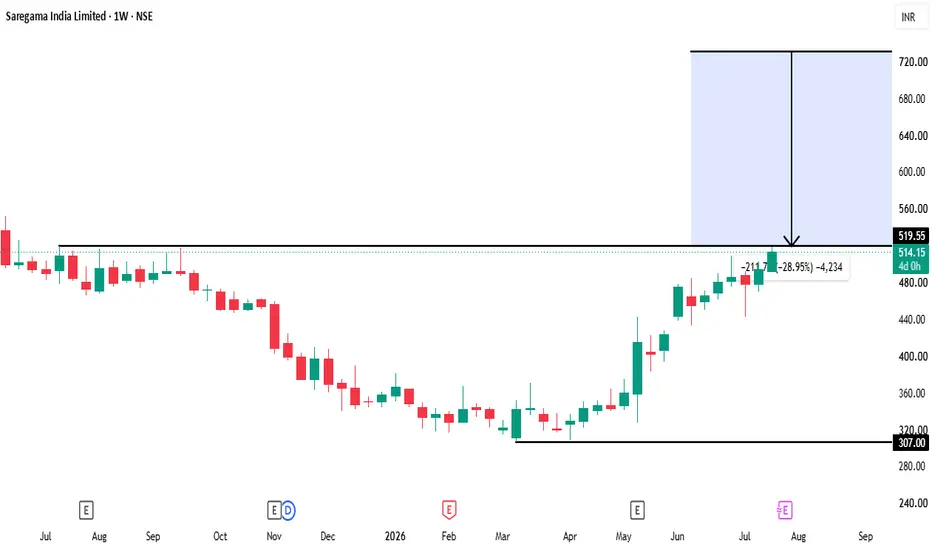
After a prolonged consolidation, Saregama has broken above an important resistance zone and is showing improving momentum on the weekly timeframe.
Key observations:
Strong structural breakout
Higher highs and higher lows
Trend continuation setup
Potential upside toward โน720 if the breakout sustains
This analysis is based purely on price structure and technical analysis, not financial advice.
๐ฌ Share your view in the comments.
Saregama India LtdDate 03.10.2025
Saregama
Timeframe : Day Chart
Key Highlights
(1) Company is almost debt free
(2) Debtor days have improved from 63.4 to 44.6 days
(3) Company's median sales growth is 18.8% of last 10 years
(4) Company's working capital requirements have reduced from 86.2 days to 40.3 days
(5) Fii & Dii have increased stake/s in the last 2-3 quarters
(6) It owns ~50% of all the music ever recorded in India
Valuations
(1) Market Cap โน 9,127 Cr
(2) Stock P/E 45.5
(3) ROCE 17.2 %
(4) ROE12.
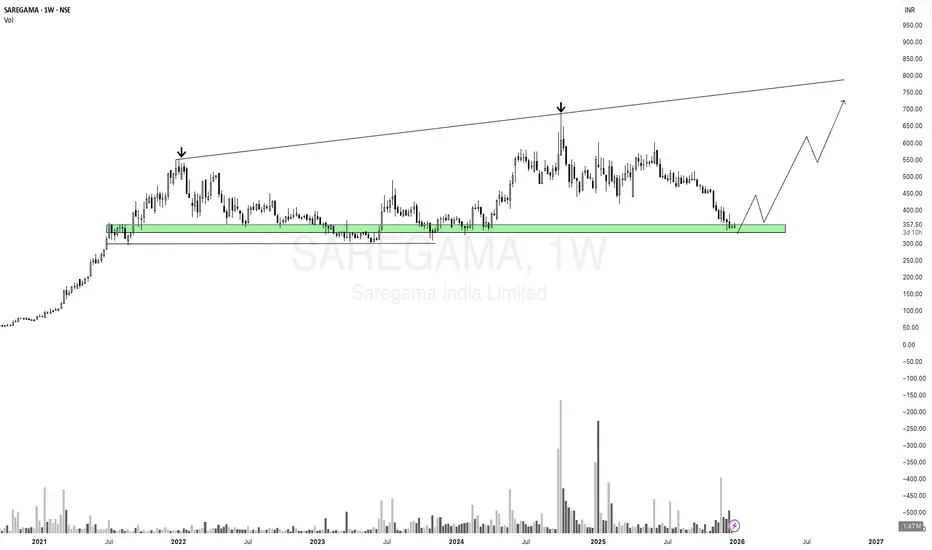
SAREGAMA: Can expect good upmove only if...1. It break the trendline on the upside.
2. Price is rejecting from the lower levels.
โ ๏ธ Disclaimer: This is NOT a buy/sell recommendation. This post is meant for learning purposes only. Views are personal. Please, do your due diligence before investing.โ ๏ธ
๐ฌ Drop your thoughts below in the comments section if you liked this analysis!โ๏ธ
๐ฅHappy trading!โ
๐
Amazing breakout on WEEKLY Timeframe - SAREGAMACheckout an amazing breakout happened in the stock in Weekly timeframe, macroscopically seen in Daily timeframe. Having a great favor that the stock might be bullish expecting a staggering returns of minimum 25% TGT. IMPORTANT BREAKOUT LEVELS ARE ALWAYS RESPECTED!
NOTE for learners: Place the breakout levels as per the chart shared and track it yourself to get amazed!!
#No complicated chart patterns
#No big big indicators
#No Excel sheet or number magics
TRADE IDEA: WAIT FOR THE STOCK TO BREA
STWP Stock Analysis: SaregamaโAn Attractive Opportunity for SwinThe stock market is full of surprises, and today we turn the spotlight on Saregamaโa stock that's gaining attention from both seasoned traders and newcomers. With a harmonious convergence of technical indicators suggesting a robust uptrend, Saregama seems primed for a potential breakout in the coming sessions. Letโs dive deeper into the details and explore why this stock is one to watch!
Why Saregama Is Gaining Traction: A Comprehensive Analysis1. Strong Bullish Indicators
Latest Tick - Bullis
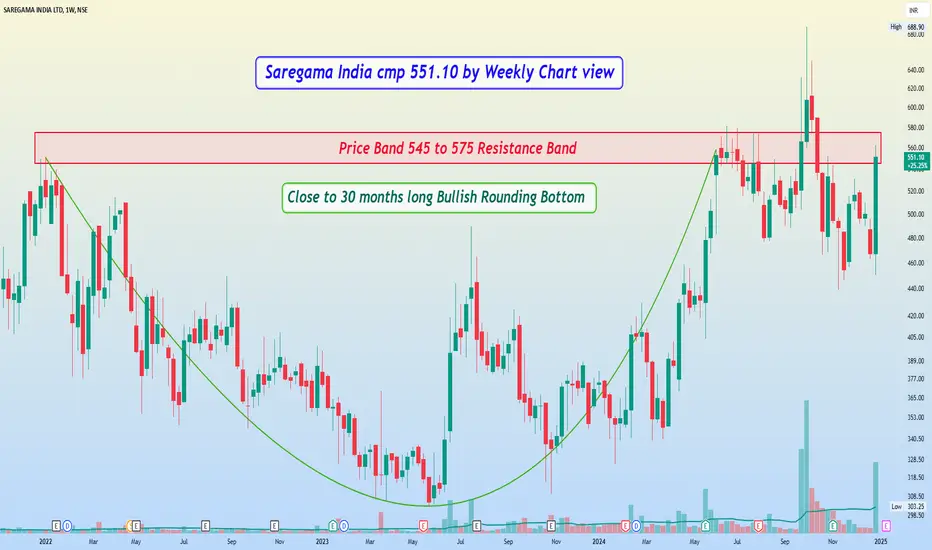
Saregama India cmp 551.10 by Weekly Chart viewSaregama India cmp 551.10 by Weekly Chart view
- Price Band 545 to 575 Resistance Band
- Close to 30 months long Bullish Rounding Bottom
- Stock Price is decently above EMA 20, 50, 100, 200
- Technical Indicators of MACD, RSI are seen getting positive
- Volumes spiked heavily last week indicating demand based buying
- Price closure above Resistance Zone with supportive Volumes would probably trigger a fresh breakout to go beyond ATH for creation of New Lifetime High Milestone
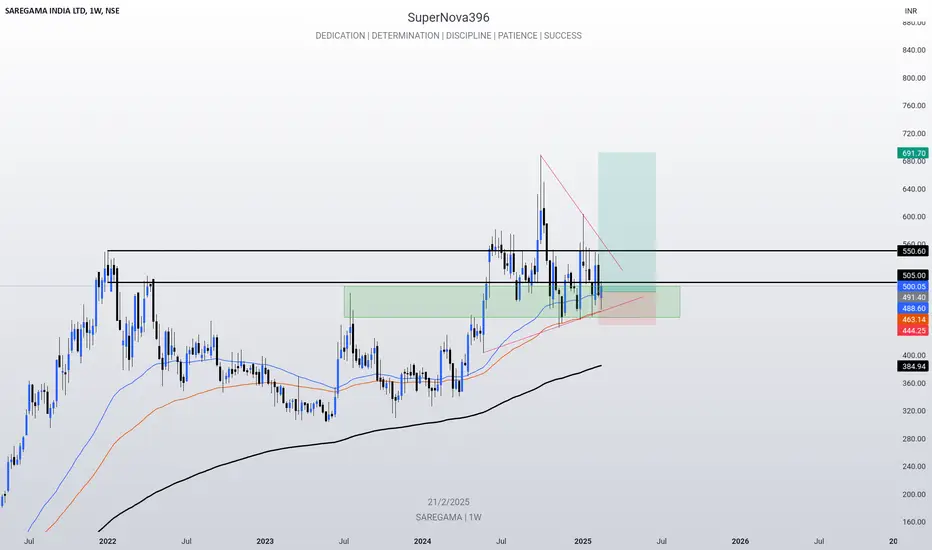
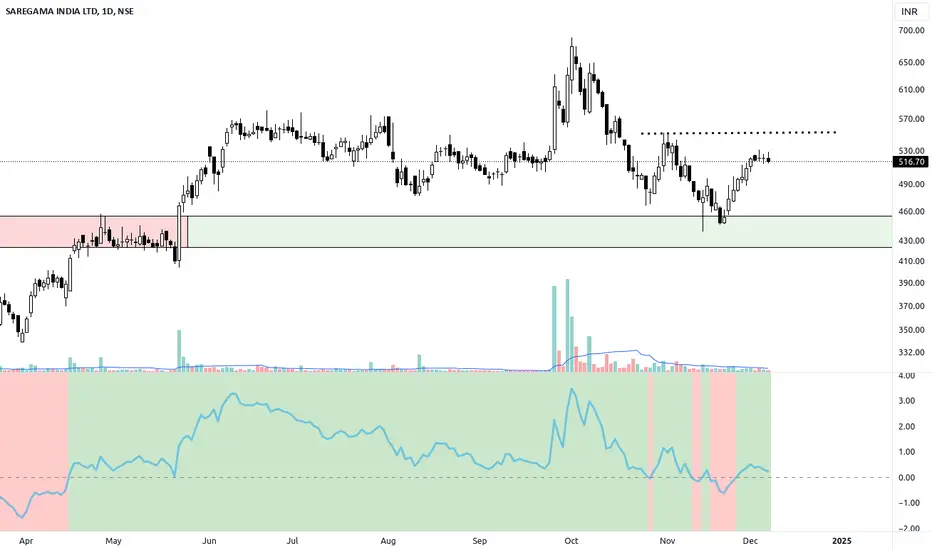
saregama- Potential Buy Setup#Saregama
The stock has bounced back from the supply-turned-demand zone on the weekly chart, indicating a potential reversal.
Before entering, waiting for confirmation of a Higher High above the dotted line on the daily chart.
Trade Details:
Entry: On BO and retest
Stop Loss: Below 439 on a closing basis
Saregama India Ltd. - Muhurat TradingWe're observing a potential round bottom pattern forming on the daily chart of Saregama India Ltd. This pattern often signifies a shift in trend momentum, potentially indicating a bullish breakout on the horizon. As we approach the neckline, a breakout above this level could pave the way for further upside. ๐
With Muhurat Trading around the corner, this could be a good opportunity to keep on the watchlist. A strong breakout confirmation above resistance may offer an ideal entry point.
Levels t
Can Expect 100% Return in Next 6 month NSE:SAREGAMA Hi guys, Today I will share a chart of Saregama which is near Breakout on daily chart so if we can get a strong breakout with a strong volume then we can expect huge upside momentum. I will share the first two target which I will expect that we can get in next one or two month. If i talk about from the fundamental perspective and the technical perspective we can expect that in the next 6 month this stock can give 100% return, from the last 2 years this stock in a consultation range
Parallel channel breakout with High VolumesNSE:SAREGAMA today broke its Parallel Channel with Heavy Volumes respecting 100 EMA and getting accumulated between 441 - 482 Zones on Daily Timeframe.
Disclaimer: This analysis is intended solely for informational and educational purposes and should not be interpreted as financial advice. It is advisable to consult a qualified financial advisor or conduct thorough research before making investment decisions.
SAREGAMA - Ichimoku Breakout๐ Stock Name - Saregama India Limited
๐ Ichimoku Cloud Setup:
1๏ธโฃ Today's close is above the Conversion Line.
2๏ธโฃ Future Kumo is Turning Bullish.
3๏ธโฃ Chikou span is slanting upwards.
All these parameters are shouting BULLISH at the Current Market Price and even more bullishness anticipated AFTER crossing 632.
๐จDisclaimer: This is not a Buy or Sell recommendation. It's for educational purposes and a guiding light to learn trading in the market.
#CloudTrading
#IchimokuCloud
#IchimokuFollowe
SAREGAMA๐ถ๐ ๐๐ฐ๐ฎ๐ป๐ป๐ฒ๐ฑ ๐๐ต๐ฟ๐ผ๐๐ด๐ต ๐ต๐๐ป๐ฑ๐ฟ๐ฒ๐ฑ๐ ๐ผ๐ณ ๐๐๐ผ๐ฐ๐ธ๐ ๐๐ผ ๐๐ต๐ฎ๐ ๐๐ผ๐ ๐ฑ๐ผ๐ป'๐ ๐ต๐ฎ๐๐ฒ ๐๐ผ๐ธ
Here are My Top 4 Breakout Picks
1. SAREGAMA
-reduced public holdings
-increasing sales YOY
-niche industry
saregama bearish butterflybearish butterfly formed and as per the fib retracement 38 % has fall done from the last high. This fall may create the bottom of the handle.
This analysis is my own idea.
I don't recommend taking trade based on this idea.
consult your SEBI registered adviser to Know the market risk before.
in.tradingview.com
Swing Momentum stock 15 feb 2024Saregama India Ltd |Swing Momentum stock 15 feb 2024
Saregama is the oldest music label company from India (established 1902, erstwhile "Gramophone Company of India" & then "HMV"). The company is aiming to be a pure-play content company supported by the global consumption boom.
financial: strong
Market Cap = โน 7,546 Cr. ROCE =17.6 % ROE = 12.8 %
Debt to equity= 0.00 Promoter holding = 59.1 %
Quick ratio = 3.48 Current ratio = 4.24
Profit Var 3Yrs = 58.8 % Sales growth 3Years =
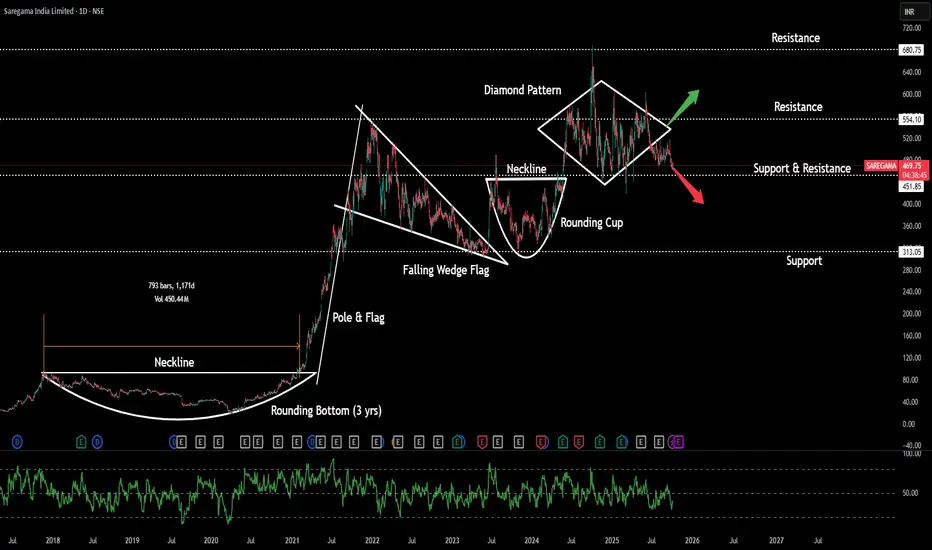
Saregama India pole and flag / cup and handle view- currently this stock is retracing parallel channel resistant level
- this retracement may create the handle of the cup
- this is weekly narrow range stock already breaks the R1
This analysis is my own idea.
I don't recommend taking trade based on this idea.
Know the market risk before trade.