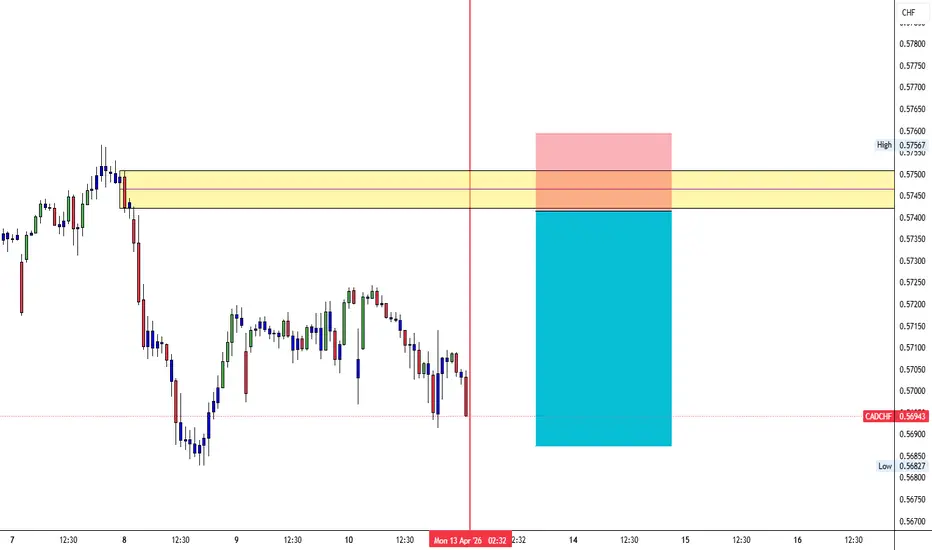
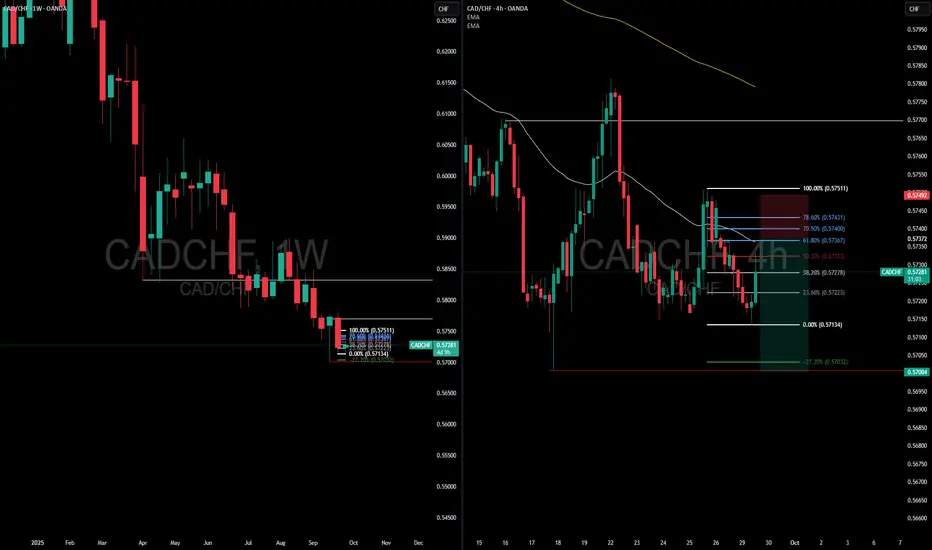
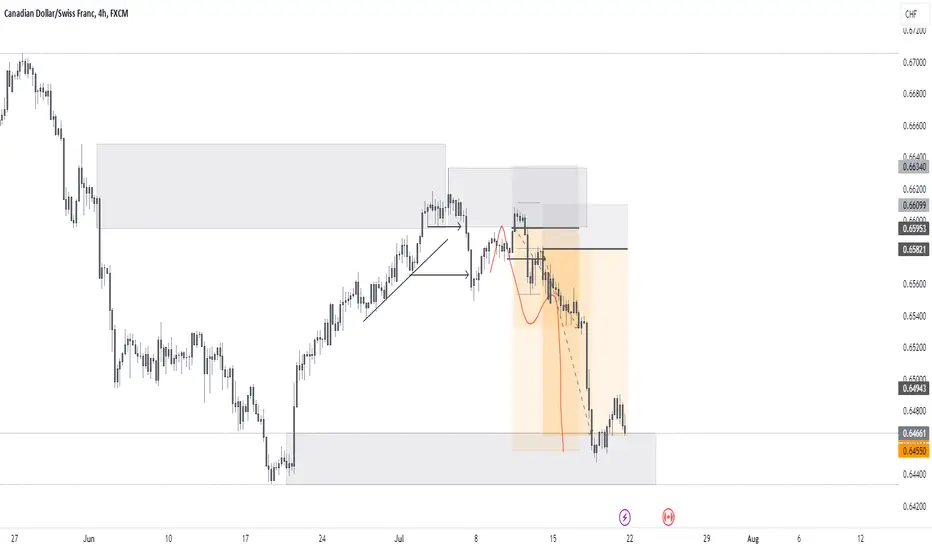
CADCHF TRADEEHere i have applied MS, LQ, and PROPER RISKMANEGEMENT, SO IM HOPING YOU APPLY YOUR OWN RISKMANAGEMNT HERE, it's a 1:5 rr trade, and my stategy have 40-50% win ratio, here also im targeting the gap up above and waiting for the OB to hit, and in daily timeframe if you see, it has moved down alot, so i think it will remain bullish for sometime, so with that all of that i have provided this trade, thank you and take care :)
CAD/CHF
No trades
No trades
In-depth trading ideas
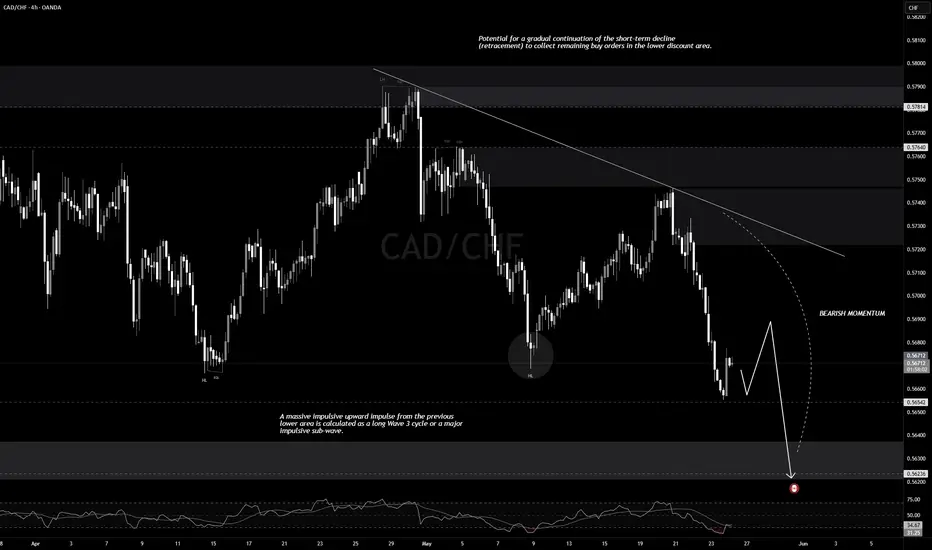
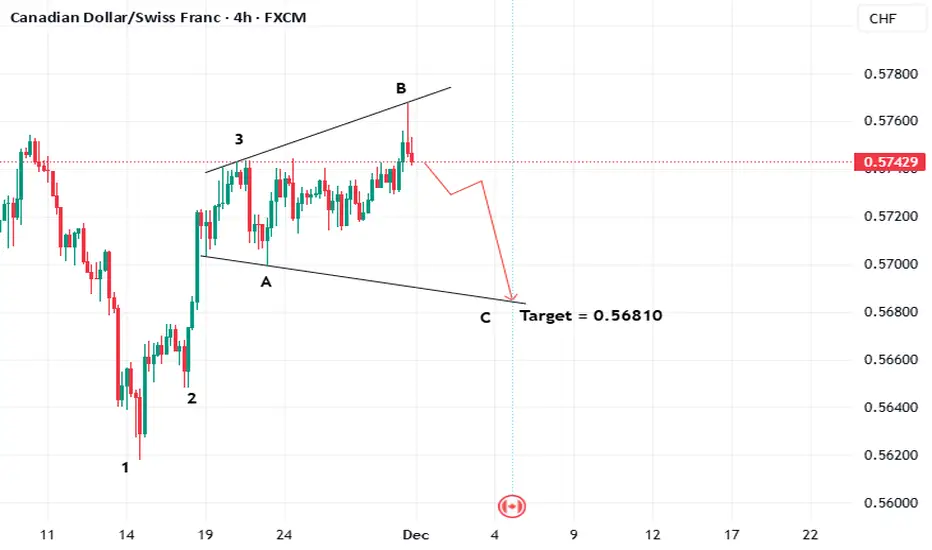
CAD/CHF Corrects Sharply and Will Continue to DeclineStructurally, the medium-term trend remains bullish. This trend is characterized by the price successfully breaking the structure (BOS) upward in several previous swings and forming a Higher High (HH), but the price is vulnerable to a short-term correction.
- 🔸Wave Structure: A massive impulsive upward impulse from the previous lower area is calculated as a long Wave 3 cycle or a major impulsive sub-wave.
- 🔸Current Status: The price at 0.56714 is likely in the early stages of Wave 4 (Correcti
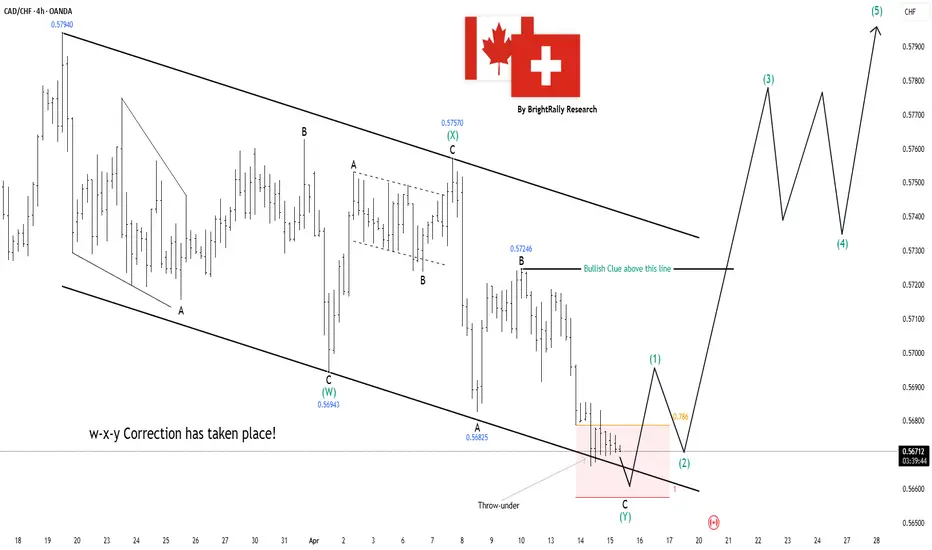
CADCHF: Bullish Setup After WXY CompletionCADCHF has likely finished its correction phase (called a W-X-Y in Elliott Wave), which basically means the market has already gone through a messy sideways/down move and may now be ready to trend. Price recently dipped below support (a fake breakdown) and quickly reacted, suggesting sellers are losing control.
Right now, the market is trying to form the first move up (Wave 1), but it’s not confirmed yet. For real strength, currency needs to break and hold above the marked resistance level. Bre
CADCHF at Supply ZoneCADCHF is currently reacting from a strong supply zone on HTF 💎
After a weak bullish retracement, price has entered a fresh supply area, indicating potential continuation to the downside.
🔍 Market Structure:
Bearish trend continuation
Weak pullback into supply
Fresh unmitigated supply zone
Sellers likely to dominate 📉
🎯 TRADE PLAN:
✅ Sell Entry: 0.5740 – 0.5755 zone
🛑 Stop Loss: 0.5768
🎯 Target 1: 0.5685
🎯 Target 2: 0.5650
🎯 Target 3: 0.5620 (previous demand zone)
⚡ Execution Tip:
Wait for L
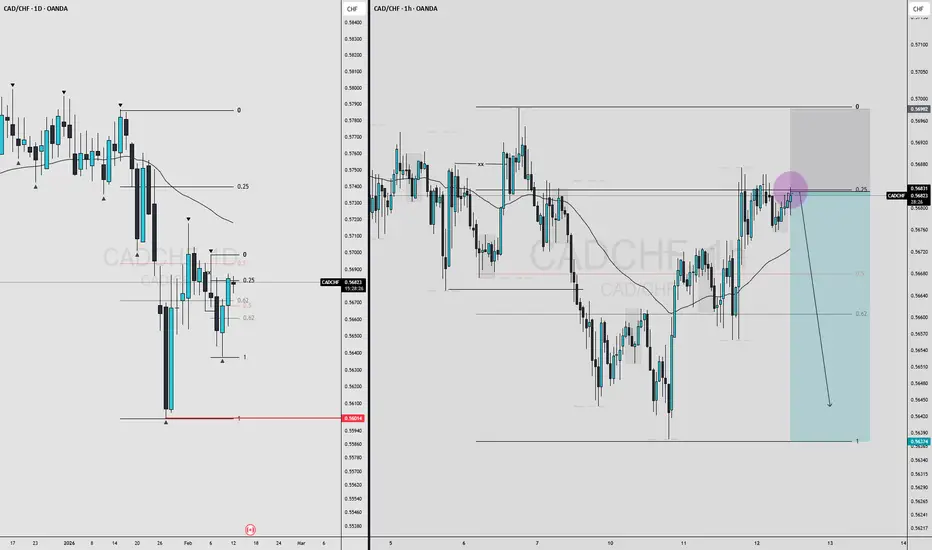
CADCHF-M15CAD/CHF has delivered a textbook sell-side liquidity raid beneath the Asian range, purging weak longs before staging an aggressive displacement higher. The reaction from the discount array suggests deliberate smart money activity, with price repricing toward equilibrium after leaving a clear imbalance in the wake of the impulsive markdown.
The current dealing range is defined by the recent swing high and the freshly engineered liquidity low near 0.56420. With price now trading back above the me
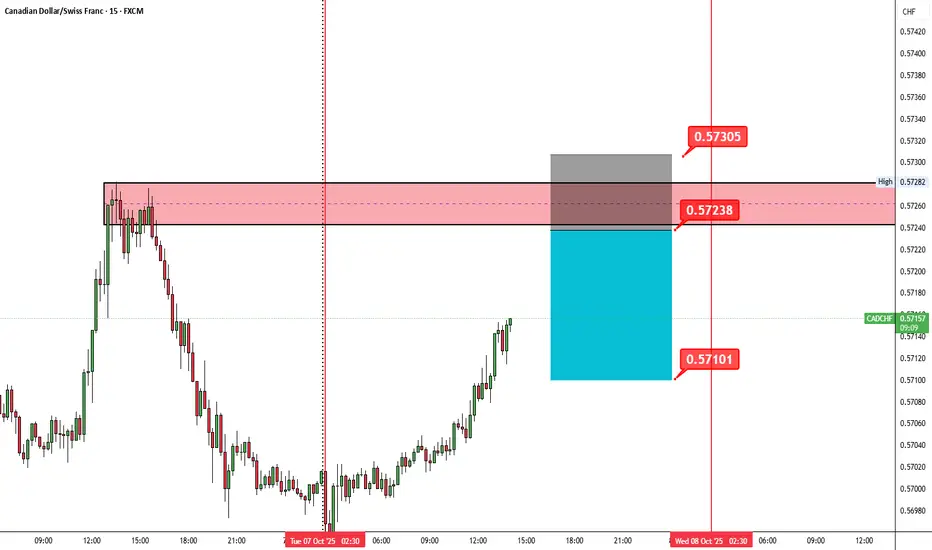
CADCHF SELL ENTRY – SUPPLY ZONE REJECTION🔻 CADCHF SELL ENTRY – SUPPLY ZONE REJECTION
📊 Timeframe: 15 Minutes
💡 Concept: Supply Zone | RBD Formation
Price is retesting a clear supply zone between 0.57238 – 0.57305,
Sellers previously dominated this level, and price is now approaching equilibrium — expecting a strong bearish reaction.
📍 Entry Zone: 0.57238 – 0.57305
🎯 Target: 0.57101
🛑 Stop Loss: Above 0.57310
🧠 Trade Idea: Watch for rejection candles or a lower timeframe structure break before short entry.
CADCHF MULTI TIME FRAME ANALYSISHello traders , here is the full multi time frame analysis for this stock , let me know in the comment section below if you have any questions , the position will be taken only if all rules of the strategies will be satisfied. wait for more price action to develop before taking any position. I suggest you keep this pair on your watchlist and see if the rules of your strategy are satisfied.
🧠💡 Share your unique analysis, thoughts, and ideas in the comments section below. I'm excited to hear your
cadchfPrice action trading is a methodology in financial markets where traders make decisions based on the actual price movements of an asset over time, rather than relying heavily on technical indicators or fundamental analysis. It involves observing and interpreting patterns and trends in price charts to predict future price movements.
CAD/CHF Technical Analysis – Bullish Reversal from Key Support ZCAD/CHF Technical Analysis – Bullish Reversal from Key Support Zone 🟢📈
📅 Date: June 1, 2025
📊 Pair: CAD/CHF
🕰️ Timeframe: Daily (D1)
📌 Key Observations:
🟩 Strong Support Zone (0.5900 - 0.5950):
Price has consistently respected this demand zone since early May.
Multiple bullish rejections (green arrows) indicate strong buying interest.
📉 Previous Downtrend:
The market was in a clear bearish trend from February through April, forming lower highs and lower lows (red arrows mark swing highs).
CadChf BEARISHLiquidity on the sell side as marked by oval blue shaped below //or some people called it strong support .
Entry point is the green line .
SL is upto your desire .
Tp are marked as green line on sell side .// So it's a sell limit.
🔵Hey guys ucan follow me ,I will keep uploading like this whenever I see good markets , so we can keep in touch and help u in your trading journey
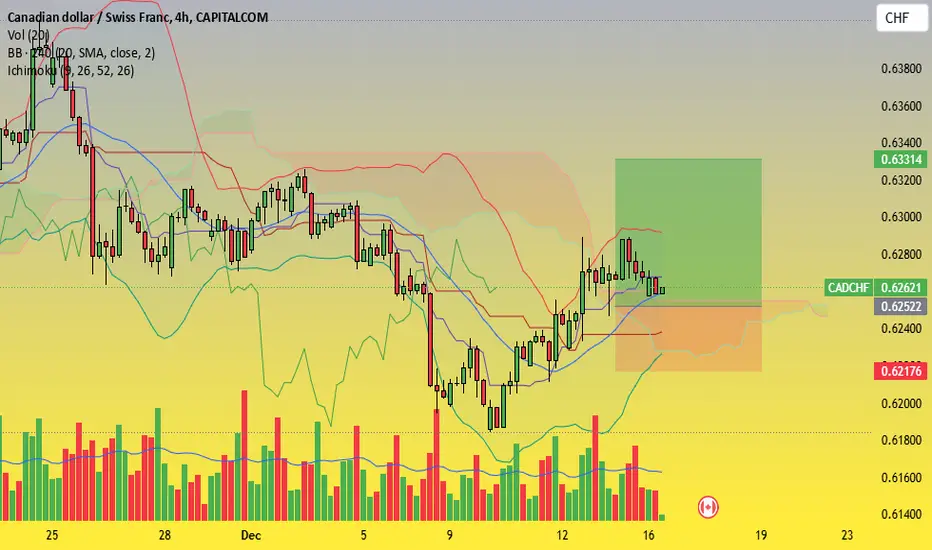
Analysis and Trading Strategy for Buying CAD/CHF
Hello everyone, today I’m sharing a trading strategy to buy the CAD/CHF currency pair based on technical analysis.
Technical Analysis:
Current Price: CAD/CHF is currently trading at 0.62603, near the key support level of 0.62522 and resistance at 0.63314. This consolidation zone presents a strong opportunity to enter a buy position.
Bollinger Bands: The Bollinger Bands are expanding, signaling the potential continuation of the current trend or a breakout. The price is trading near the midl
CADCHF - SWING TRADE ON LONG SIDE FOR HUGE PROFITSymbol - CADCHF
CADCHF is currently trading at 0.63500
I'm seeing a trading opportunity on buy side.
Buying CADCHF pair at CMP 0.63500
I will be adding more if 0.63200 comes & will hold with SL of 0.62900
Targets I'm expecting are 0.64700 - 0.65350
Disclaimer - Do not consider this as a buy/sell recommendation. I'm sharing my analysis & my trading position. You can track it for educational purposes. Thanks!
CADCHFBeautiful trade setup, very nice and easy to understand. I posted it in video analysis. However I must be honest with you, I did not get into this trade as I was satisfied with my EurAud position. Let me explain what happened, so as you can see we are trading high in the market and into one sell zone. Price is struggling to continue higher and it was consolidating for a while. I wanted to see the break of that so-called trendline and, if not, a structure point break. Look good at the picture and