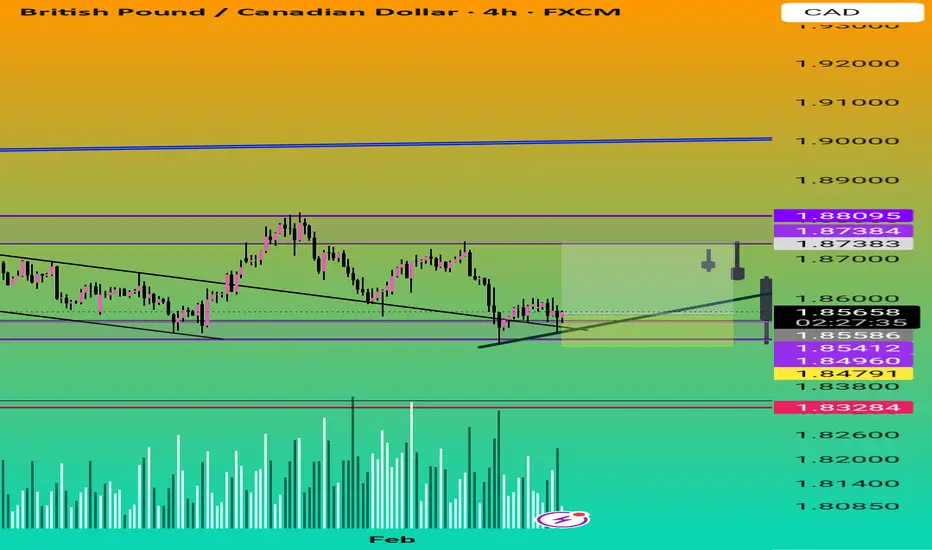
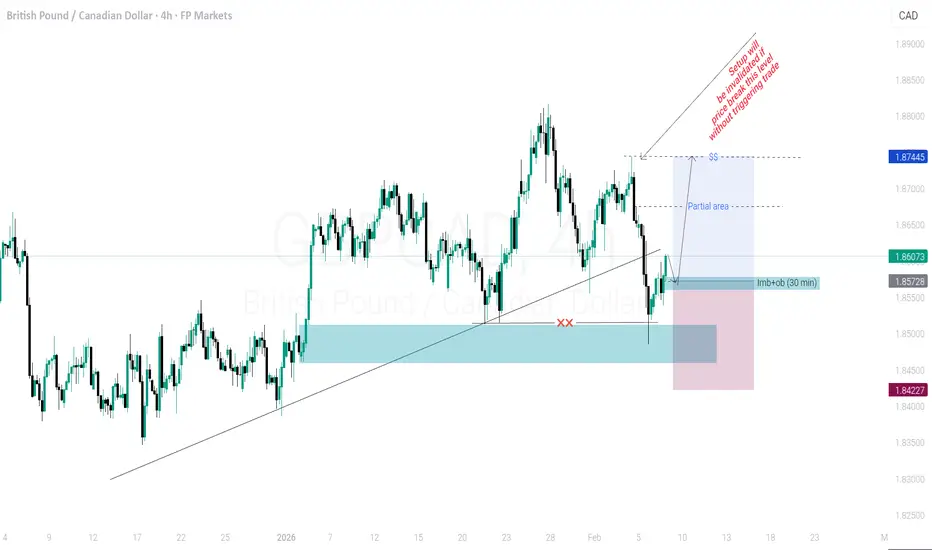
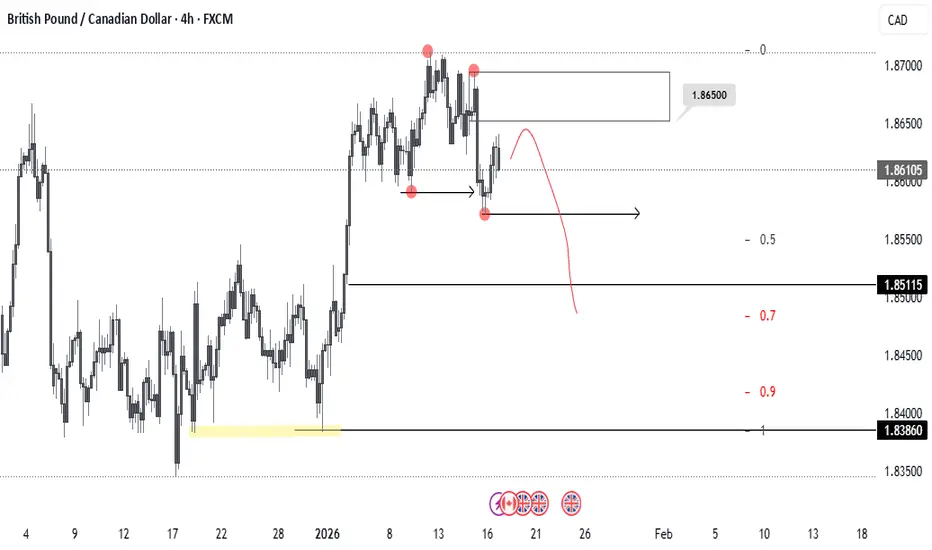
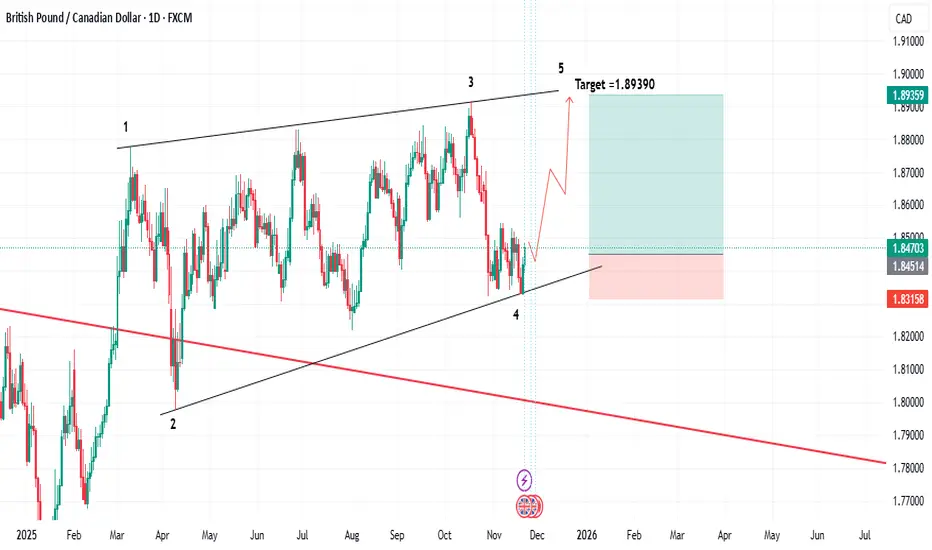
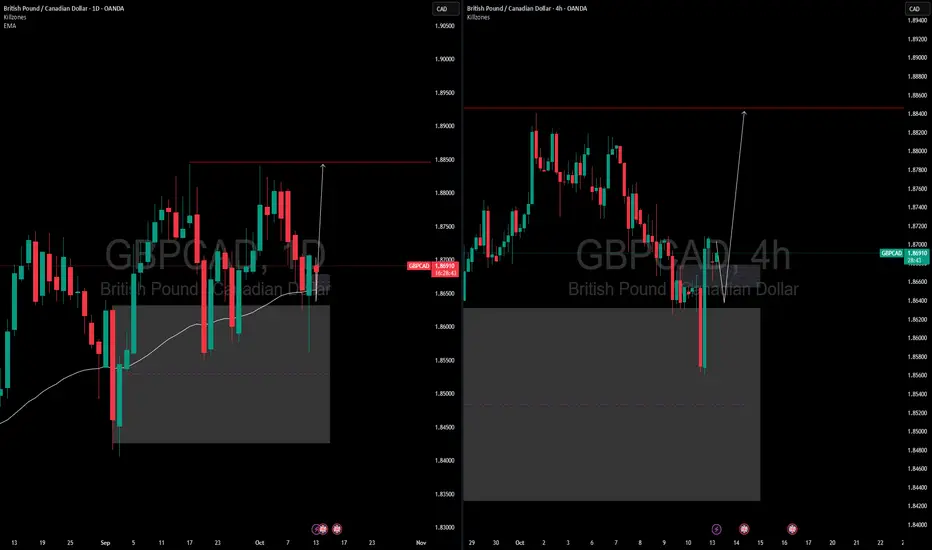
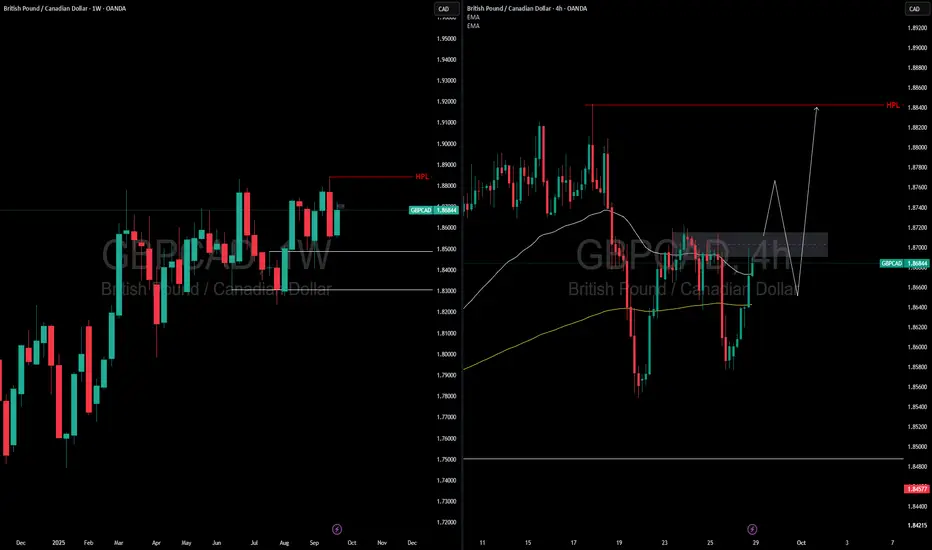
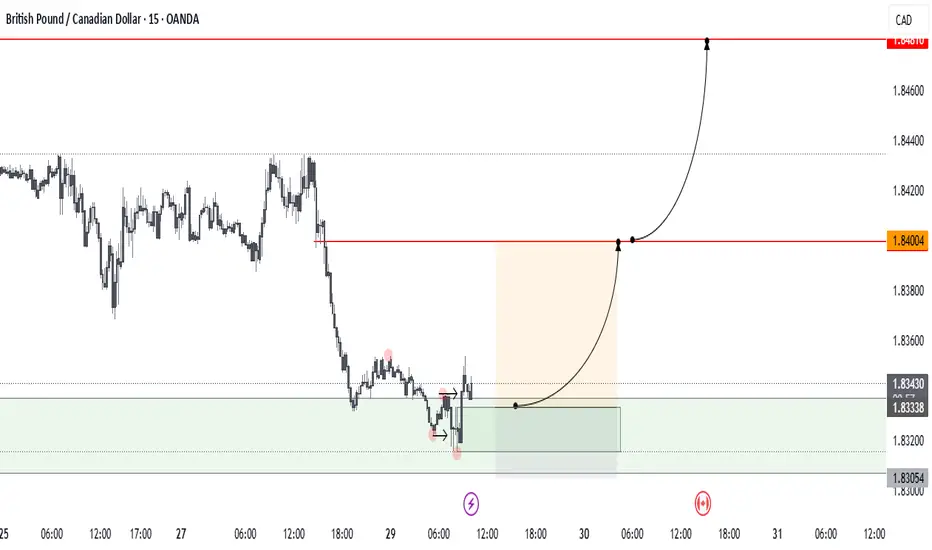
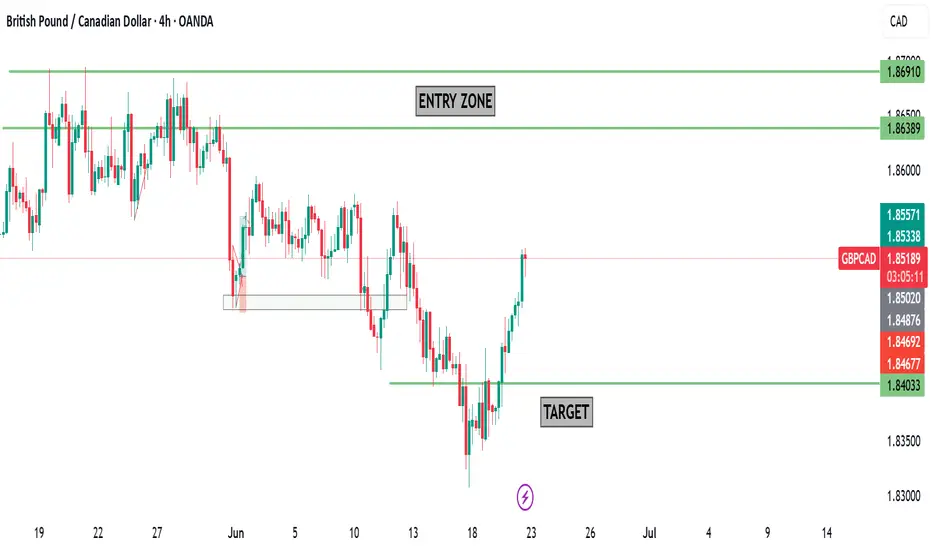
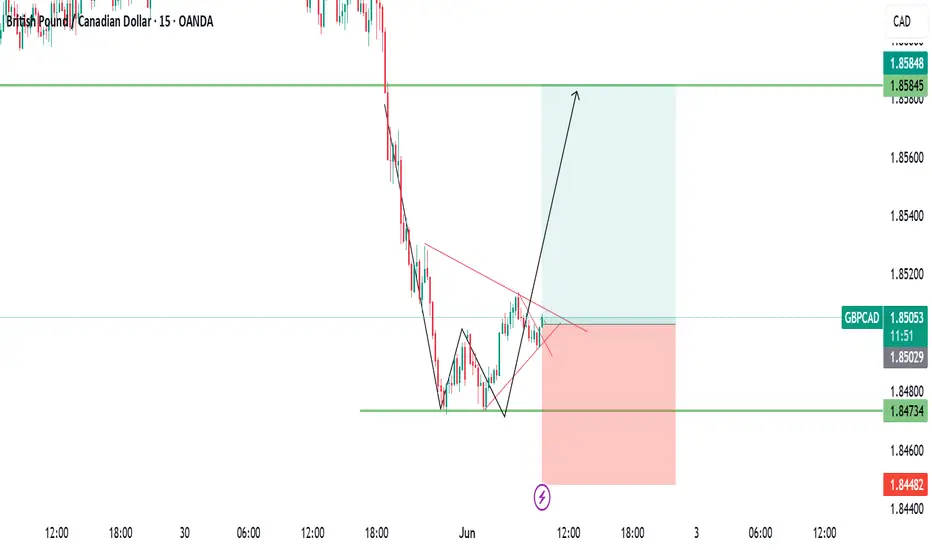
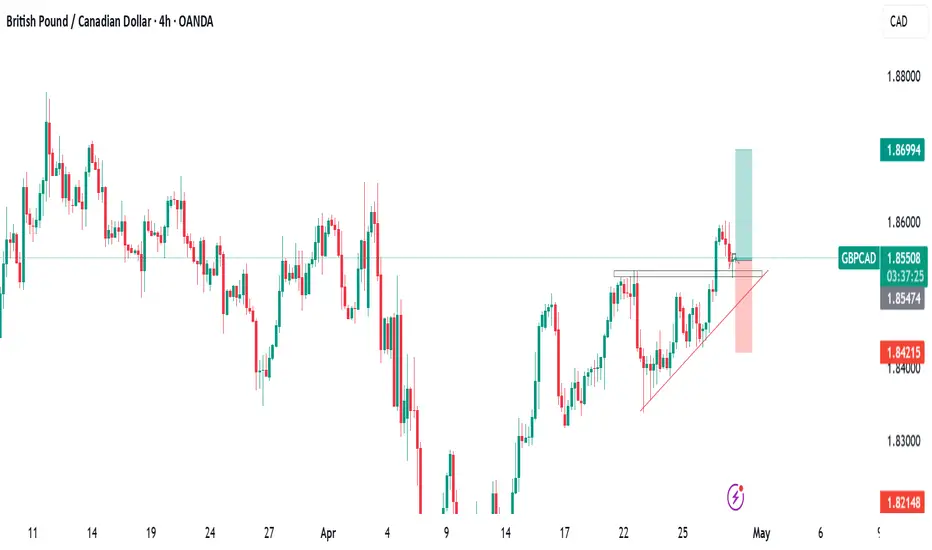
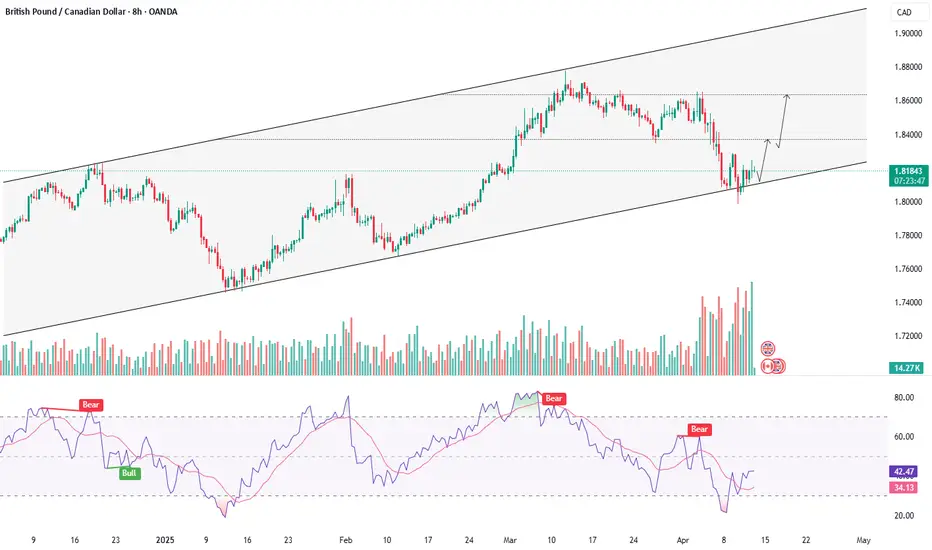
GBPCAD Continuation SetupIn GBPCAD, I can currently spot a strong continuation setup on the daily timeframe. Price is reacting cleanly from the 10–20 EMA zone, and the overall structure remains bullish. Price is trading above the 50 EMA, as well as above the 10 and 20 EMA, which confirms higher timeframe bullish strength. At the same time, price is also bouncing directly from the 10–20 EMA region, making the setup technically clean for possible continuation towards the upside.
Another important factor is that this EMA
British Pound / Canadian Dollar
No trades
No trades
In-depth trading ideas
Bearish Descending Channel🧭 Overview
The chart highlights a clear bearish Descending channel defined by a consistent sequence of Lower Highs (LH) and Lower Lows (LL). This pattern reflects sustained selling pressure and confirms that sellers remain in control of the broader trend.
⸻⸻⸻⸻⸻⸻⸻⸻⸻⸻⸻
📘Concept
• Each rally forms a Lower High (LH) → When price moves up, it fails to break the previous high. This shows buyers are weak and unable to regain control.
• Each decline forms a Lower Low (LL) → When price drops, it b
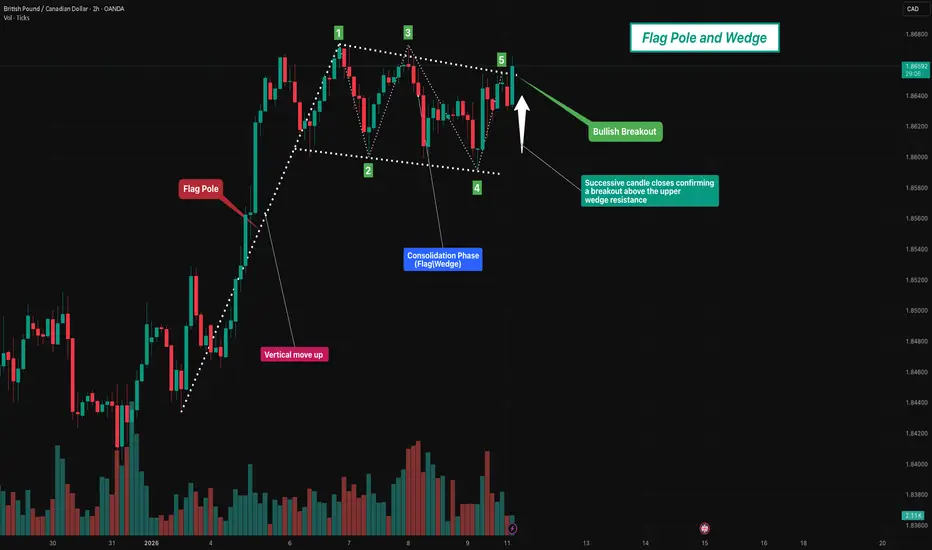
Flag pole and Wedge🧭 Overview
The chart illustrates a strong bullish impulse followed by a descending wedge formation, a well-known trend continuation structure.
After a sharp upward move (flag pole), price enters a controlled pullback where volatility contracts, forming lower highs and slightly lower or stable lows.
This setup represents a healthy pause in the trend, indicating accumulation and preparation for a potential bullish continuation.
⸻⸻⸻⸻⸻⸻⸻⸻⸻⸻⸻⸻⸻
📊 Chart Observations
1. The initial move shows
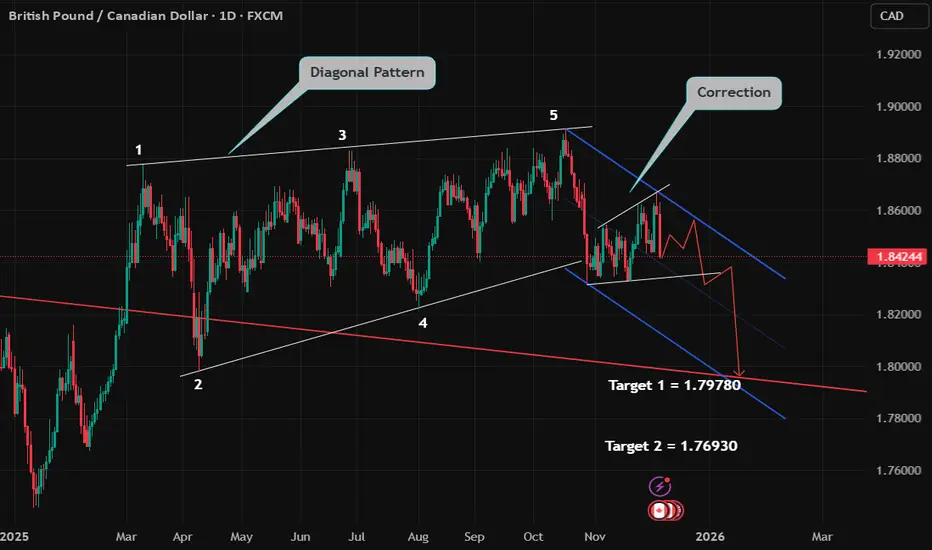
GBP/CAD New UpdateLooks like GBP/CAD in heavy selling pressure after the Fundamental event for CAD on last week.
Earlier Thought process was 5th wave in the Diagonal pattern was not completed, but after the fundamental news, the pattern structure changed, now it seems there's an correction running for an start of another impulse with an Target1 and Target 2 mentioned in the Chart.
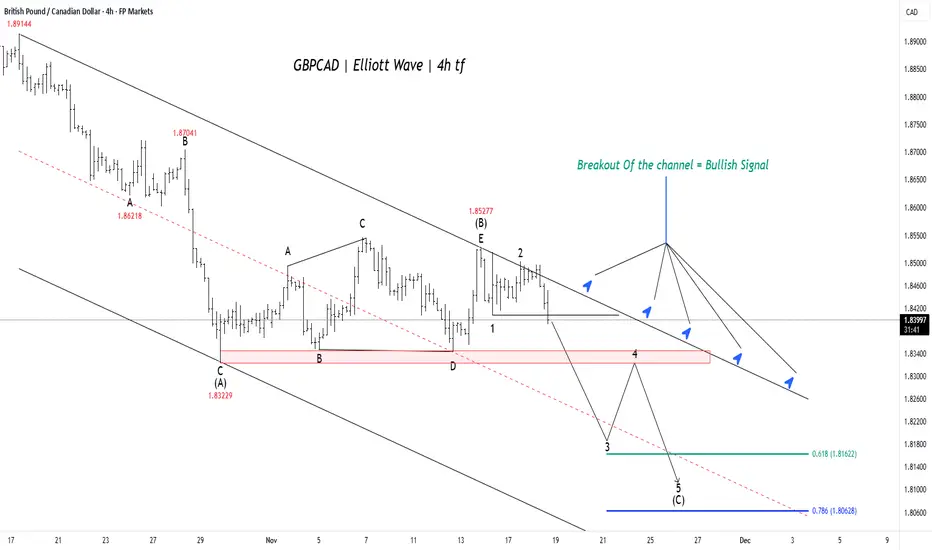
GBPCAD: Final Drop to Key Support Before Major ReversalThe wave Principle strongly suggests the currency pair is currently in the final stages of a large decline, which is expected to precede a major, sustained upward move.
Completion of Correction: The pair has recently completed a complex, sideways corrective pattern (such as a triangle or flat), marking the start of the final downward push.
Final Downward Leg: This ultimate decline, labeled wave (C), is now underway and is projected to drive the price into a critical support zone.
Target
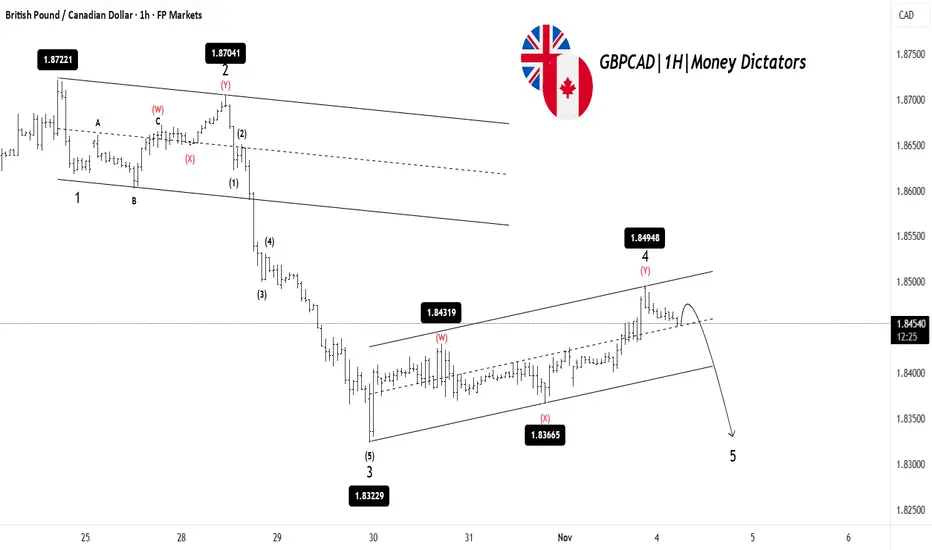
GBPCAD: Bears Ready to Push Into Wave 5GBPCAD has completed a clear 1-2-3 move to the downside, followed by a corrective Wave 4 that has pushed the price higher inside a rising channel. This correction now looks nearly complete, as the price is struggling to break above the resistance. Once Wave 4 is finished, the chart suggests a final drop into Wave 5 toward the lower support zone. That would complete the overall bearish structure before any larger reversal can happen. In simple terms: correction is almost done → one more leg down
GBPCAD MULTI TIME FRAME ANALYSISHello traders , here is the full multi time frame analysis for this pair, let me know in the comment section below if you have any questions , the entry will be taken only if all rules of the strategies will be satisfied. wait for more price action to develop before taking any position. I suggest you keep this pair on your watchlist and see if the rules of your strategy are satisfied.
🧠💡 Share your unique analysis, thoughts, and ideas in the comments section below. I'm excited to hear your pers
GBPCAD MULTI TIME FRAME ANALYSISHello traders , here is the full multi time frame analysis for this stock , let me know in the comment section below if you have any questions , the position will be taken only if all rules of the strategies will be satisfied. wait for more price action to develop before taking any position. I suggest you keep this pair on your watchlist and see if the rules of your strategy are satisfied.
🧠💡 Share your unique analysis, thoughts, and ideas in the comments section below. I'm excited to hear your
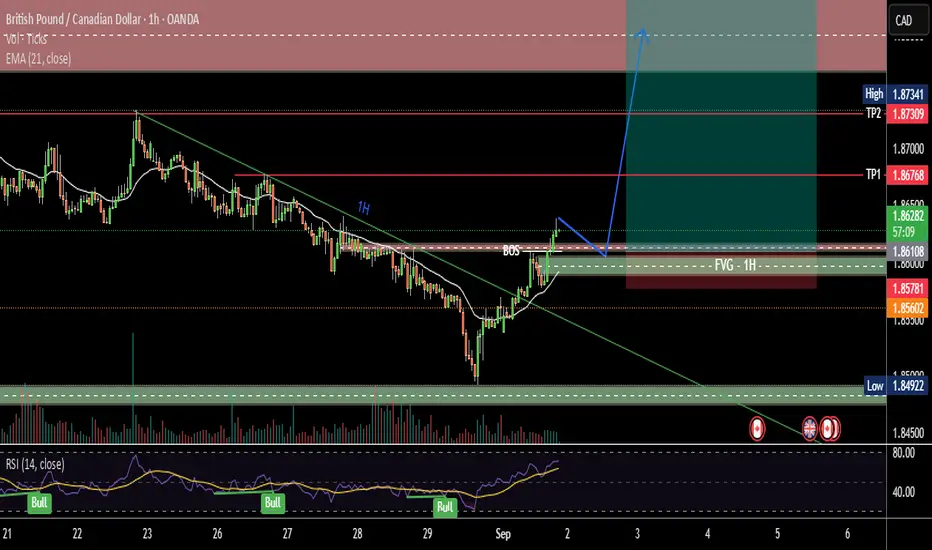
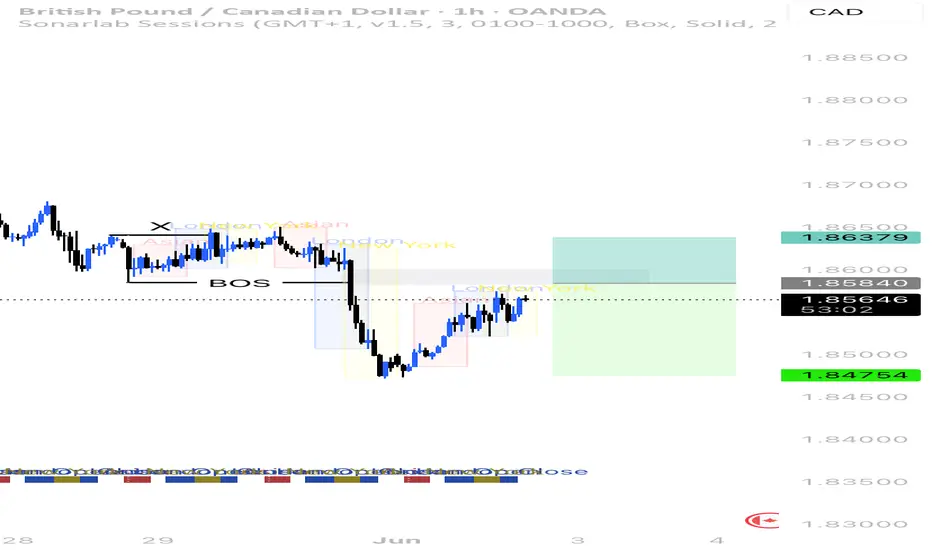
1:7 RnR trade opportunity on GBPCADGBPCAD is forming a great price action and scenario. Which may lead to high risk and reward trade. Below are the signals noticed ...
1. Price has broken 10 days’ consolidation of trend line and nearby resistance as well.
2. Created BOS and FVG on 1-hour time frame in discount area.
3. Price is running above VWAP and 21 EMA. And 21 EMA crossing over VWAP.
4. Now we can expect a pullback till FVG area.
All these combinations are signalling a high probability and high RnR (1:7) trade scenario.
GBPCAD - BUYSHello traders, welcome to another market breakdown.
Today, I’m focusing on GBPCAD with a bullish outlook. On the daily chart, the pair is clearly trending upwards. Recently, price retraced into a daily demand zone and has since shown a bullish structure flip, suggesting a potential continuation of the uptrend.
We have clear upside targets in alignment with the prevailing trend. A conservative stop-loss can be placed just below the daily demand zone—if that level gets taken out, it may indicate
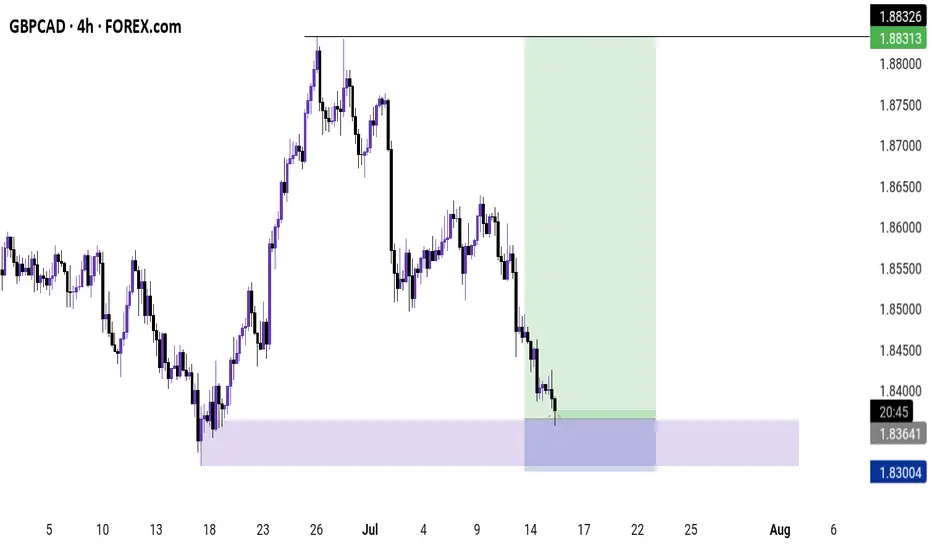
GBPCAD POTENTIAL FOR THE UPSIDELooking at GBPCAD, currently looking to take long positions on the current retest of the daily demand zone which also confluences with the retest of the recently formed 4h and 1h demand zones.Use the lower timeframes to confirm the move and use proper risk management should you decide to join me
GBP/CAD ANALYSISPrice action trading is a methodology in financial markets where traders make decisions based on the actual price movements of an asset over time, rather than relying heavily on technical indicators or fundamental analysis. It involves observing and interpreting patterns and trends in price charts to predict future price movements.
GBPCADPrice action trading is a methodology in financial markets where traders make decisions based on the actual price movements of an asset over time, rather than relying heavily on technical indicators or fundamental analysis. It involves observing and interpreting patterns and trends in price charts to predict future price movements.
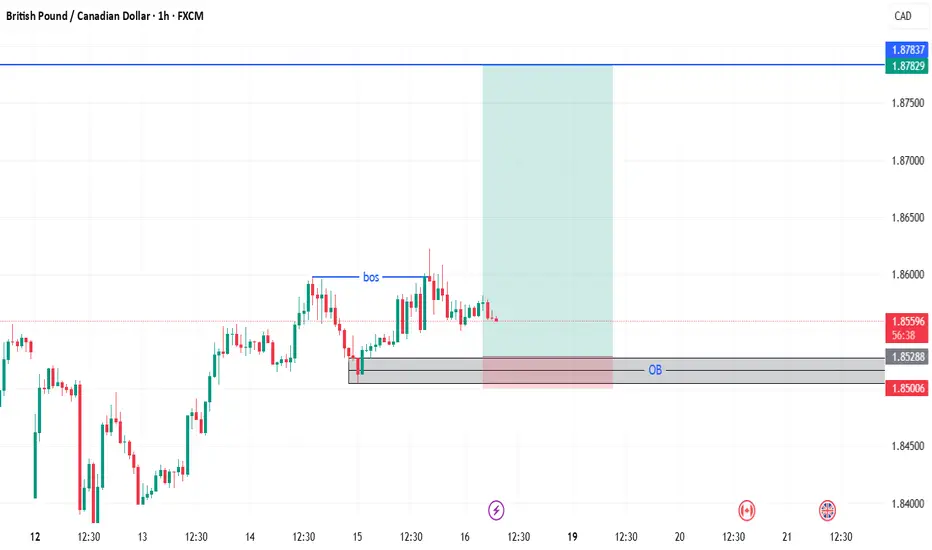
ICTHello, I am a Forex hunter and I am analyzing the GBPCAD symbol. We have an upward trend on this symbol. In this upward trend, the last bearish candle that was able to break its previous high is an important block order, and we can have the possibility of price support in this area and set our trading target at the last high.
GBPCADPrice action trading is a methodology where traders make decisions based on the interpretation of actual price movements on a chart, rather than relying primarily on lagging indicators. It involves observing and analyzing candlestick patterns, trend lines, support and resistance levels, and volume to identify potential trading opportunities and manage risk. The focus is on understanding the story the market is telling through its price behavior.
GBPCAD - FALSE BREAKDOWN SIGNALS MORE UPSIDESymbol - GBPCAD
CMP - 1.8150
The GBPCAD pair is currently exhibiting a false breakdown of its trend support. In the context of a weakening US dollar, the British pound has entered a rally phase, which is advantageous for the currency pair.
Fundamentally, the outlook is favorable for both the GBP & CAD, given the ongoing depreciation of the dollar. During the current corrective phase, the pair is testing support levels without the potential for further downward movement. This correction is lik
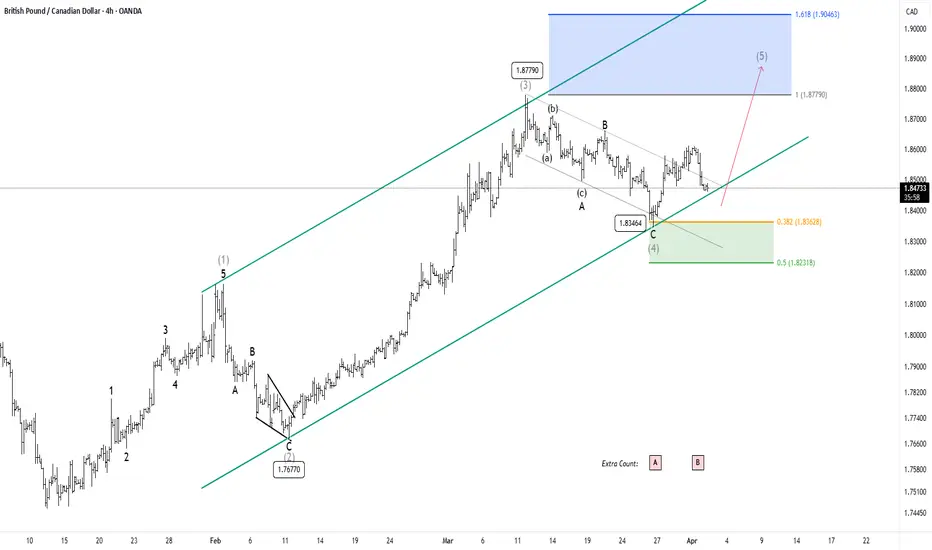
GBPCAD - Is Bullish Breakout Ahead?TF: 4h
GBPCAD is initiating along opportunity by completing 4th intermediate wave at 1.83464 . We can expect a retracement then reversal with near the lower trendline of the parallel channel.
Once price comes down, we will have the opportunity to go long with minimum stop level at low of the wave 4 at 1.83640 . The bullish scenario is capable GBPCAD to provide 1.8654 - 1.8748 targets to the buyers.
If the breakdown occurs, wave (4) will go deep. We update this chart time to time. Traders