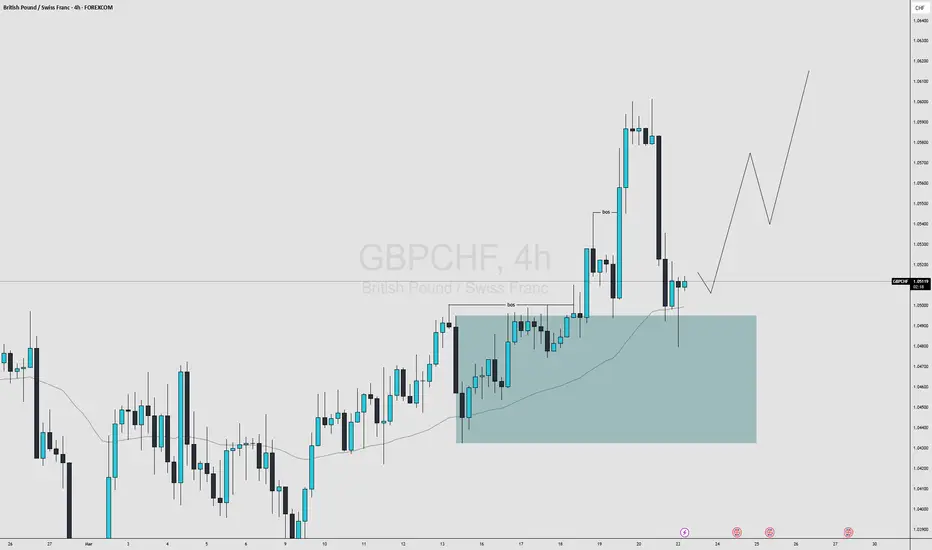
GBP/CHF Attempts to Rise Towards Nearest ResistanceOn the 4-hour timeframe, GBPCHF is showing signs of a shift in momentum, with buyers attempting to take control of the market.
- ⚡Market Structure: The short- to medium-term trend is shifting towards a bullish accumulation phase. The price has successfully broken the previous downward structure by forming a Higher Low (HL) below, and is currently moving upward, testing the upper limit of the structure.
- ⚡Price Action: Around the current price (1.06474), the price is moving quite impulsively, dominated by healthy bullish candles. However, this movement is starting to hit the nearest Major Supply Zone (grey box above) in the 1.06600-1.06900 range. A thin upper wick is beginning to appear, indicating initial resistance from sellers in this premium area.
---------------------------------------------------------------
Key Zones:
- ⚡Resistance/Supply: 1.06700 - 1.07000 (Main line of defense for sellers and determining the continuation of the breakout).
- ⚡Support/Demand: 1.05600 - 1.05900 (Strong demand zone that served as the initial foothold for the last upward impulse).
---------------------------------------------------------------
✅ Elliott Wave Analysis
If we map this movement based on the Elliott wave cycle on the H4 timeframe:
- ⚡Wave Structure: The sharp recovery from the lowest price level appears to be the completion of a major corrective phase, and the market is now projected to begin a new impulsive upward cycle (Wave 1 or the beginning of a micro Wave 3).
- ⚡Current Status: Given that the price of 1.06474 is very close to the Supply resistance ceiling, this upward impulse will likely soon reach its short-term saturation point. In theory, the market will require an internal corrective wave phase (a "breathing" or pullback phase) to balance the order book before gathering new strength.
- ⚡Projection: Potential for a healthy short-term downward correction to test the Support Become Resistance (SBR) area below before readying for further upward expansion.
-------------------------------------------------------------------
The main bias for GBPCHF on the H4 timeframe is bullish.
However, tactically, for the next few candles, the next price movement is projected to move downward first (correction/pullback) towards the 1.05950-1.06150 area before eventually bouncing back to resume its uptrend.
British Pound / Swiss Franc
No trades
No trades
In-depth trading ideas
GBPCHF: Trend Shift UnderwayGBP/CHF appears to be forming a major bottom after completing a long corrective decline near 1.0290 . The chart suggests the pair may have finished a five-wave bearish structure, signaling a possible shift toward a new bullish cycle. Price is now attempting to stabilize above 1.0500, while recent buying pressure shows momentum is gradually improving. The first bullish confirmation level stands at 1.0800 , and a sustained breakout above it could trigger a stronger recovery phase. This is only a breakout setup.
The projected upside targets are 1.1075, 1.1065, and 1.1426 in the medium term. On the downside, 1.0290 remains the key support and the main invalidation level for the bullish outlook. As long as the price holds above that low, the broader structure favors recovery rather than continuation of the previous downtrend.
We will update further information soon.
@BrightRally_Research
GBP/CHF Downward Potential Quite ClearOn the 4-hour timeframe, GBP/CHF is showing clear signs of selling exhaustion.
- ⚡Market Structure: The medium-term trend remains bearish, but the downward momentum is starting to slow. The price is currently firmly anchored in the Major Demand Zone (lower gray box) between 1.05000 and 1.05500.
- ⚡Price Action: A minor double bottom is forming in the demand zone. The appearance of several candles with long lower wicks (wick rejections) at 1.05430 indicates that buyers are starting to accumulate positions to defend the psychological level of 1.05000.
✅ Key Zones:
- ⚡Resistance: 1.06200 (Supply Area / Last Lower High).
- ⚡Support: 1.05000 (Psychological Floor / Major Demand).
In terms of the wave cycle, GBP/CHF appears to be completing the final phase of a long downtrend:
- ⚡Wave Structure: The decline from 1.09000 appears to be completing the Wave 5 structure.
- ⚡Current Status: Since the price is already in an area of very strong demand and the RSI momentum is starting to show bullish divergence (price forming a LL, indicator forming a HL), there is a strong indication that Wave 5 is nearing its end or has reached its peak (ending diagonal).
- ⚡Projection: After Wave 5 is complete, the market will theoretically begin a reversal phase leading to Corrective Wave A with the first upside target towards the 1.07500 area.
The main bias for GBP/CHF is currently neutral, tending towards bullish for the medium term. Although the major trend remains down, selling at 1.05430 is very risky because the downward "room" is very limited and is at the end of the Elliott wave.
GBPCHF Multi Time-Frame Analysis Hello traders , here is the full multi time frame analysis for this pair, let me know in the comment section below if you have any questions , the entry will be taken only if all rules of the strategies will be satisfied. wait for more price action to develop before taking any position. I suggest you keep this pair on your watchlist and see if the rules of your strategy are satisfied.
Ascending Channel🔎 Overview
Price is moving inside a well-defined Ascending Channel, showing a strong and structured uptrend.
The market continues to form Higher Highs (HH) and Higher Lows (HL), confirming consistent buying pressure.
The channel provides clear dynamic support and resistance, helping identify potential reversal and continuation zones.
------------------------------------------------------------
📊 Chart Explanation
1️⃣ Higher Highs (HH)
Each new peak rises above the previous one, showing strong bullish momentum.
2️⃣ b]Higher Lows (HL)
Pullbacks consistently find support at higher levels, confirming buyers are stepping in early.
3️⃣ Upper Trendline (Dynamic Resistance)
Price repeatedly reacts from this line and faces rejection — marking short-term overbought areas.
4️⃣ Lower Trendline (Dynamic Support)
Price bounces from this rising support line, validating it as a demand zone where buyers regain control.
5️⃣ Price Movement Inside the Channel
Price is trending upward by respecting the structure — bouncing from HL (support) and aiming for HH (resistance).
6️⃣ Overall Momentum
The series of HH + HL indicates strong, continuous uptrend momentum within the channel.
------------------------------------------------------------
📝 Summary
• A clean Ascending Channel is in place.
• HH and HL sequences confirm bullish structure.
• Buyers defend the lower trendline; sellers react on the upper trendline.
• Until the lower boundary breaks, the market bias remains bullish.
------------------------------------------------------------
⚠️ Disclaimer
📘 For educational purposes only.
🙅 Not SEBI registered.
❌ Not a buy/sell recommendation.
🧠 Purely a learning resource.
📊 Not Financial Advice
GBPCHFPrice Action Trading is a method of financial market analysis where traders make buying and selling decisions solely based on the asset's price movements over time, without relying on technical indicators.
It's essentially the art of reading a "naked" or clean chart to understand the psychology and behavior of market participants.
GBPCHF - CORRECTION NEAR EXHAUSTION?Symbol - GBPCHF
GBPCHF continues its corrective move, forming lower lows amid ongoing macroeconomic uncertainty and concerns related to US policy. GBPCHF remains within a bearish structure but is now approaching a key demand zone around 1.0555 – 1.0530, where buying interest could potentially emerge.
Despite the prevailing downside momentum, the pair is nearing an area that could attract bullish participation. If buyers manage to defend this demand zone, a meaningful rebound from these levels may follow.
Resistance levels: 1.0600, 1.0647, 1.0685
Support levels: 1.0560, 1.0535
If the price fails to hold above the current support and liquidity zone shown on the chart, another wave of selling pressure could develop. However, given the broader market context, the likelihood of a deeper decline appears limited.
GBP/CHF | 1H AnalysisPrice has recently swept liquidity beneath the previous low and reacted from a demand zone within the overall bullish structure.
A lower timeframe break of structure confirms potential short-term bullish momentum.
Currently, price is consolidating near the entry zone, with a favorable risk-to-reward setup targeting the previous supply area.
Entry: 1.0605
Stop Loss: 1.0579 (below structural low)
Take Profit: 1.0658 (previous supply / liquidity area)
Bias: Short-term bullish continuation
If price maintains structure and holds above the mitigation zone, further upside expansion is anticipated.
GBPCHF – Bearish Setup (H2 Chart)📊 GBPCHF – Bearish Setup (H2 Chart)
Pair: GBPCHF
Timeframe: 2H
Bias: Short Position
🔎 Market Context:
GBPCHF is retesting a resistance zone (1.07389 – 1.07902).
The pair has been struggling to push higher, indicating selling pressure in this zone.
If rejection continues, a bearish move is expected toward lower support levels.
📌 Trade Plan:
Entry Zone: 1.07389 – 1.07902
Stop Loss (SL): Above 1.07902
Take Profit (TP): 1.06342 (recent demand / support zone)
⚖️ Risk-Reward (RR):
Approx 1:3, maintaining a favorable setup for next week.
📅 Setup valid for Oct 6 – Oct 10, 2025
⚠️ Disclaimer: This analysis is for educational purposes only. Not financial advice. Please trade with strict risk management.
BULLISH SWING OPPORTUNITY IN GBPCHFSo previously we have had analysis on H4 timeframe for a price retracement.
The price of ICMARKETS:GBPCHF is behaving exactly the same and formed a great Bullish Hammer at strong support level.
When we come on hourly timeframe we witness that the price is in oversold area from where the buyers will take control to move the price into 1.0810 - 1.0828 area.
Our buying strategy is simple. We placed a buy stop order at the Lower High at 1.0750 with a stop loss at 1.0708.
I am Taking a 42 pips risk with reward of 50 pips (even more can be taken but my TP is at 1.0800 level to be on the safe side.
Hence
Entry (Buy stop): 1.0850
Stop Loss (42 pips): 1.0708
TP (50 pips): 1.0800
GBPCHF BEARISH MOMENT WILL TURN ON AFTER RETRACEMENT.ICMARKETS:GBPCHF
The Swiss Frank is capping due to bullish moment of a fundamental asset, Gold.
We believe that the Swiss frank will not frank against Loonie, after hitting resistance risistance area.
From their we will move look at a nice bearish signal on candlestick pattern to enter into sell mode.
A H4 close above that resistance area will pave way to the bullish momentum but I believe it will not be a frank. Let it make a new Higher high near that resistance Area.
A clear signal is subject to price action near resistance area.
BUY GBPCHF📊 Trade Setup: BUY GBPCHF
🔹 Entry: 1.07584
🔹 Take Profit (TP): 1.12418 🎯
🔹 Stop Loss (SL): 1.05802 🛑
📈 Technical Outlook:
Price is trading above a strong support zone , indicating buyers are active.
The pair is forming higher lows, suggesting an emerging uptrend.
On the 1H chart, bullish candlesticks confirm buying pressure.
Nearest resistance is at 1.06930, and a breakout above this could open the way toward
⚡ Bias: Bullish as long as price holds support.
💡 Risk-Reward Ratio: ~1:2.71(good setup for intraday & swing traders).
GBP/CHF – Potential Pullback to Supply ZoneGBP/CHF is currently trading around 1.0868 after bouncing from the demand zone near 1.0818.
Price is consolidating within a range, showing rejection from the lower support area.
Immediate upside target sits around 1.0858 (Target 1), with potential continuation towards the supply zone 1.0890 – 1.0900.
If the supply zone holds strong resistance, we could see another move back down to the demand zone 1.0818 – 1.0820.
Bias:
Bullish short-term towards 1.0858 – 1.0890.
Watching for rejection at supply for a potential reversal.
Key Levels:
Demand Zone: 1.0818 – 1.0820
Target 1: 1.0858
Supply Zone: 1.0890 – 1.0900
GBPCHF – Could This Be the Start of a Bullish Comeback?Looking at GBPCHF right now, it feels like the market is finally speaking my language.
After an extended downtrend, price has landed on a major support zone visible on the higher timeframes — a zone that’s been tested and respected multiple times before. We're now seeing early signs of rejection from that area, and I’m eyeing a potential move back up toward 1.1000.
What makes this setup stand out isn’t just the technicals — it’s the patience behind the play. I waited for the sell-off to complete, for price to return to a proven zone, and now I’m watching for signs of strength to kick in. This type of setup? I’ve seen it play out time and time again in my previous chart work.
Drop your thoughts in the comments — do you see the same potential, or are you taking a different side of the trade?
GBPCHF - LIKELY TO REMAIN RANGE BOUNDSymbol - GBPCHF
CMP - 1.1388
The GBPCHF pair has been consolidating within a range for the past 6 months, and it is expected to remain within this range for some time. Currently, the pair is testing the upper resistance zone of this range, which has acted as a cap on price movements. As a result, I expect the price to fall back within the range from here.
Trader's focus should be on the price action near the resistance zone. Given that the pair is currently at a critical point, it offers a good opportunity for a short trade as the risk-reward ratio is very favorable. A rejection from this resistance could see the price moving lower, providing an opportunity for traders looking for a pullback within the range.
If the price breaks above 1.1400 - 1.1410 and sustains above this level, the market outlook will shift. In that case, we may witness a breakout of the current range, with bullish momentum potentially taking over.
Resistance levels: 1.1400, 1.1375
Support level: 1.1270, 1.1215
Given the current resistance and the likelihood of a reversal within the range, the short trade setup offers a solid potential for a good profit. However, any decisive break above 1.1400 will change the market structure, signaling a potential shift to bullish momentum.