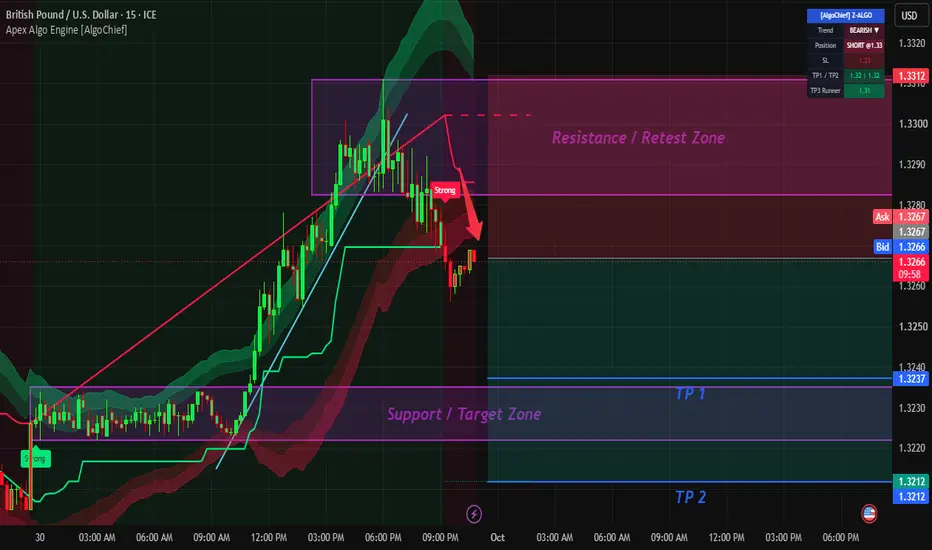
GBPUSD (15M): Trendline Breakdown & Retest Setup | Bearish Move
GBPUSD has shown significant rejection from the 1.3315 highs, breaking cleanly below its ascending trendline with strong bearish momentum.
🔍 **Technical Breakdown:**
- **Trendline Break:** Clear structural breakdown confirmed on the 15-minute timeframe.
- **Resistance Retest:** Price is currently
British Pound / U.S. Dollar
No trades
No trades
Compare with GBP to USD
Pair info
GBPUSD, often referred to as “The Cable”, a foreign exchange term used to describe the British pound vs the US dollar, is one of the oldest traded currency pairs. In July of 1866, after an earlier failed attempt, the first reliable exchange rate between the British pound and the US dollar was transmitted between the London and New York Exchanges. Optic fibre cables accompanied by satellites handle the Transatlantic communications today.
GBPUSD 4H | Demand Zone & Channel Support ReactionGBPUSD — 4H Technical Analysis
GBPUSD has been in a broader bearish structure, but price is now reacting from a well-defined 4H demand/support area that aligns with the lower boundary of an ascending channel.
The setup is based on three key factors:
1️⃣ 4H Demand Zone
Price has repeatedly reacted
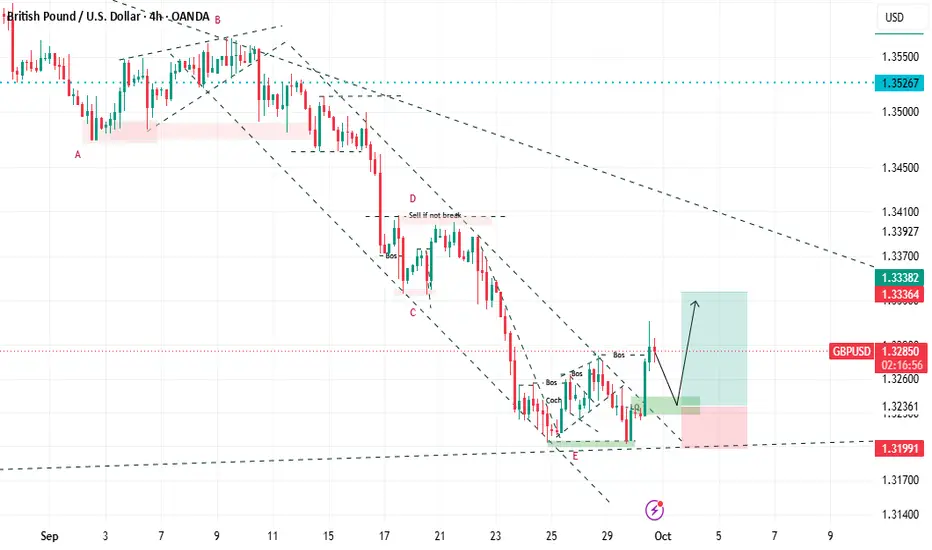
GBPUSD - Double Bottom + BOS - Buy Setup | 4HDescription:
GBPUSD Buy Idea - 4H Structure ShiftAfter a strong sell-off, GBPUSD formed a Double Bottom at 1.31991 (E point) with Liquidity Grab (LQ).Structure:CHoCH + Multiple BOS on 4H (as marked)Price broke the falling wedge / descending trendlineNow pulling back into Order Block 1.32361 - 1.325
The Market’s Phase TransitionIn physics, matter can exist in different states. Water can be ice, liquid, or vapor, and each state behaves differently even though it is made from the same basic substance. A change in temperature or pressure can cause one state to transform into another. Financial markets can behave in a similar
GBPUSDLooking at the GBP/USD 4H chart, the structure has clearly shifted after price broke below the rising trendline that had supported the market for several weeks.
The key area now sits around 1.3281–1.3304. This zone lines up with the 0.618–0.5 retracement area and could act as resistance if price att
GBPUSD: Falling Wedge Breakout + BOE Hawkish News DESCRIPTION FOR POST :📈
GBPUSD - 4H BUY SETUP - Triple ConfluencePrice has been in a descending channel since 11th Sep. Now at final support.
Structure Analysis (as marked on chart) :E Point (1.3200): Double bottom formed on 25-26 Sep. Strong demand zone, liquidity sweep completed.Coch (Change of
GBPUSD – Good Bullish Opportunity due to Successful Divergence The GBPUSD formed the same divergence 2 times before and both were failed because the price didn’t fully broker out the Higher Low after forming Divergence on 11-09-2026 and 17-09-2026.
This time though, it broke the Higher Low and formed a new Higher High which indicates a simple opportunity for
BUY GBPUSDHaving been away from my tradingview platform for a long time, I will analyze all my charts and upload them. The GBPUSD is creating higher highs on the daily timeframe and will retest if it create the rejection condition on the D1 timeframe at entry point i will take trade.
ENTRY - 1.33915
TP - 1.37
See all ideas
Displays a symbol's price movements over previous years to identify recurring trends.
Frequently asked questions
The value of the GBPUSD pair is quoted as 1 GBP per x USD. For example, if the pair is trading at 1.50, it means it takes 1.5 USD to buy 1 GBP.
GBPUSD is a major currency pair, i.e. a popular currency paired with USD.
Currencies are usually traded through forex brokers — choose the one that suits your needs and go ahead. You can trade GBPUSD right from TradingView charts — just log in to you broker account. Check out the list of our integrated brokers and find the best one for your needs and strategy.