Nasdaq Composite set to rise to 28600IXIC has spent time in consolidating inside wave 2. what looked like an expanded flat, is now a flat with the expanded part being only wave a of the struture. The 40dema has worked as support twice now as the bands tighten. Wave 3 follows and can has a Fibonacci projection up to 28600 in the coming weeks. September could be a good month after all.
Nasdaq Composite Index
No trades
No trades
In-depth trading ideas
Nasdaq wave III is startingThe momentum is back to zero and an expanded flat maybe complete for the Nasdaq Composite index. The next leg up could take it to 28365 based on our Fibonacci Projections. Tech stocks have seen a good pullback and are ready to move again is what this means. Time to let it run, and run with it. It may not matter that you are heading into a seasonal corrective month because the correction already happened.
Nasdaq breaking out of a flag pattern after ABCAn ABC correction, or zig-zag in Elliott wave language, is complete in the Nasdaq. Now it is attempting to break out of the flag, and that will set its course for a move up to 27600 at least. A new all-time high again. After all that bubble talk. RMI is giving a buy signal, just as weekly MAs are holding out as support
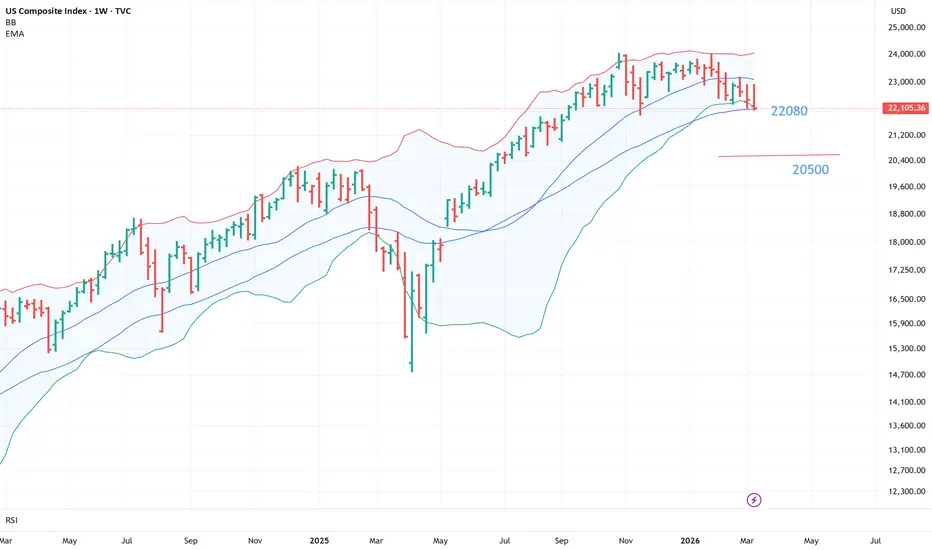
Rohit's Trade Setup on Nasdaq CompositeThe Nasdaq Composite is about to break the 40wema at 22080, and if it does, we are going down to 20500. On the daily chart, the index is making a series of lower highs and lower lows - what we define as a Dow theory downtrend, and there is no change. So continue to expect the trend down to extend and accelerate
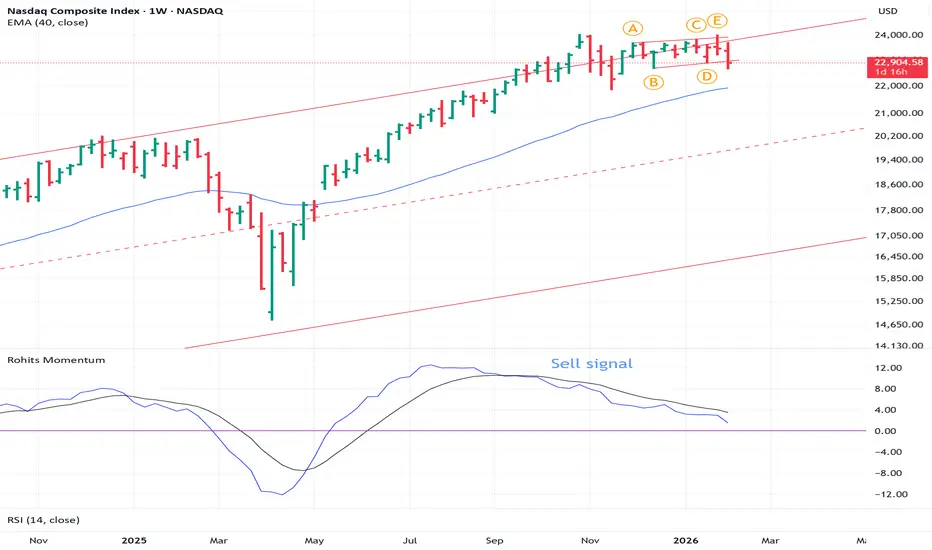
Nasdaq Breaks down From Ending Diagonal confirming bearish trendAn ending diagonal occurs in wave 5 of a rising market and marks the last and final push higher. So the Nasdaq closing below the lower line of the wedge yesterday was an important market signal of a breakdown in trend from an Elliott Wave perspective. It means we could be in a correction that could last for weeks. The S&P 500 also sports an ED that should follow and break as well.
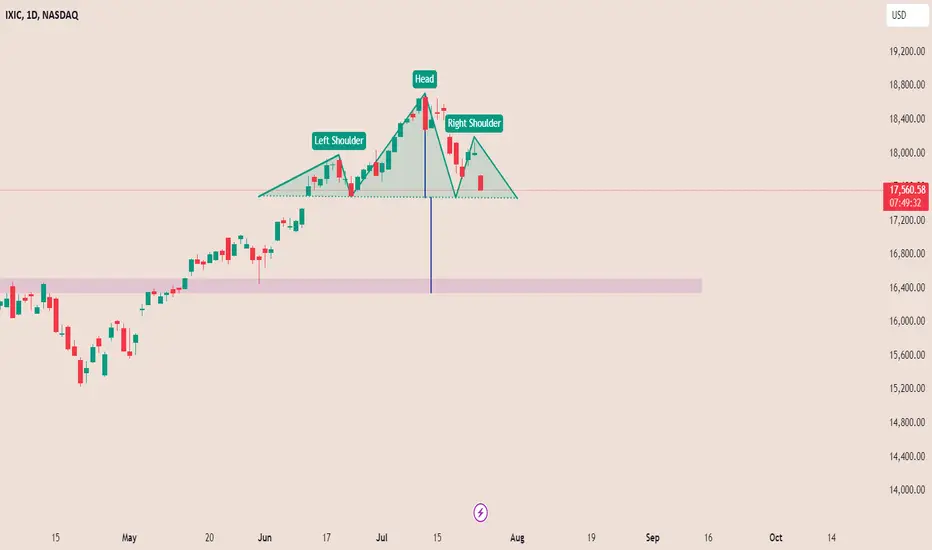
NASDAQ FACING STRONG RESISTANCETherr is strong resistance above today's high it means the resistance whivh i marked is not possoble to get broken. And i marked support in green coloured horizontal lines,this is based on gann theory.
You should remember this is not buy/sell call.
If you are long should exit here you have chance to long above resistance mentioned.
one more thing mathemetically NASDAQ ractangle is at maximum extension.
NASDAQThe weekly NASDAQ Composite (IXIC) chart shows a strong uptrend, Price action has respected a long-term ascending support line and is approaching the next key resistance near 28,000. The overlaid arc suggests a possible medium-term rally toward that 28,000 zone before a significant pullback, potentially toward 14,000, which aligns with a major support.
NASDAQ Composite (IXIC)- 1hr Reversal Setup Targeting 20,868This 1-hour chart shows a potential short-term reversal on the NASDAQ Composite, identified using Leola Lens SignalPro.
🔍 Technical Notes:
🟢 Price recently tested the upper red supply zone near 21,454, where prior SELL pressure emerged.
⚪ The white trendline (mid-term bias) is still below price, suggesting a test of resilience before reversal.
🔴 Multiple rejections near the supply zone may hint at exhaustion of buying momentum.
📉 Target: 20,868 — aligning with a prior structural pivot and li
US Markets further correction expectedThe US Markets decline last night is just the beginning of some further expected correction. The signs were all over the place. The indices had rallied and now there is bound to be some correction. I see IXIC correcting further to 16k levels in the coming weeks.
Do not indulge in fear mongering and think of it as recession and such fancy words used by the media. This is just a mere blip in the uptrend. Stay invested and trade responsibly.
NASDAQ COMPOSITE INDEX DAILY CHART GANN ANALYSIS 15 AUGUST 2024.Nasdaq Composite Index made a swing low at 15222.78 on 19 April 2024. From that low we had cycle target at 17125.63 which was achieved on 05 June 2024 with a gap up. earlier we made a high at 17022.66 on 28 May 2024 and then we retraced to important level of 16490.18 on 31 May 2024. We see the next cycle birthzone level was crossed again with a gap up on 12 June 2024 and it was again retested on 24 June 2024 with intermediate high at 17650.69 on 20 June 2024 which was a double top with earlier t
NASDAQ COMPOSITE INDEX WEEKLY GANN ANALYSIS FOR MAY 2024Nasdaq Composite Index had made an important swing bottom in the week of 10 Oct 2022 at 10088.83. As per monthly time cycle Sept 2022 was important we were off by two weeks. The level os 10000 was psychological support which was protected. Next target on it was Gann 50% Rule at 15000. This was attempted by it with a high of 14446.55 and 14370.91 at 50% time on the weekly time cycle at the fag end of July 2023. Thereafter we corrected for 12 weeks to make a low of 12543.86 on 23 Oct 2023 weekly c
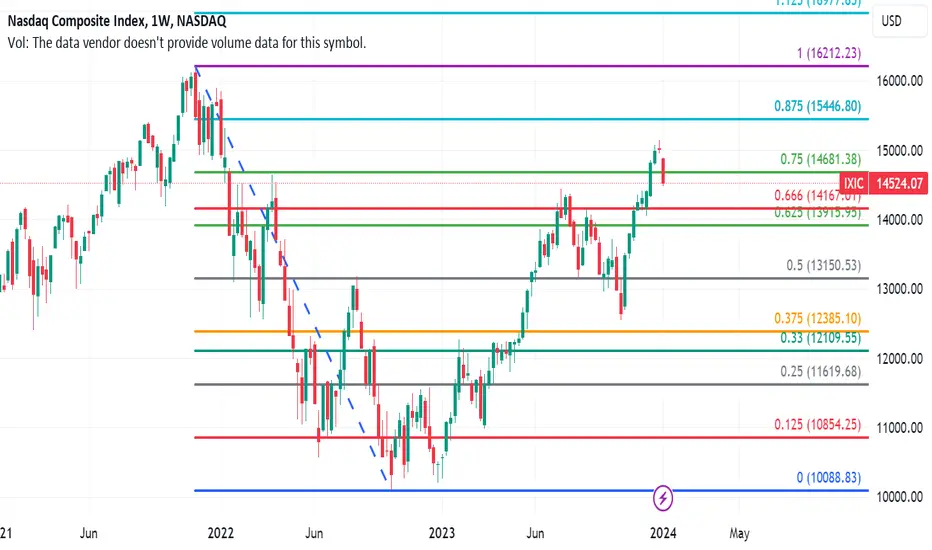
NASDAQ COMPOSITE INDEX (IXIC) 14524.07 (+0.09%) Nasdaq Composite Index has seen some profit booking in last 2 weeks. Recent high at 15150.07 was not sustained with 15151 as mirror number ( I am always fascinated with such numbers). Incidentally the level of 75% of the range saw profit booking which was 14681.38. We need to sustain above this level to see further growth on the index.Supports at 14167.01 and 13915.95 as seen on chart.
First warning on weekly candle was a small body candle with big tail on upside and small tail on lower side. A
NASDAQ chart study IXICNasdaq ixic index at 15050
Daily time frame
Bearish wolf wave pattern formation on long time consideration ,
ascending sharp wedge on smaller time consideration
Wedge is already broken and reversal from above the wolf wave resistance line is in progress,,
if this wolf wave has to progress as per theory, than index might head towards levels of 13700-13500.
in between if needed modification can be done,,
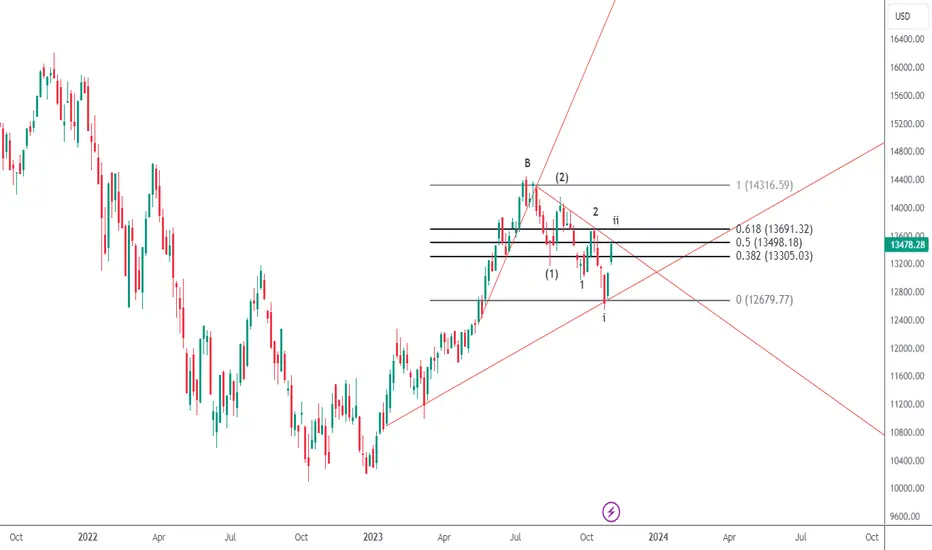
Nasdaq at a strong resistanceThis Index too is making a series of 1's and 2's in the start of its C leg. The current rally has halted at trendline and Fib resistance. And as a cardinal rule it cannot surpass 13690 which is the start of wave i. We have a reversal signal now on the hourly charts from RSI and Composite. So yet another Index is indicating that this rally is done.
Nasdaq in complex correctionNASDAQ:IXIC
I think Nasdaq composite is in XX Wave right now. No one can predict this wave how long it will be what kind of structure will unfold in this structure.
Two Possibilities: -
1] It's in control range within main range. where price retest at resistance of control range.
So, maybe price will go near 13500/- for retest and then go up near 13800/-
After 13800/- price will go below 13000/- for completion of Wave Z.
2] Price will go straight from here to 13800 and then will go near 1300