NESTLEIND - DAILY - HARMONIC PATTERNSpotted- Bullish harmonic pattern in NESTLEIND on the daily time frame
Observe whether it respects the harmonic levels.
Study-Practice-sharing
Educational purpose only.
This is not a recommendation.
I am not SEBI registered - Do not TRADE/INVEST based on what I publish here.
I am not responsible
Nestle India Ltd.
No trades
No trades
Compare with Nestle India Ltd.
19.8 INR
34.99 B INR
231.13 B INR
715.06 M
Next report date
—
Report period
—
EPS estimate
—
Revenue estimate
—
Company info
Sector
Industry
CEO
Manish Tiwary
Website
Headquarters
Gurgaon
Founded
1912
IPO date
Jan 8, 2010
ISIN
INE239A01024
FIGI
BBG000CX27Y8
Identifiers
ISIN INE239A01024
Nestlé India Ltd. engages in the manufacture and sale of food products. The firm offers beverages; breakfast cereals; chocolates and confectionery; dairy; nutrition; foods; vending and food services; imports; exports; and Nestle ad campaign brands. It operates through the India and Outside India geographical segments. The company was founded in 1912 and is headquartered in Gurgaon, India.
NESTLEIND - The Big BreakNestlé India is finally making its move. After months of sideways consolidation, the weekly chart reveals a massive breakout above the critical resistance zone. With prices surging past the upper Bollinger Band on heavy volume, the momentum suggests the "Quiet Phase" is officially over. Investors ar
NESTLEINDOn the weekly timeframe, the price structure appears to be forming a potential bearish harmonic pattern near the PRZ. Based purely on the harmonic structure, my view is bearish and I am watching for a possible reversal from this zone.
This is only my technical/educational view based on harmonic pat
Nestlé India Ltd.📈 Nestlé India Ltd. (1W) – Strong Breakout Retest Keeps the Long-Term Trend Bullish 🚀
Nestlé India has successfully broken above a long-standing resistance zone and is now consolidating just below the next key hurdle. The breakout, backed by strong volume and a healthy retest, suggests that the sto
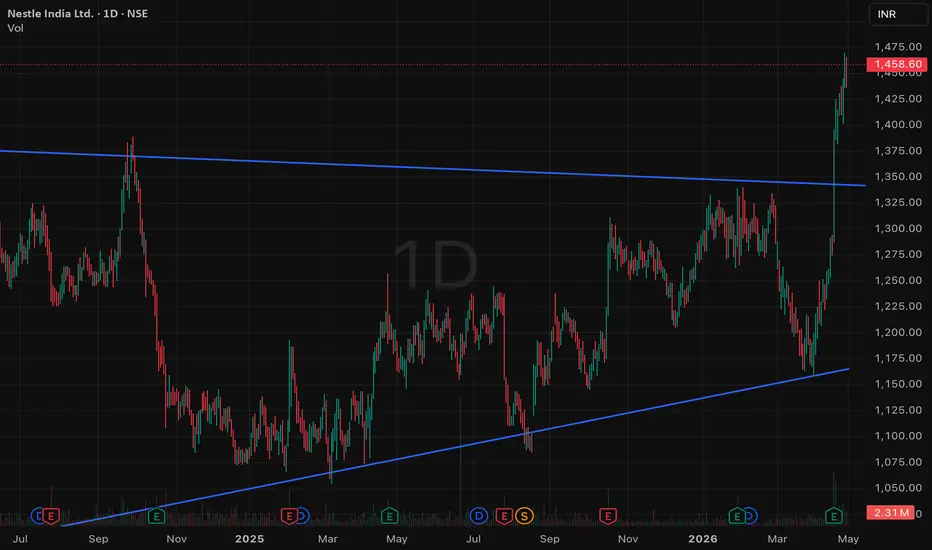
NESTLE Stock Analysis 📈 NESTLE INDIA LTD. | Descending Triangle Breakout | Bullish Reversal Setup
A descending triangle formed during the consolidation phase. The breakout above resistance signals buyers have regained the upper hand, paving the way for further upside.
On the 4H chart, Nestle India has been trading with
Nestle India cmp 1455 Daily ChartNestle India cmp 1455 Daily Chart
- Support Zone 1370 to 1415 Price Band
- Resistance Zone 1460 to ATH 1498.10 Price Band
- Volumes trending above average traded quantity
- Breakout sustained above Falling Resistance Trendline
- "W" Double Bottom formed at Support Zone lower side
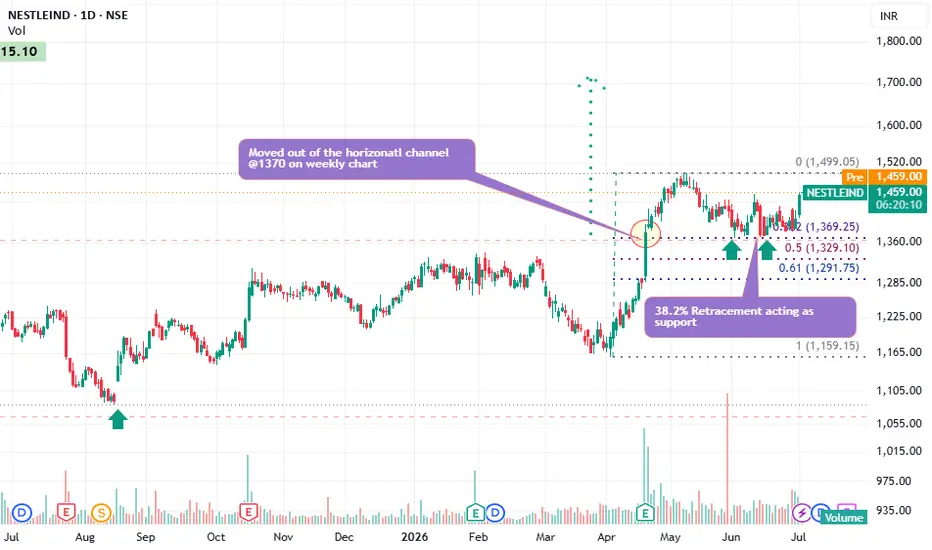
Daily chart of Nestlé IndiaCurrent price: ₹1,454
This is a daily chart of Nestlé India with a Fibonacci retracement drawn after a strong breakout. Here's the technical interpretation:
1. Weekly Breakout (Most Bullish Signal) ✅
The stock broke above the long-term horizontal resistance near ₹1,370 on the weekly chart.
Such bre
NESTLE: Triangle Pattern BreakoutNESTLE has been consolidating for few years forming a triangle pattern and has clearly broken the resistance now. Based o the calculation, stock is expected to move up in the long term.
Stop loss would be around 1288 price range and expect a potential risk reward ratio of 1:3
See all ideas
Summarizing what the indicators are suggesting.
Neutral
Neutral
Neutral
An aggregate view of professional's ratings.
Neutral
Neutral
Neutral
Displays a symbol's price movements over previous years to identify recurring trends.
Frequently asked questions
The current price of NESTLEIND is 1,319.0 INR — it has decreased by −0.38% in the past 24 hours. Watch Nestle India Ltd. stock price performance more closely on the chart.
Depending on the exchange, the stock ticker may vary. For instance, on NSE exchange Nestle India Ltd. stocks are traded under the ticker NESTLEIND.
NESTLEIND stock has risen by 1.31% compared to the previous week, the month change is a −5.61% fall, over the last year Nestle India Ltd. has showed a 12.74% increase.
We've gathered analysts' opinions on Nestle India Ltd. future price: according to them, NESTLEIND price has a max estimate of 1,891.00 INR and a min estimate of 1,350.00 INR. Watch NESTLEIND chart and read a more detailed Nestle India Ltd. stock forecast: see what analysts think of Nestle India Ltd. and suggest that you do with its stocks.
NESTLEIND reached its all-time high on Aug 7, 2026 with the price of 1,553.0 INR, and its all-time low was 114.8 INR and was reached on Apr 23, 2010. View more price dynamics on NESTLEIND chart.
See other stocks reaching their highest and lowest prices.
NESTLEIND stock is 2.55% volatile and has beta coefficient of 0.73. Track Nestle India Ltd. stock price on the chart and check out the list of the most volatile stocks — is Nestle India Ltd. there?
Today Nestle India Ltd. has the market capitalization of 2.55 T, it has increased by 1.78% over the last week.
Yes, you can track Nestle India Ltd. financials in yearly and quarterly reports right on TradingView.
Nestle India Ltd. is going to release the next earnings report on Oct 15, 2026. Keep track of upcoming events with our Earnings Calendar.
NESTLEIND earnings for the last quarter are 5.06 INR per share, whereas the estimation was 4.32 INR resulting in a 17.19% surprise. The estimated earnings for the next quarter are 5.27 INR per share. See more details about Nestle India Ltd. earnings.
Nestle India Ltd. revenue for the last quarter amounts to 63.78 B INR, despite the estimated figure of 60.24 B INR. In the next quarter, revenue is expected to reach 67.51 B INR.
NESTLEIND net income for the last quarter is 9.59 B INR, while the quarter before that showed 11.11 B INR of net income which accounts for 0.00% change. Track more Nestle India Ltd. financial stats to get the full picture.
Nestle India Ltd. dividend yield was 1.02% in 2025, and payout ratio reached 66.13%. The year before the numbers were 1.20% and 81.16% correspondingly. See high-dividend stocks and find more opportunities for your portfolio.
As of Oct 8, 2026, the company has 19.16 K employees. See our rating of the largest employees — is Nestle India Ltd. on this list?
EBITDA measures a company's operating performance, its growth signifies an improvement in the efficiency of a company. Nestle India Ltd. EBITDA is 57.95 B INR, and current EBITDA margin is 22.90%. See more stats in Nestle India Ltd. financial statements.
Like other stocks, NESTLEIND shares are traded on stock exchanges, e.g. Nasdaq, Nyse, Euronext, and the easiest way to buy them is through an online stock broker. To do this, you need to open an account and follow a broker's procedures, then start trading. You can trade Nestle India Ltd. stock right from TradingView charts — choose your broker and connect to your account.
Investing in stocks requires a comprehensive research: you should carefully study all the available data, e.g. company's financials, related news, and its technical analysis. So Nestle India Ltd. technincal analysis shows the strong sell today, and its 1 week rating is sell. Since market conditions are prone to changes, it's worth looking a bit further into the future — according to the 1 month rating Nestle India Ltd. stock shows the buy signal. See more of Nestle India Ltd. technicals for a more comprehensive analysis.