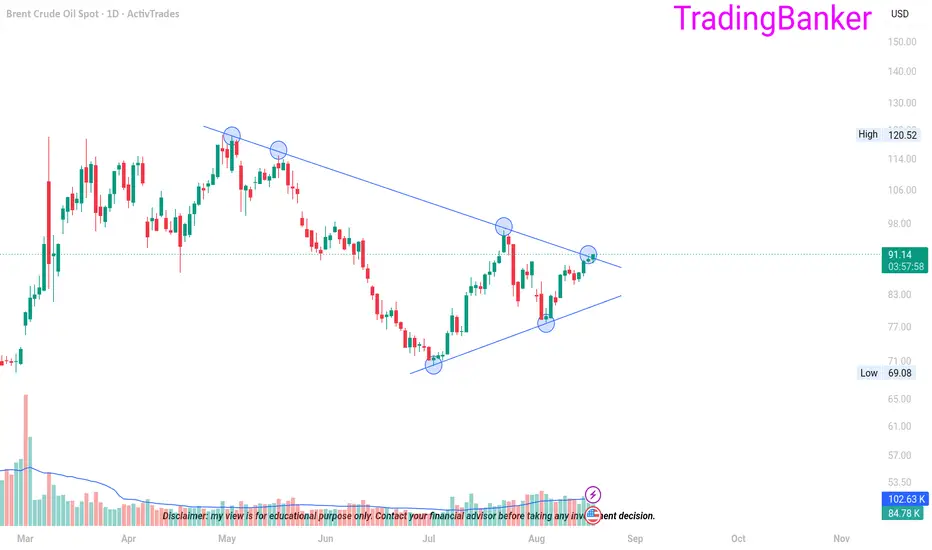
Oil is back on the tableBrent crude's impulsive advance has changed everything. From a wave 2 consolidation, we are back into the possibility of a third-wave advance. The word impulsive refers to the Elliott wave five-wave rise that we see on charts. Five waves up indicate that the trend is up and not down. This means high
Oil Fell 37% While the Hormuz Blockade Was Still On
OANDA:BCOUSD
The Market Already Faded One Hormuz Blockade.
This Time Is Different - Maybe.
--------------------------------------------------------------------
THE OBSERVATION
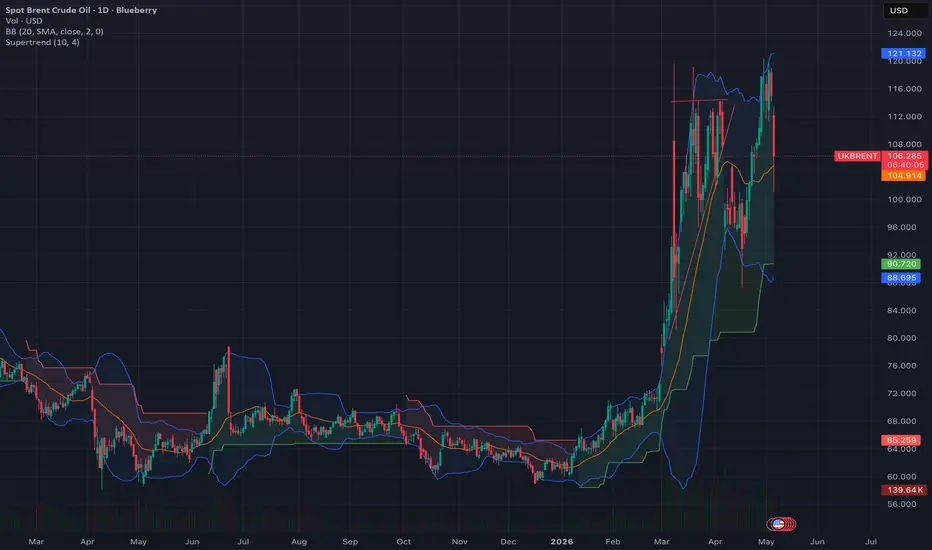
Brent peaked near $112 in mid-May. By July 1 it traded at roughly $70.50. That is a 37% collapse in six weeks.
Her
Possible upmove in CrudeCrude closed ~10% higher last day to close above $83, first time in last four weeks, amid the geopolitical tensions. It has closed above the key resistance zone of $80. Hence, I expect a upmove towards $90-92 (previous support zone) from here. Let me know your thoughts. DYOR.
Crude AnalysisThe current ~$80 acted as a resistance multiple times pre-conflict, so I expect it to take some support at the current levels. $70 is a multi-year support level and in fact the recent rally fuelled to $120 after the strong breakout and retest from this level. On the otherside, $92 can continue to ac
Don;t get fooled by Calm Before The Stormcrude is highly regulated commodity. Everbody wants a piece of the pie making it a slow mover. It has completed wave (B) in almost 3yrs and only 1 of (C) was done. That itself shook the world. Now the genie is out of the bottle....it cannot be re-bottled whatever wishful thinking one can undergo. W
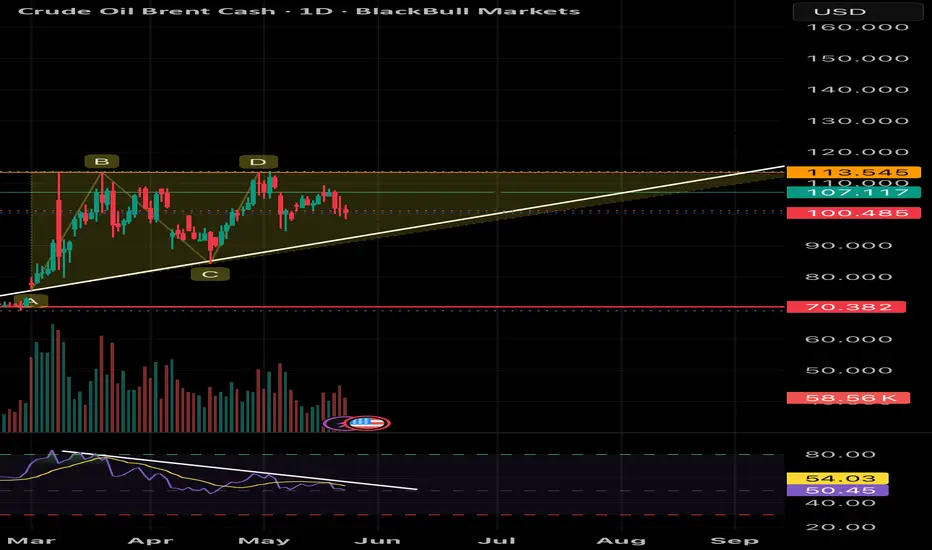
Brent Crude Oil – Daily Time Frame AnalysisBrent Crude Oil – Daily Time Frame Analysis 📊
Brent Crude continues to trade inside a broader bullish structure while respecting a long-term rising trendline from March lows. However, momentum is slowing near the major supply zone around 113–114.
🔹 Key Observations:
• Price is forming higher lows,
Trade Like Institution Part-10Technical analysis is the study of price charts, patterns, and indicators to predict future market movements. It is based on the idea that price reflects all available information.
Core Principles
Price discounts everything
Market moves in trends
History repeats itself
Types of Charts
Line Chart
Ba
UKOIL: At a Glance Level Analysis for 11th May 2026UKOIL: At a Glance Level Analysis for 11th May 2026
━━━━━🟥🟧🟨🟩🟦🟪⬛━━━━━
💥Level Interpretation / description:
✍🏻L#1: If the candle crossed & stays above the “Buy Gen”, it is treated / considered as Bullish bias.
L#2: Possibility / Probability of REVERSAL near 🔕RLB#1 & 🔔UBTgt
L#3: If the candle
See all ideas
Displays a symbol's price movements over previous years to identify recurring trends.