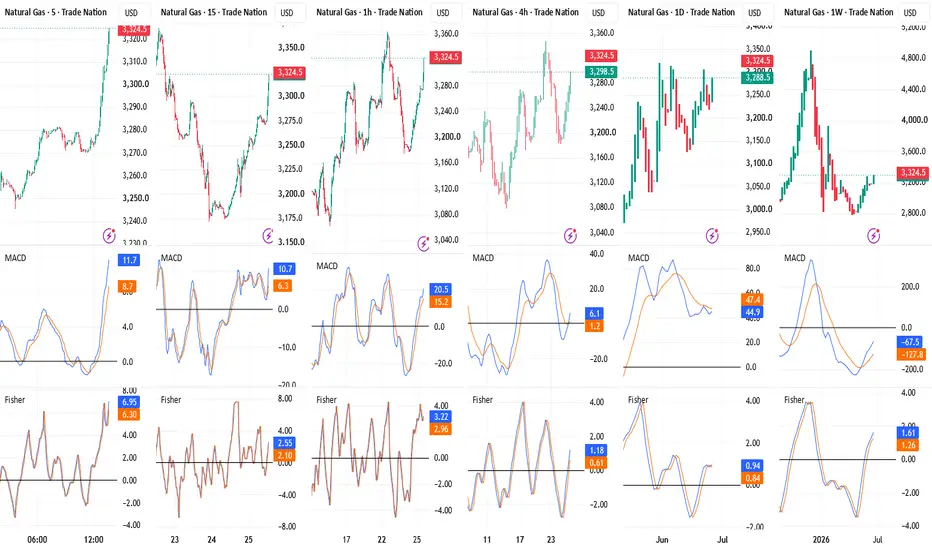
Extremely BULLISH NATURAL GAS after crossing 3.35 levelNatural Gas is showing Bullish Signal.
Bullish Inverted H & S is appearing on 1W Chart which will go for Long Term of Months.
On 1D Chart patterns,two Bullish patterns are developing
1) Inverted H & S (Confirmation will be once price cross 3.34/3.35 mark)
2) Higher Low with 4th Top (looks like inverted H&S but since it is appearing on Top, we may not call it inverted H&S as is the case in 1W Chart (which is appearing at Bottom.
Once the price takes out Resistance, price will run very fast and this will triggere BULLISH NG for months (Of course, Support/Resistance break will play on Shorter time frame of Hourly/Minute Chart).
Fisher and MACD both show positive signal.
Here I forecast how the things will happen exactly (after Big run up): -
When 1Month Fisher has positive crossover (+X) by that time price would have run up too fast. Therefore cool down will begin after 1M +X of Fisher.
This will happen when 1D Fisher and MACD are at Extreme Top, 4Hour makes 2 Top with LOWER HIGH of Fisher and MACD.
POWER OF PRICE CYCLE (This will last for few months)
PREDICTED SUPPORT Level after TOP (and after 1M Fisher +Crossover -
1)1W MACD will not fall below Signal Line and Fisher may be Negative
2) 1D MACD will negative crossover and shall fall upto 0
3) 4H both MACD and Fisher at Extreme Bottom.
Ehat point of time will be again to enter on Buy side.
But in between, there are many days to play BULLISH BLAST after 3.35.
In-depth trading ideas
NG Changed its course, 4H H&S pattern failed. Now BUYYesterday, a Head & Shoulder pattern was visible on 4H Chart. I wrote that once neckline is broken, initiate a Short (@ 3.17 price. But it did not happen.
Instead, just opposite has happened and price has moved above Shoulder (Left/Right).
This change of event has forced me to write that never initiate a trade before confirmation.
Support Break as stated by me was NECKLINE BREAK (which did not happen)
Now a long (BUY) after shoulder crossover is triggered.
Natural Gas (NG) - 4Hour Head and Shoulder Pattern On 4H Chart, a dangerous Chart formation (Bearish) called Head & Shoulder pattern emerged. Right Shoulder process is going on. If price falls below neckline from right shoulder, it will be extremely bearish.
But wait for break down (Price 3.16) for confirmed entry on bearish side.
Minimum target = 3.17 - (Top @3.35 -neckline @3.17)= 3.16- 0.18 = Slightly Below 3.0 Support after neckline break.
Natural Gas | Bullish Setup | 4h TimeframeNatural Gas XNGUSD 🚀 Bullish Setup from Reversal Zone
Natural Gas is currently showing a strong bullish recovery structure on the 4H chart. 📈
Price has respected the lower reversal zone and started moving upward with higher highs and higher lows. The latest red trendline is acting as the current bullish projection path, showing that if price continues holding above the support/reversal area, the next upside targets can remain active.
The long position setup updated on 23/05/2026 is based on the price holding above the major reversal demand zone around 2.90–2.78. This area is important because buyers previously reacted strongly from here, and the chart is showing accumulation before continuation. As long as price stays above this zone, the bullish structure remains valid. ✅
The first reversal zone near 2.70–2.85 worked as a major base area where price rejected the downside and started the upward movement. The second reversal zone around 2.90–3.00 is now acting as the key retest and continuation area. If price pulls back into this zone and shows rejection, it can become a fresh entry/support zone for the next bullish move. 🔄
The upside targets marked on the chart are around 3.42, 3.45, 3.49, 3.55 and 3.64. A clean breakout above the recent high near 3.49 can open the path toward the higher resistance zone. 🚀
Key Levels:
Support/Reversal Zone: 2.90–2.78
Invalidation Area: Below 2.67
Current Price Area: Around 3.03
Upside Targets: 3.42–3.64
Overall, Natural Gas is looking constructive as long as the reversal zone holds. The red trendline shows a bullish roadmap, but confirmation will come only if price sustains above support and breaks the recent high with strength. ⚡
Disclaimer: This is my personal chart study and not financial advice. Please use proper risk management before taking any trade. 📊
Natural Gas: Recovery Structure Testing Pivot AcceptanceNatural Gas continues showing recovery behaviour from higher timeframe support and is currently testing a key pivot region.
Structural Observation
• Recovery Structure → Re-Expansion Attempt
• Reaction from major support (~2.50)
• Testing structural pivot acceptance (~2.90–3.05)
Behaviour Observation
• Higher low formation developing
• Pivot acceptance under observation
• Recovery remains active
Educational Layer
Recovery structures can initially appear impulsive but may also evolve into broader rotational behaviour before expansion develops.
Possible Pathways
Bullish: Above 2.90–3.05 → 3.25–3.45 → 3.70–4.00
Neutral: 2.50–3.25 rotation / time correction
Weakness: Below 2.50 → prior demand behaviour
Structure remains primary while future movement remains conditional.
Structure → Level → Trigger → Probability
#NaturalGas #NG #Commodities #MarketStructure #ElliottWave #TechnicalAnalysis #TradingView #MarketOmorph #PriceAction #TradingEducation
Natural Gas is currently reacting from a key higher timeframe🔍 Key Observations:
• Price has tapped into a strong demand / reversal zone near 2.65–2.75
• Liquidity below previous lows appears to be taken
• Early signs of bullish reaction visible from the zone
📈 SMC Perspective:
This move looks like a classic liquidity grab followed by a potential displacement.
If price sustains above this zone, we may see continuation towards higher liquidity levels.
🎯 Expected Move:
• Upside targets projected towards 3.20 – 3.60 range
• Expansion phase possible if structure shifts on higher timeframe
⚠️ Invalidation:
• Breakdown below 2.65 will invalidate bullish bias
💡 Note:
This is a positional view based on Smart Money Concepts (SMC).
Always wait for confirmation and manage risk accordingly.
------------------------------------
Trade Safe | Follow Structure, Not Emotions
Natural Gas (XNGUSD) | Daily | 24 Mar 2026Structure: Range / Distribution
Location: Upper Range
Supply: 5.00 – 5.27
Pivot: 3.00 – 3.20
Demand: 1.60 – 2.00
Behaviour:
Rejection near supply, rotational behaviour continues.
Invalidation:
Acceptance above supply zone
Continuation:
Rotation within range between defined zones
This analysis is for educational purposes and reflects structural market observation.
Structure → Level → Trigger → Probability
#MarketStructure #StructuralAnalysis #NaturalGas
X
Natural gas have never closed below the 2.8 mark line on weekly bases from last 16 month will be interesting to see this month if manages to hold 2.8 on closing bases can see fresh buying power emerging that can move price higher back towards previous swing high levels . strucure to consider fail if weekly/monthly sart closing below yellow support mine .
XNGUSD — Bottom or Reaction? Structure FirstNatural Gas has reacted sharply from a high-confluence support zone, but structure remains corrective, not impulsive.
What just happened:
• Price tagged the 0.707–0.786 retracement (2.67–2.38)
• Confluence with rising trendline
• Immediate rejection → active demand confirmed
What this means:
✔️ Valid support reaction
❌ Not a confirmed bottom yet
Bottoms are zones, not points.
Key Levels
Support:
🔹 2.35 – 2.70 → structural demand
Loss below this weakens structure
Pivot:
🔹 3.00 – 3.10 → reclaim needed for strength
Resistance:
🔹 3.43 – 3.87 → heavy supply
Only above this does upside expand
Invalidation
❌ Sustained acceptance below ~2.35 invalidates the bullish swing idea
Until then, this remains a reaction inside a corrective structure
Not a trade call. Structure & risk awareness only.
Structure > Noise | Levels > Forecasts
X
XNG outlookBreak of structure of internal highs , Monthly demand has been tapped . Also , price has tapped into the higher time frame discounted zone from the fibonacci retracement tool
trade idea gives a 3.7 RRR , good zone to go long
XLong
Natural Gas (XNGUSD) AnalysisNatural Gas (XNGUSD) Analysis
On the daily chart, NG witnessed an aggressive sell-off from the highs made during early November
Although prices are now testing a long-term support base (blue ascending trendline) and have failed to close below the trendline.
A Classic Bullish Divergence has also been formed (Prices: Lower lows & RSI: Higher lows => brown boxes)
Also, RSI has started rising higher froma deep oversold zone (<30)
--------------------------------------------------------------------------------------
Therefore, if 2.80 holds, then potential bullish reversion can be expected
with upside targets of 3.00, 3.15 & 3.38
RSI will likely move back toward the 40–50 zone
Note: This would be a corrective rally, not a full trend reversal yet.
Alternative Scenario: If NG gives a daily close below 2.75, then Bullish divergence fails & next downside will be 2.60 & 2.45
XNGUSD At Good Demand Zone Hello Friends 👋 XNGUSD - Now Sustain At Good Demand Zone.If You Are Looking Up Side This Could Be A Good Opportunity For You📊
XLong
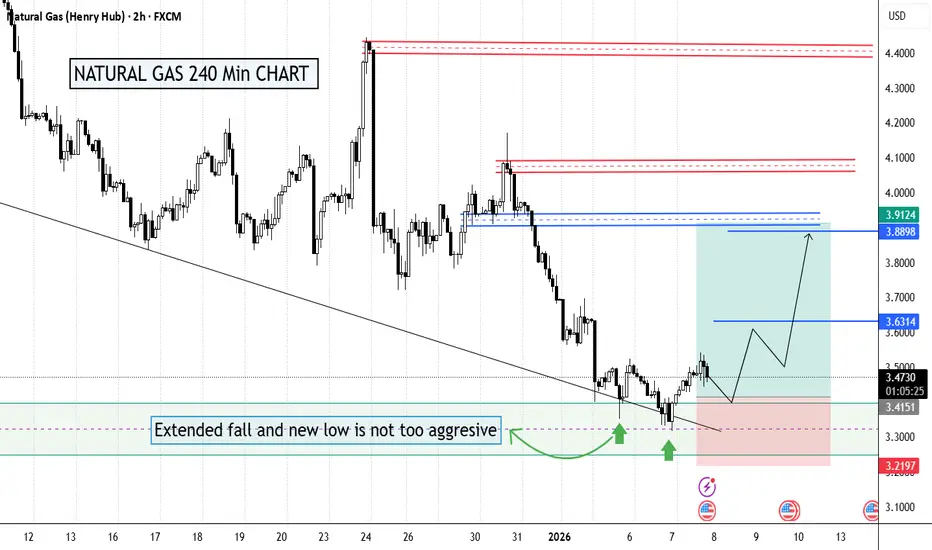
NGAS (Natural Gas) – Technical Analysis | 2HFX:NGAS
Channel support line hit: Price has reacted exactly from the lower boundary of the falling channel, indicating structural support is respected.
New low not aggressive : The recent breakdown didn’t show strong momentum or expansion in range → signs of selling exhaustion, not panic.
Demand zone respected : Buyers stepped in from the marked demand area, confirming willingness to defend this zone.
Overall structure suggests short-term mean reversion / pullback rather than continuation of sharp downside.
📉 Trade Plan
🟢 Buy Zone: 3.42 – 3.46
⛔ Stop Loss: 3.32
🎯 Targets:
T1: 3.63, T2: 3.89, T3: 4.10.
Keep Learning, Happy Trading.
NATGAS CAPITAL (USD) Current Price: ~3.280 USD Bias: BullishNATGAS CAPITAL is holding in a strong demand zone (3.00–3.20). With weather still in play and colder patterns likely later this winter, heating demand may pick up — supporting natural gas prices and potentially pushing this instrument higher.
Immediate resistances at 3.51, 3.68, 3.92; breakout beyond 3.92 opens room for 4.00+. Invalid below 3.00.
Although recent short-term forecasts showed milder weather reducing immediate demand, weather models still suggest elevated risk of cold air outbreaks later in the winter, which could revive demand and tighten supplies.
📊 Levels to Watch
🟢 Support Zone (Buyers):
3.00 – 3.20 USD — key demand zone.
Invalidation under 3.00 weakens bullish thesis.
🔴 Intermediate Resistances:
3.51 USD – First resistance
3.68 USD – Reaction level
3.92 USD – Key barrier before breakout
⭐ Major Upside Target:
4.00+ USD — expected once 3.92 is cleared convincingly.
📈 Trade Plan (Example)
📍 Long Entry Zone: 3.00–3.20
🛑 Stop Loss: Below 2.90
🎯 Targets:
Target 1: 3.51
Target 2: 3.68
Target 3: 3.92
Extended: 4.00+
Weather Watch: Continued colder forecasts later in winter could accelerate the move up.
Position Sizing: The Backbone of Risk Management in Trading1. Meaning of Position Sizing
Position sizing refers to deciding how much capital to allocate to a single trade.
It determines the number of shares, lots, or contracts to buy or sell.
Unlike entry or exit timing, position sizing directly controls risk exposure.
Two traders with the same strategy can have vastly different results due to different position sizing rules.
2. Why Position Sizing Is Crucial
Protects trading capital from large drawdowns.
Helps traders survive losing streaks.
Ensures that no single trade can destroy the account.
Converts a strategy from speculative gambling into a structured probability-based system.
Allows compounding to work effectively over time.
3. Position Sizing vs Risk Management
Risk management is the broader framework (stop-loss, diversification, hedging).
Position sizing is the execution arm of risk management.
Even with a stop-loss, poor position sizing can lead to excessive losses.
Proper position sizing ensures losses stay small, controlled, and recoverable.
4. Core Principle: Risk Per Trade
Professional traders define risk before entering a trade.
Common risk levels:
0.5% of capital per trade (very conservative)
1% of capital per trade (most common)
2% of capital per trade (aggressive)
Example:
Capital = ₹10,00,000
Risk per trade = 1%
Maximum loss allowed = ₹10,000
5. Position Size Calculation Basics
Position size depends on:
Total capital
Risk per trade
Stop-loss distance
Formula:
Position Size = (Capital × Risk %) ÷ Stop-loss per unit
This ensures risk remains constant across trades.
6. Fixed Percentage Position Sizing
Most widely used method.
Risk a fixed percentage of capital on every trade.
Advantages:
Automatically adjusts size as capital grows or shrinks.
Protects during drawdowns.
Encourages consistency.
Example:
Capital grows → position size increases
Capital falls → position size decreases
7. Fixed Rupee (or Dollar) Position Sizing
Risk a fixed monetary amount per trade.
Example: Risk ₹5,000 on every trade.
Advantages:
Simple and psychologically comfortable.
Disadvantages:
Does not adapt to account growth.
Less effective for compounding.
8. Volatility-Based Position Sizing
Position size adjusts based on market volatility.
Uses indicators like:
ATR (Average True Range)
Historical volatility
More volatile stocks → smaller position size.
Less volatile stocks → larger position size.
Helps maintain uniform risk across instruments.
9. Stop-Loss Based Position Sizing
Position size is calculated after defining stop-loss.
Wider stop-loss → smaller position.
Tighter stop-loss → larger position.
Encourages disciplined trading and realistic stop placement.
Prevents emotional stop-loss shifting.
10. Kelly Criterion (Advanced Method)
Mathematical formula based on:
Win rate
Reward-to-risk ratio
Designed to maximize long-term growth.
Often considered too aggressive for real trading.
Many traders use half-Kelly or quarter-Kelly for safety.
Suitable only for traders with reliable historical data.
11. Position Sizing in Different Markets
Equity Trading: Based on share quantity and stop-loss.
Options Trading: Based on premium risk and strategy complexity.
Futures Trading: Must account for leverage and margin.
Forex Trading: Uses lot sizes and pip value.
Each market requires adapting position sizing to its structure.
12. Impact of Leverage on Position Sizing
Leverage magnifies both profits and losses.
High leverage without proper position sizing leads to rapid capital erosion.
Professionals always calculate risk after leverage, not before.
Leverage should enhance efficiency, not increase recklessness.
13. Position Sizing and Drawdowns
Smaller position sizes reduce drawdowns.
Example:
10% drawdown requires ~11% recovery
50% drawdown requires 100% recovery
Position sizing keeps drawdowns shallow, making recovery realistic.
This is critical for long-term consistency.
14. Psychological Benefits of Proper Position Sizing
Reduces fear and emotional decision-making.
Helps traders stick to their plan during volatility.
Prevents overconfidence after winning streaks.
Minimizes panic during losing trades.
Supports disciplined execution.
15. Common Position Sizing Mistakes
Increasing size after losses (revenge trading).
Using the same size for all trades regardless of stop-loss.
Ignoring volatility differences.
Risking too much on “high-conviction” trades.
Overleveraging due to greed.
16. Scaling In and Scaling Out
Position sizing is not always static.
Scaling in:
Entering positions gradually.
Reduces timing risk.
Scaling out:
Booking partial profits.
Reduces emotional pressure.
Both techniques require careful size planning.
17. Position Sizing and Portfolio Risk
Risk must be managed at both:
Trade level
Portfolio level
Correlated trades increase hidden risk.
Example:
Multiple banking stocks = higher sector exposure.
Portfolio-level position sizing prevents concentration risk.
18. Long-Term Compounding Effect
Small, consistent gains with controlled risk lead to exponential growth.
Position sizing allows compounding without risking ruin.
Many successful traders focus more on risk control than returns.
19. Position Sizing for Beginners vs Professionals
Beginners:
Should risk less (0.25%–0.5%).
Focus on survival and learning.
Professionals:
Can optimize sizing using performance data.
Adjust size dynamically based on edge and conditions.
20. Conclusion
Position sizing is the foundation of profitable trading.
It determines how well a trader manages uncertainty.
A mediocre strategy with excellent position sizing often outperforms a great strategy with poor sizing.
Traders who master position sizing shift from guessing market direction to managing probabilities and risk.
In the long run, success is not about how much you make on winning trades—but how little you lose on losing ones.