
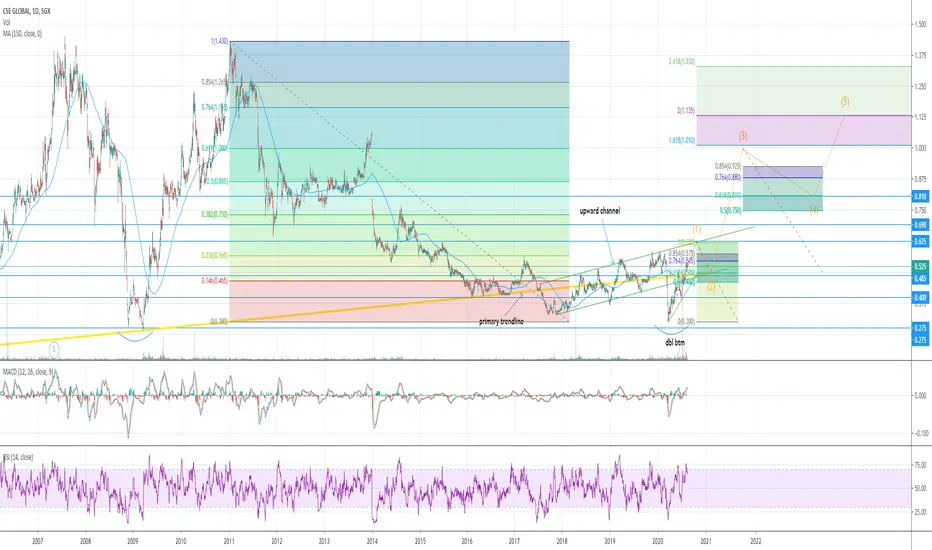
1. Trend Analysis
Downtrend
2. Indicator analysis
Weekly 150SMA
Increasing volume
overrated MACD ( Bearish)
Overbought RSI w low vol (bearish)
3. Trendline Analysis
Due to closure below primary trendline(yellow)
,buyers are afraid of entering as a major
drop may happen.
4..S&R Analysis
Support comes at Primary trendline (in yellow)
Resistance at upper channel line( in green)
5. Breakout Analysis
Elliot wave Charting with key fib in place and
predicted movement in orange
6. Pattern analysis
Recovery or reversal from double btm
Trading Plan (Impulsive Elliot wave)
Entry @ around 0.5 when it comes back from 0.625
Stop loss: weekly close below 0.4
TP(1):0.99 ~ 1
TP(2): 1.125
Pls DYODD
Downtrend
2. Indicator analysis
Weekly 150SMA
Increasing volume
overrated MACD ( Bearish)
Overbought RSI w low vol (bearish)
3. Trendline Analysis
Due to closure below primary trendline(yellow)
,buyers are afraid of entering as a major
drop may happen.
4..S&R Analysis
Support comes at Primary trendline (in yellow)
Resistance at upper channel line( in green)
5. Breakout Analysis
Elliot wave Charting with key fib in place and
predicted movement in orange
6. Pattern analysis
Recovery or reversal from double btm
Trading Plan (Impulsive Elliot wave)
Entry @ around 0.5 when it comes back from 0.625
Stop loss: weekly close below 0.4
TP(1):0.99 ~ 1
TP(2): 1.125
Pls DYODD

Declinazione di responsabilità
Le informazioni e le pubblicazioni non sono intese come, e non costituiscono, consulenza o raccomandazioni finanziarie, di investimento, di trading o di altro tipo fornite o approvate da TradingView. Per ulteriori informazioni, consultare i Termini di utilizzo.
Declinazione di responsabilità
Le informazioni e le pubblicazioni non sono intese come, e non costituiscono, consulenza o raccomandazioni finanziarie, di investimento, di trading o di altro tipo fornite o approvate da TradingView. Per ulteriori informazioni, consultare i Termini di utilizzo.