
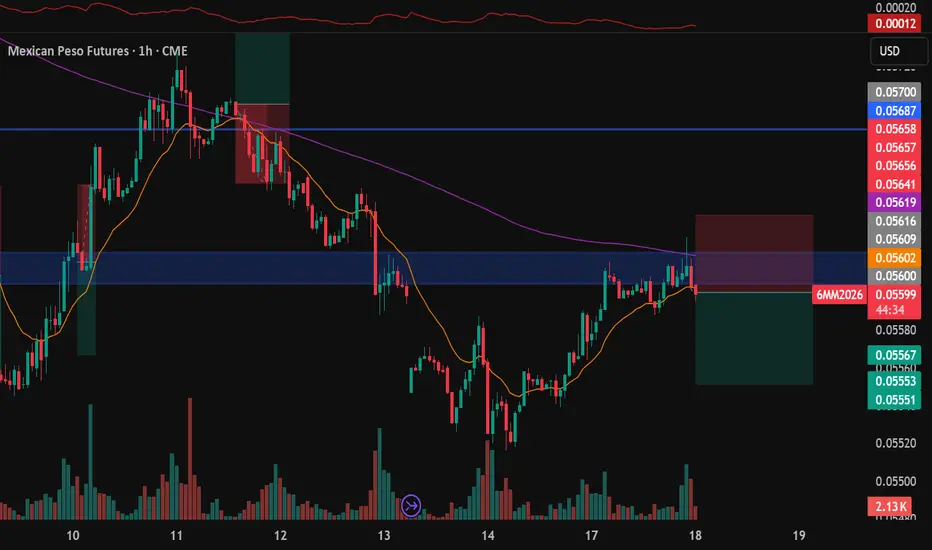
Price came back to an area of resistance that has been tested multiple times on the 4hr chart. Dropping to the 1hr chart to look for entries, there's a double top which is a bearish reversal pattern forming.On the second top, there's a hammer candle followed by a bearish engulfing candle that marks our entry. The volume on the hammer candle is very heavily bullish but the long wick on the hammer candle suggest that the bears has strong selling pressure and is pushing the price lower. Stops is 1 atr above the highs and aim for a 1.2RR although we can close some of the position first and let the trade ride to the bottom.

Declinazione di responsabilità
Le informazioni e le pubblicazioni non sono intese come, e non costituiscono, consulenza o raccomandazioni finanziarie, di investimento, di trading o di altro tipo fornite o approvate da TradingView. Per ulteriori informazioni, consultare i Termini di utilizzo.
Declinazione di responsabilità
Le informazioni e le pubblicazioni non sono intese come, e non costituiscono, consulenza o raccomandazioni finanziarie, di investimento, di trading o di altro tipo fornite o approvate da TradingView. Per ulteriori informazioni, consultare i Termini di utilizzo.