
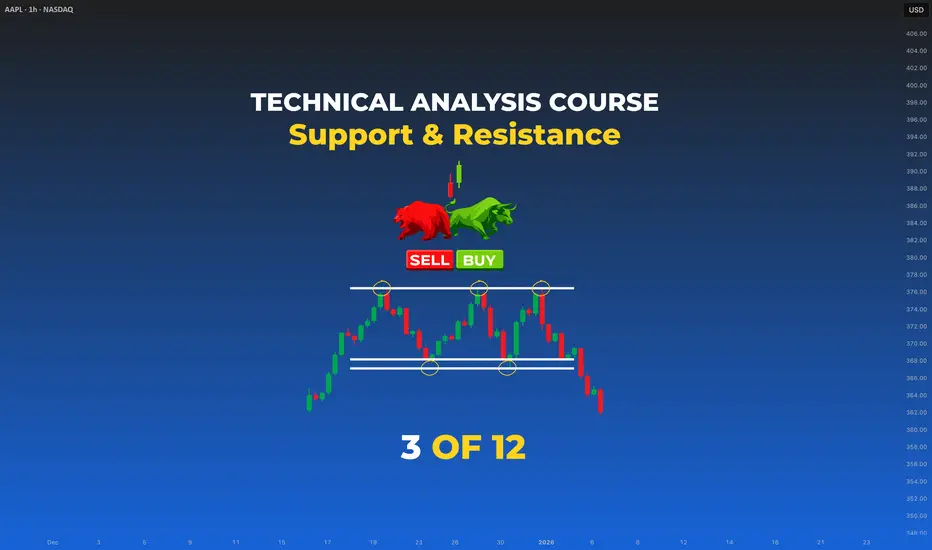
🐳 BIGBELUGA TRADING ROADMAP
Course 01 — Classical Technical Analysis · Lesson 3
Support & Resistance: The Levels Pros Actually Trade From
Difficulty: 🐳🐋🐋🐋🐋 (Beginner)
Support and Resistance are the most talked-about concept in trading — and the most misused. Most traders draw lines randomly and call them "key levels." Professionals draw fewer lines, but each one has a reason. This lesson shows you how to identify the levels that actually matter, rank their strength, and trade them with precision.

🔵 WHY SUPPORT & RESISTANCE IS THE BACKBONE OF EVERY STRATEGY
SMC, ICT, Elliott, Gann — every advanced school ultimately reduces to one core question: where will price react? That answer comes from Support and Resistance.
A level is not a magic wall. It is a memory zone — a place where buyers or sellers previously stepped in with enough force to flip the market. The market remembers, and that's why price keeps respecting these zones again and again.
🔵 1. STATIC HORIZONTAL LEVELS
The foundation. A horizontal level is drawn across price points where the market clearly reversed in the past.

Support = a price floor where buyers consistently step in.
Resistance = a price ceiling where sellers consistently step in.
How to identify a valid level:
🐳 Pro Tip: Support and Resistance is not a line — it is a zone. Use a rectangle, not a thin line. Markets react in areas, not at exact prices.
🔵 2. DYNAMIC LEVELS
Static levels are horizontal. Dynamic levels move with price.

Two main types of dynamic levels:
In an uptrend, dynamic levels = support. In a downtrend, dynamic levels = resistance.
🐳 Pro Tip: In strong trends, the 50 EMA is the institutional dynamic support. Watch how often pullbacks bottom there.
🔵 3. THE FLIP ZONE
The most powerful concept in S/R.

When a resistance gets broken with conviction, it often becomes support on the retest.
When a support gets broken with conviction, it often becomes resistance on the retest.
This is called the Flip Zone (or Polarity Switch).
Why it works: traders who shorted at the old resistance are now underwater. When price returns to that level, they exit at break-even — creating a wall of supply that holds. The reverse logic applies to broken support.
🐳 Pro Tip: The cleanest entries in your career will come from flip zone retests. Wait for the break + retest combo. Skip the chase.
🔵 4. RANKING LEVEL STRENGTH
Not all levels are equal. A level's strength is determined by four factors:

Strong level: 5+ touches over months on the Daily, with volume spikes at each rejection.
Weak level: 2 touches in the last few hours on a 15M chart, low volume.
🐳 Pro Tip: Before drawing any level, ask: would I see this same level on the higher timeframe? If yes — keep it. If no — delete it.
🔵 5. MULTI-TIMEFRAME S/R
The same price can be a level on multiple timeframes simultaneously. When it is, it becomes a high-probability zone.

The hierarchy:
Always identify Daily and Weekly levels first. Use lower timeframes only to refine entry.
🔵 6. HOW TO TRADE S/R LIKE A PRO
Buying at Support
Wait for price to reach a strong support zone and show a reversal candle (engulfing, pin bar). Enter on confirmation, stop beyond the zone, target the next opposite level.

Selling at Resistance
Same logic, mirrored. Wait for price to reach a strong resistance and show a reversal candle. Enter on confirmation, stop beyond the zone, target the next support.

Three valid entry approaches:
Universal rules:
🔵 7. COMMON BEGINNER MISTAKES
🔵 8. YOUR S/R FRAMEWORK
Before any trade, ask these four questions in order:
These four questions filter out 90% of bad S/R trades.
🔵 QUICK SELF-CHECK
🔵 WHAT IS NEXT
Lesson 4 — Price Channels: when support and resistance run parallel to each other on an angle, you get a channel — one of the cleanest setups in classical TA. We will cover ascending, descending, and horizontal channels, how to identify the trade-able phase, and how to spot the breakout.
Drop a comment: what's the strongest level you've watched price react to recently? Share the asset.
Best Regards, BigBeluga 🐳
Course 01 — Classical Technical Analysis · Lesson 3
Support & Resistance: The Levels Pros Actually Trade From
Difficulty: 🐳🐋🐋🐋🐋 (Beginner)
Support and Resistance are the most talked-about concept in trading — and the most misused. Most traders draw lines randomly and call them "key levels." Professionals draw fewer lines, but each one has a reason. This lesson shows you how to identify the levels that actually matter, rank their strength, and trade them with precision.
🔵 WHY SUPPORT & RESISTANCE IS THE BACKBONE OF EVERY STRATEGY
SMC, ICT, Elliott, Gann — every advanced school ultimately reduces to one core question: where will price react? That answer comes from Support and Resistance.
A level is not a magic wall. It is a memory zone — a place where buyers or sellers previously stepped in with enough force to flip the market. The market remembers, and that's why price keeps respecting these zones again and again.
🔵 1. STATIC HORIZONTAL LEVELS
The foundation. A horizontal level is drawn across price points where the market clearly reversed in the past.
Support = a price floor where buyers consistently step in.
Resistance = a price ceiling where sellers consistently step in.
How to identify a valid level:
- At least 2 clear reactions (rejections) at the same price
- Visible swing highs/lows the market respected
- Clean, obvious — if you have to squint, it's not a real level
🐳 Pro Tip: Support and Resistance is not a line — it is a zone. Use a rectangle, not a thin line. Markets react in areas, not at exact prices.
🔵 2. DYNAMIC LEVELS
Static levels are horizontal. Dynamic levels move with price.
Two main types of dynamic levels:
- Moving Averages (20, 50, 100, 200 EMA) — in a strong trend, price keeps respecting one of these MAs as moving support or resistance
- Trendlines — the rising/falling diagonal lines you learned in Lesson 2 also act as dynamic S/R
In an uptrend, dynamic levels = support. In a downtrend, dynamic levels = resistance.
🐳 Pro Tip: In strong trends, the 50 EMA is the institutional dynamic support. Watch how often pullbacks bottom there.
🔵 3. THE FLIP ZONE
The most powerful concept in S/R.
When a resistance gets broken with conviction, it often becomes support on the retest.
When a support gets broken with conviction, it often becomes resistance on the retest.
This is called the Flip Zone (or Polarity Switch).
Why it works: traders who shorted at the old resistance are now underwater. When price returns to that level, they exit at break-even — creating a wall of supply that holds. The reverse logic applies to broken support.
🐳 Pro Tip: The cleanest entries in your career will come from flip zone retests. Wait for the break + retest combo. Skip the chase.
🔵 4. RANKING LEVEL STRENGTH
Not all levels are equal. A level's strength is determined by four factors:
- Number of touches — more rejections = stronger level
- Time held — the longer a level holds, the more meaningful when it breaks
- Timeframe of origin — a Daily level is stronger than a 1H level
- Volume at the level — high volume on rejection = institutional presence
Strong level: 5+ touches over months on the Daily, with volume spikes at each rejection.
Weak level: 2 touches in the last few hours on a 15M chart, low volume.
🐳 Pro Tip: Before drawing any level, ask: would I see this same level on the higher timeframe? If yes — keep it. If no — delete it.
🔵 5. MULTI-TIMEFRAME S/R
The same price can be a level on multiple timeframes simultaneously. When it is, it becomes a high-probability zone.
The hierarchy:
- Weekly / Monthly levels — the strongest. Institutions place orders here.
- Daily levels — the working bias for swing traders.
- 4H / 1H levels — useful for entries and intraday structure.
- 15M / 5M levels — execution-only. Do not anchor a trade idea here.
Always identify Daily and Weekly levels first. Use lower timeframes only to refine entry.
🔵 6. HOW TO TRADE S/R LIKE A PRO
Buying at Support
Wait for price to reach a strong support zone and show a reversal candle (engulfing, pin bar). Enter on confirmation, stop beyond the zone, target the next opposite level.
Selling at Resistance
Same logic, mirrored. Wait for price to reach a strong resistance and show a reversal candle. Enter on confirmation, stop beyond the zone, target the next support.
Three valid entry approaches:
- Bounce trade — enter at the zone after a reversal candle confirms (the examples above)
- Break-and-retest — wait for a clean break + return to the flipped level
- Range trade — between two horizontal levels, sell the top, buy the bottom
Universal rules:
- Never enter at a level — wait for reaction
- Stop loss goes beyond the zone, never inside it
- Targets = the next opposite level
🔵 7. COMMON BEGINNER MISTAKES
- Drawing too many levels — clutter kills clarity
- Treating S/R as exact prices instead of zones
- Trading the first touch of a level without confirmation
- Ignoring the higher-timeframe level when entering on lower timeframes
- Confusing a wick rejection with a body close
- Trading INTO a strong opposing level (against the wall)
- Holding a position through a clean break — hoping it was a fakeout
🔵 8. YOUR S/R FRAMEWORK
Before any trade, ask these four questions in order:
- Where are the nearest Daily and Weekly levels?
- Is price approaching a level or already at one?
- Has the level been confirmed by a clean reaction, or am I guessing?
- Where would my stop go — and does the target justify the risk?
These four questions filter out 90% of bad S/R trades.
🔵 QUICK SELF-CHECK
- Draw the major Daily levels on any chart in under 60 seconds
- Identify a flip zone and explain why it works
- Rank two levels by strength using the 4 factors
- Read S/R across at least 3 timeframes
- Choose between bounce, break-and-retest, and range trade based on context
🔵 WHAT IS NEXT
Lesson 4 — Price Channels: when support and resistance run parallel to each other on an angle, you get a channel — one of the cleanest setups in classical TA. We will cover ascending, descending, and horizontal channels, how to identify the trade-able phase, and how to spot the breakout.
Drop a comment: what's the strongest level you've watched price react to recently? Share the asset.
Best Regards, BigBeluga 🐳

🌐 bigbeluga.org/tv - Get access to our powerful tools & indicators.
🔵 Learn More -> docs.bigbeluga.org/
🔵 Join Discord -> go.bigbeluga.org/k65q9bfqfu
All content provided by BigBeluga is for educational purposes only
🔵 Learn More -> docs.bigbeluga.org/
🔵 Join Discord -> go.bigbeluga.org/k65q9bfqfu
All content provided by BigBeluga is for educational purposes only
Declinazione di responsabilità
Le informazioni e le pubblicazioni non sono intese come, e non costituiscono, consulenza o raccomandazioni finanziarie, di investimento, di trading o di altro tipo fornite o approvate da TradingView. Per ulteriori informazioni, consultare i Termini di utilizzo.