
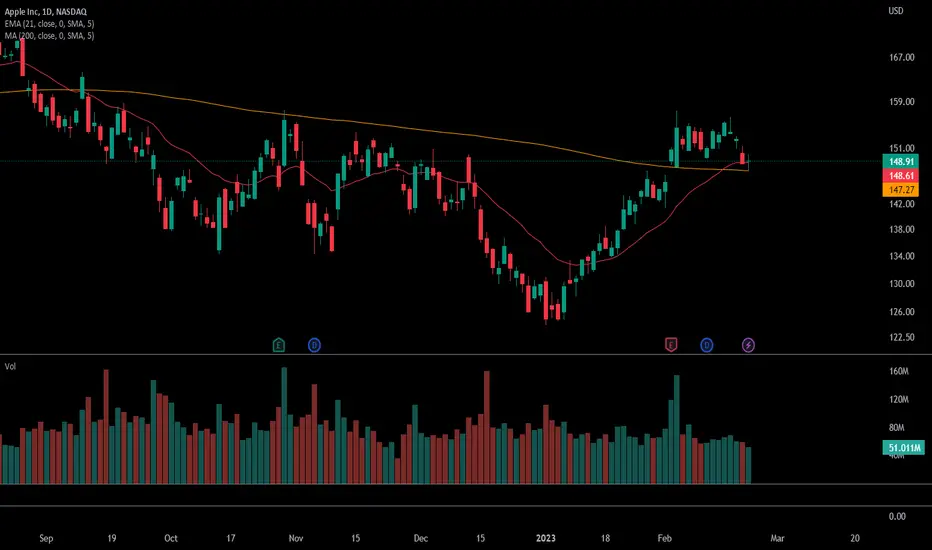
Yesterday's choppiness & market direction indecision in the tech sector can be summarized by this DOJI candle on the APPLE daily chart formed off the 200 day MA and closed just above the 21 EMA. Possible reversal to retest and break $150: LONG. Level of support of 146.75 area, break below: SHORT

Declinazione di responsabilità
Le informazioni e le pubblicazioni non sono intese come, e non costituiscono, consulenza o raccomandazioni finanziarie, di investimento, di trading o di altro tipo fornite o approvate da TradingView. Per ulteriori informazioni, consultare i Termini di utilizzo.
Declinazione di responsabilità
Le informazioni e le pubblicazioni non sono intese come, e non costituiscono, consulenza o raccomandazioni finanziarie, di investimento, di trading o di altro tipo fornite o approvate da TradingView. Per ulteriori informazioni, consultare i Termini di utilizzo.