
Price is trapped inside a triangle, but the shorts are louder
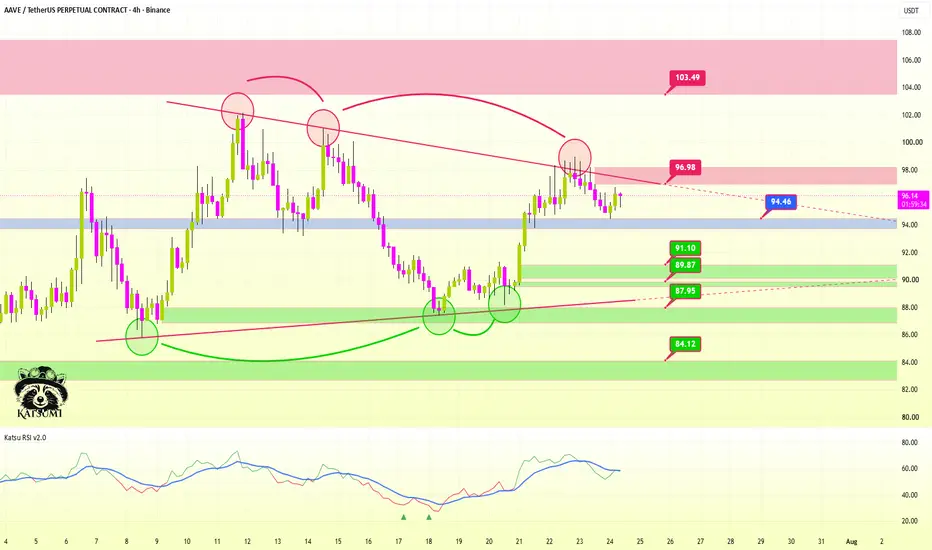
Katsu on the Bridge. The AAVE stealth ship is visible on the central radar. On the AAVE 4H chart, we are seeing a very interesting, but also quite tricky structure. This is not a clean trend. It is a narrowing structure where price is trying to make a decision inside an increasingly smaller space. On the chart, we can see lower highs and higher lows. If we connect them, a triangle-like pattern appears.
By itself, this is a neutral pattern.
- It does not say that we will definitely go up.
- It also does not say that we will definitely break down.
The triangle only says that a decision is coming, or at least that a decision is needed. When a triangle keeps tightening for a long time, faster movement often follows in one direction.

What Do I See on the Chart?
There are multiple rejections from the upper trendline. Price has tried to move higher several times, but each time selling pressure appeared. This is very important to me. Around the red circles on the chart, we can clearly see that the market rejected the move again and again near the upper trendline. At the same time, buyers also appeared near the green circles below, so it is not like AAVE is completely dead. Buyers and sellers are both defending certain zones.
However, near the upper resistance areas, the bearish reactions have looked stronger so far. The blue candles also show that the short side appeared with more strength several times.
This does not mean that we will definitely break down, but it does mean that I would not try to play hero with longs near the upper trendline.
Important Zones
Bearish Order Blocks / Resistance
96.98 - This is the nearby red 1H bearish Order Block. Compared to the current price, this is the first more serious resistance zone. If price moves back into this area but cannot break through and hold it, another rejection could easily come from here.
103.49 - This is a higher and stronger bearish zone. If AAVE reaches this area, I think many traders would become bullish again. That is exactly why it can be dangerous. This zone may be suitable for collecting late longs, and if there is no real strength, price could then reverse from there.
Supports / Bullish Order Blocks
94.46 - This is the blue zone. I would not call it an extremely strong support, but I would definitely watch it. Right now, this is one of the most important short-term decision points. If price loses this level, it can easily start moving lower, because the market may collect the stop losses of late longs sitting around the FVG. And if those stop losses get triggered, the move can accelerate.
91.10 - 89.87 - This is the nearby green 1H bullish Order Block zone. If the blue support fails, I think this could be the first more serious target to the downside. Here I would already watch for buyer reaction, because this zone could be suitable for a bounce.
87.95 - This is a deeper green reaction area, close to the lower trendline of the triangle. If price drifts down this far, it will become much more important to see whether buyers can actually defend the structure.
84.12 - This is a deeper bullish Order Block / defensive zone. If this area comes into play, it would likely mean that the lower side of the triangle has been damaged, and the market has started pricing in a larger bearish move.
What the Triangle Means The triangle is important because both sides have arguments.
On the bullish side:
Volume and RSI
Based on volume, I do not see clean buying strength that would make me blindly bullish. There were buyer reactions, but selling pressure is more visible near the upper zones.
The RSI is around the middle range, near 57. It is slightly bullish, but there is no extreme overbought or oversold condition. This also shows that the market has not decided yet.
There is movement. there is reaction, but there is no clear trend command. In this kind of situation, the biggest mistake is to project onto the chart what we want to see.
The market has not declared the direction yet.
It is only preparing for it.
The Battle Plan
For me, there are now two important decision points. One is above, around the red OB near 96.98. The other is below, around the blue support near 94.46.
If price moves back toward 96.98 but gets rejected again, then a downside attempt becomes more likely. But if price reclaims the 96.98 zone and can hold above it on the 4H timeframe, then the short-side picture weakens, and a move toward 103.49 may come.
To the downside, losing 94.46 would be the important signal. If price closes clearly below it, it may easily trigger the stop losses of late longs, and the move could slide toward 91.10 - 89.87.
Long Battle Plan - From Bullish OB Defense
On the long side, I would not try to play hero at the top of the triangle. The better long can come either from the blue support holding or from a deeper green OB.
Long Setup 1 - After Holding 94.46
This is the more aggressive long plan. It comes into play if AAVE holds the blue zone around 94.46 and gives a bullish reaction on the lower timeframe.
What I want to see:
Possible Long Plan
Long Setup 2 - From the Deeper Green OB
This would be the cleaner smart money long for me. If 94.46 fails, I would not immediately look for a long. I would rather wait to see whether price moves down to the next green Order Block zone.
The area I am watching: 91.10 - 89.87
What I would look for:
Possible Long Plan
Short Battle Plan - From Bearish OB Rejection
On the short side, the nearby red OB around 96.98 is the most important level right now. This is the zone where selling pressure has appeared several times already, and where the upper trendline is also putting pressure on price.
Short Setup 1 - 96.98 OB Rejection
I would look for a short if price moves back toward the 96.98 zone but starts weakening there.
What I want to see:
Possible Short Plan
Short Setup 2 - After Losing the Blue Support
This is the momentum short version. It comes into play if price does not even move up to 96.98, but simply loses the blue support around 94.46. In that case, the market can easily collect the stop losses of late longs sitting around the FVG, and the move may accelerate lower.
What I would look for:
Possible Short Plan
What Am I Watching Closely Now?
Does the blue zone around 94.46 hold price, or do they let it go? If it holds, another attempt toward 96.98 may come. If 96.98 gets reclaimed, the upper triangle trendline may be damaged, and a stronger upside move toward 100 - 103.49 could follow.
But if 94.46 fails, the short scenario can activate quickly, and price may slide toward 91.10 - 89.87.
This is not financial advice. The raccoon was simply thinking out loud about JUP today.
I wrote down what I see, what I think, and how I would trade it.
Then either I am right... or we learn from it. :))
IMPORTANT!
The entry prices and stop-loss levels are not set in stone. These are my own plans, and I share them only to teach the thinking process behind the setup. Never enter a trade blindly just because someone said so. Check it, verify it, and make your own decision. This is exactly how I explain it to my students as well, because this way the logic is easier to follow, and it becomes clearer what I actually mean when I talk about Order Blocks.
Katsu on the Bridge. The AAVE stealth ship is visible on the central radar. On the AAVE 4H chart, we are seeing a very interesting, but also quite tricky structure. This is not a clean trend. It is a narrowing structure where price is trying to make a decision inside an increasingly smaller space. On the chart, we can see lower highs and higher lows. If we connect them, a triangle-like pattern appears.
By itself, this is a neutral pattern.
- It does not say that we will definitely go up.
- It also does not say that we will definitely break down.
The triangle only says that a decision is coming, or at least that a decision is needed. When a triangle keeps tightening for a long time, faster movement often follows in one direction.
What Do I See on the Chart?
There are multiple rejections from the upper trendline. Price has tried to move higher several times, but each time selling pressure appeared. This is very important to me. Around the red circles on the chart, we can clearly see that the market rejected the move again and again near the upper trendline. At the same time, buyers also appeared near the green circles below, so it is not like AAVE is completely dead. Buyers and sellers are both defending certain zones.
However, near the upper resistance areas, the bearish reactions have looked stronger so far. The blue candles also show that the short side appeared with more strength several times.
This does not mean that we will definitely break down, but it does mean that I would not try to play hero with longs near the upper trendline.
Important Zones
Bearish Order Blocks / Resistance
96.98 - This is the nearby red 1H bearish Order Block. Compared to the current price, this is the first more serious resistance zone. If price moves back into this area but cannot break through and hold it, another rejection could easily come from here.
103.49 - This is a higher and stronger bearish zone. If AAVE reaches this area, I think many traders would become bullish again. That is exactly why it can be dangerous. This zone may be suitable for collecting late longs, and if there is no real strength, price could then reverse from there.
Supports / Bullish Order Blocks
94.46 - This is the blue zone. I would not call it an extremely strong support, but I would definitely watch it. Right now, this is one of the most important short-term decision points. If price loses this level, it can easily start moving lower, because the market may collect the stop losses of late longs sitting around the FVG. And if those stop losses get triggered, the move can accelerate.
91.10 - 89.87 - This is the nearby green 1H bullish Order Block zone. If the blue support fails, I think this could be the first more serious target to the downside. Here I would already watch for buyer reaction, because this zone could be suitable for a bounce.
87.95 - This is a deeper green reaction area, close to the lower trendline of the triangle. If price drifts down this far, it will become much more important to see whether buyers can actually defend the structure.
84.12 - This is a deeper bullish Order Block / defensive zone. If this area comes into play, it would likely mean that the lower side of the triangle has been damaged, and the market has started pricing in a larger bearish move.
What the Triangle Means The triangle is important because both sides have arguments.
On the bullish side:
- we have higher lows
- buyers defended the lower zones several times
- price has not broken down from the structure yet
- the zone around 94.46 is still holding
- we see lower highs
- there have been multiple rejections from the upper trendline
- we are still below the red 1H Order Blocks
- bearish reactions have looked stronger so far
- losing the blue support could accelerate the move lower
Volume and RSI
Based on volume, I do not see clean buying strength that would make me blindly bullish. There were buyer reactions, but selling pressure is more visible near the upper zones.
The RSI is around the middle range, near 57. It is slightly bullish, but there is no extreme overbought or oversold condition. This also shows that the market has not decided yet.
There is movement. there is reaction, but there is no clear trend command. In this kind of situation, the biggest mistake is to project onto the chart what we want to see.
The market has not declared the direction yet.
It is only preparing for it.
The Battle Plan
For me, there are now two important decision points. One is above, around the red OB near 96.98. The other is below, around the blue support near 94.46.
If price moves back toward 96.98 but gets rejected again, then a downside attempt becomes more likely. But if price reclaims the 96.98 zone and can hold above it on the 4H timeframe, then the short-side picture weakens, and a move toward 103.49 may come.
To the downside, losing 94.46 would be the important signal. If price closes clearly below it, it may easily trigger the stop losses of late longs, and the move could slide toward 91.10 - 89.87.
Long Battle Plan - From Bullish OB Defense
On the long side, I would not try to play hero at the top of the triangle. The better long can come either from the blue support holding or from a deeper green OB.
Long Setup 1 - After Holding 94.46
This is the more aggressive long plan. It comes into play if AAVE holds the blue zone around 94.46 and gives a bullish reaction on the lower timeframe.
What I want to see:
- price wicks into or retests the area around 94.46
- it does not close strongly below it
- a rejection candle appears
- bullish ChoCh forms on the lower timeframe
- after the retest, the zone holds as support
Possible Long Plan
- Entry: 94.50 - 95.20, after confirmation
- Stop Loss: below 93.80
- TP1: 96.98
- TP2: 100.00 - 101.00
- TP3: 103.49
Long Setup 2 - From the Deeper Green OB
This would be the cleaner smart money long for me. If 94.46 fails, I would not immediately look for a long. I would rather wait to see whether price moves down to the next green Order Block zone.
The area I am watching: 91.10 - 89.87
What I would look for:
- price slowly drifts or wicks into the 91.10 - 89.87 zone
- local liquidity gets swept
- a strong rejection candle appears
- bullish ChoCh forms on the lower timeframe
- price holds the zone after the retest
Possible Long Plan
- Entry: 91.10 - 89.90, after confirmation
- Stop Loss: below 87.80
- TP1: 94.46
- TP2: 96.98
- TP3: 100.00 - 103.49
Short Battle Plan - From Bearish OB Rejection
On the short side, the nearby red OB around 96.98 is the most important level right now. This is the zone where selling pressure has appeared several times already, and where the upper trendline is also putting pressure on price.
Short Setup 1 - 96.98 OB Rejection
I would look for a short if price moves back toward the 96.98 zone but starts weakening there.
What I want to see:
- price bounces into the 96.50 - 97.20 area
- momentum slows down there
- a rejection wick appears
- bearish ChoCh forms on the lower timeframe
- price falls back below 94.46
- it fails to reclaim it on the retest
Possible Short Plan
- Entry: 96.50 - 97.20, after confirmation
- Stop Loss: above 98.20
- TP1: 94.46
- TP2: 91.10 - 89.87
- TP3: 87.95
Short Setup 2 - After Losing the Blue Support
This is the momentum short version. It comes into play if price does not even move up to 96.98, but simply loses the blue support around 94.46. In that case, the market can easily collect the stop losses of late longs sitting around the FVG, and the move may accelerate lower.
What I would look for:
- 4H close below 94.46
- retest from below
- previous support turns into resistance
- bearish continuation on the lower timeframe
- rising volume during the drop
Possible Short Plan
- Entry: 94.20 - 94.60, after a failed reclaim
- Stop Loss: above 95.50
- TP1: 91.10
- TP2: 89.87
- TP3: 87.95
What Am I Watching Closely Now?
Does the blue zone around 94.46 hold price, or do they let it go? If it holds, another attempt toward 96.98 may come. If 96.98 gets reclaimed, the upper triangle trendline may be damaged, and a stronger upside move toward 100 - 103.49 could follow.
But if 94.46 fails, the short scenario can activate quickly, and price may slide toward 91.10 - 89.87.
This is not financial advice. The raccoon was simply thinking out loud about JUP today.
I wrote down what I see, what I think, and how I would trade it.
Then either I am right... or we learn from it. :))
IMPORTANT!
The entry prices and stop-loss levels are not set in stone. These are my own plans, and I share them only to teach the thinking process behind the setup. Never enter a trade blindly just because someone said so. Check it, verify it, and make your own decision. This is exactly how I explain it to my students as well, because this way the logic is easier to follow, and it becomes clearer what I actually mean when I talk about Order Blocks.

Magyar Discord Szerver. Oktatás, elemzés, scriptek mind egy helyen -> itt minden infót megtalálsz -> trackmirror.eu
Declinazione di responsabilità
Le informazioni e le pubblicazioni non sono intese come, e non costituiscono, consulenza o raccomandazioni finanziarie, di investimento, di trading o di altro tipo fornite o approvate da TradingView. Per ulteriori informazioni, consultare i Termini di utilizzo.
Magyar Discord Szerver. Oktatás, elemzés, scriptek mind egy helyen -> itt minden infót megtalálsz -> trackmirror.eu
Declinazione di responsabilità
Le informazioni e le pubblicazioni non sono intese come, e non costituiscono, consulenza o raccomandazioni finanziarie, di investimento, di trading o di altro tipo fornite o approvate da TradingView. Per ulteriori informazioni, consultare i Termini di utilizzo.