Long
$AAWW daily chart
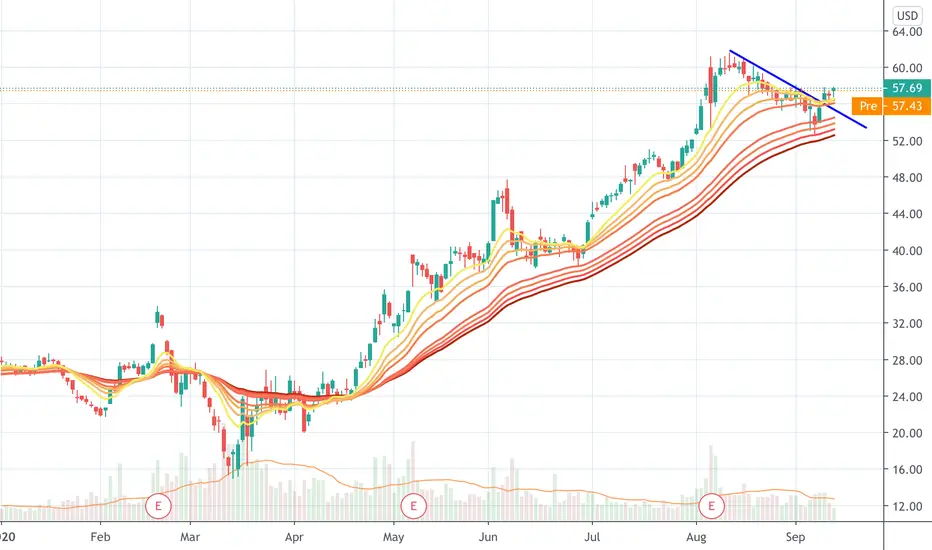
AAAWW daily chart held the 50EMA and bounced all the way back above the 20EMA
Sector shows relative strength in the past 2 sessions
Price closed above downtrend line , above 20EMA and we had the 5/10 EMA cross up yesterday
A push above 58$ could see this squeezed to ATH area above 60$
Good luck,
TA
Sector shows relative strength in the past 2 sessions
Price closed above downtrend line , above 20EMA and we had the 5/10 EMA cross up yesterday
A push above 58$ could see this squeezed to ATH area above 60$
Good luck,
TA

Declinazione di responsabilità
Le informazioni e le pubblicazioni non sono intese come, e non costituiscono, consulenza o raccomandazioni finanziarie, di investimento, di trading o di altro tipo fornite o approvate da TradingView. Per ulteriori informazioni, consultare i Termini di utilizzo.
Declinazione di responsabilità
Le informazioni e le pubblicazioni non sono intese come, e non costituiscono, consulenza o raccomandazioni finanziarie, di investimento, di trading o di altro tipo fornite o approvate da TradingView. Per ulteriori informazioni, consultare i Termini di utilizzo.