
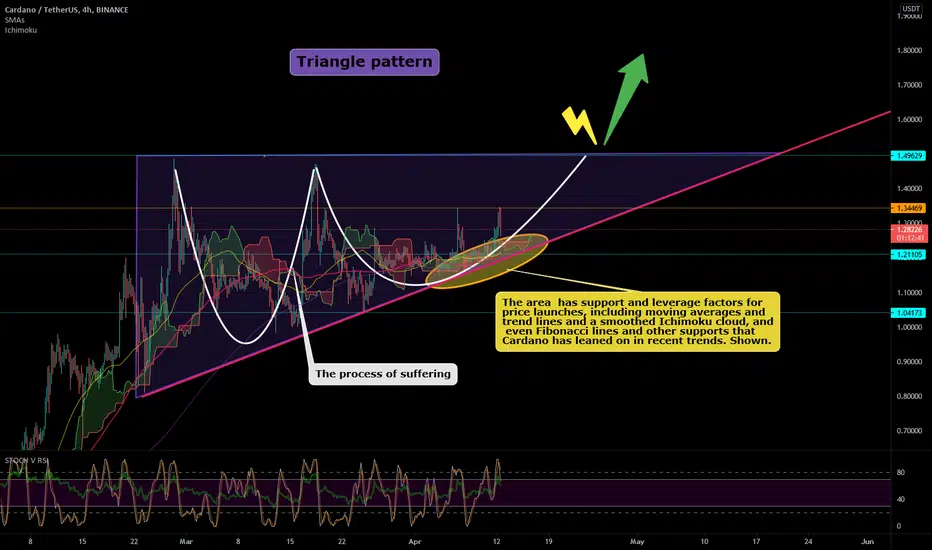
Triangle pattern is a tool to fly the price of Cardano
As you can see in the chart, the Cardano trend is a triangle that prepares to break the triangle and create a completely uptrend.
In this way, Cardano prepares himself to achieve higher goals.
The area shown in yellow has the support and leverage to push prices, including moving averages and trend lines and the smoothed Ichimoku cloud, and even Fibonacci lines and other supports that Cardano has leaned on in recent trends. Shown. This range will have the power to raise the price to the top of the triangle, but can not guarantee the continuation of the upward trend, but we are optimistic that the triangle pattern will be broken in Cardano's third attempt.
As you can see in the chart, the Cardano trend is a triangle that prepares to break the triangle and create a completely uptrend.
In this way, Cardano prepares himself to achieve higher goals.
The area shown in yellow has the support and leverage to push prices, including moving averages and trend lines and the smoothed Ichimoku cloud, and even Fibonacci lines and other supports that Cardano has leaned on in recent trends. Shown. This range will have the power to raise the price to the top of the triangle, but can not guarantee the continuation of the upward trend, but we are optimistic that the triangle pattern will be broken in Cardano's third attempt.

Declinazione di responsabilità
Le informazioni e le pubblicazioni non sono intese come, e non costituiscono, consulenza o raccomandazioni finanziarie, di investimento, di trading o di altro tipo fornite o approvate da TradingView. Per ulteriori informazioni, consultare i Termini di utilizzo.
Declinazione di responsabilità
Le informazioni e le pubblicazioni non sono intese come, e non costituiscono, consulenza o raccomandazioni finanziarie, di investimento, di trading o di altro tipo fornite o approvate da TradingView. Per ulteriori informazioni, consultare i Termini di utilizzo.