
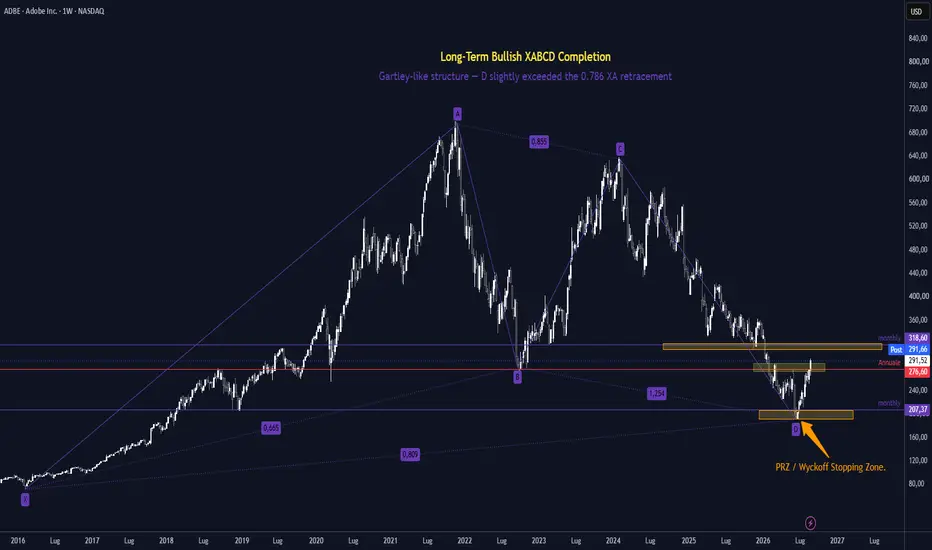
🟣 Adobe is testing a technically important transition after completing a long-term bullish XABCD structure inside the $185.82–$207.37 area.
The Weekly harmonic relationships are:
• XAB: 0.665
• ABC: 0.855
• BCD: 1.254
• XAD: 0.809
• CD ≈ 1.07 × AB
This is better classified as a Gartley-like structure than a textbook Gartley.
The canonical 0.618 retracement at B was exceeded, while D moved slightly beyond the ideal 0.786 XA completion. However, the 1.254 BC projection remained close to 1.27, and the structure completed without violating X.
The harmonic pattern therefore provides a zone of confluence rather than a standalone reversal signal.
🔎 Wyckoff response
On the Daily timeframe, the decline into $185.82–$207.37 produced a significant expansion in price spread and volume.
Because this movement established the lower boundary of the subsequent trading range, I classify it as a potential Selling Climax / Stopping Action rather than a textbook Spring.
The subsequent sequence developed as follows:
• Automatic Rally
• Secondary Test near the lower boundary
• Sign of Strength above $245.02
• Potential Last Point of Support
• Second Sign of Strength through $276.60
Price is now trading around $291.50, above the former $276.60 resistance area.
⚖️ Scenario map
Bullish continuation remains conditional on acceptance:
• Holding above $276–280 would preserve the potential Phase D structure
• A controlled retest could develop into a higher-order LPS
• $306.70–$318.60 represents the next major supply and confirmation area
• Acceptance above this zone would strengthen the broader reversal thesis
• A return below $245.02 would weaken the Phase D interpretation
• Losing $207.37, particularly $185.82, would invalidate the accumulation thesis
The harmonic structure defined the location. Wyckoff revealed the market’s response within that location.
Scenario-based analysis, not a trade signal.
The Weekly harmonic relationships are:
• XAB: 0.665
• ABC: 0.855
• BCD: 1.254
• XAD: 0.809
• CD ≈ 1.07 × AB
This is better classified as a Gartley-like structure than a textbook Gartley.
The canonical 0.618 retracement at B was exceeded, while D moved slightly beyond the ideal 0.786 XA completion. However, the 1.254 BC projection remained close to 1.27, and the structure completed without violating X.
The harmonic pattern therefore provides a zone of confluence rather than a standalone reversal signal.
🔎 Wyckoff response
On the Daily timeframe, the decline into $185.82–$207.37 produced a significant expansion in price spread and volume.
Because this movement established the lower boundary of the subsequent trading range, I classify it as a potential Selling Climax / Stopping Action rather than a textbook Spring.
The subsequent sequence developed as follows:
• Automatic Rally
• Secondary Test near the lower boundary
• Sign of Strength above $245.02
• Potential Last Point of Support
• Second Sign of Strength through $276.60
Price is now trading around $291.50, above the former $276.60 resistance area.
⚖️ Scenario map
Bullish continuation remains conditional on acceptance:
• Holding above $276–280 would preserve the potential Phase D structure
• A controlled retest could develop into a higher-order LPS
• $306.70–$318.60 represents the next major supply and confirmation area
• Acceptance above this zone would strengthen the broader reversal thesis
• A return below $245.02 would weaken the Phase D interpretation
• Losing $207.37, particularly $185.82, would invalidate the accumulation thesis
The harmonic structure defined the location. Wyckoff revealed the market’s response within that location.
Scenario-based analysis, not a trade signal.

Declinazione di responsabilità
Le informazioni e le pubblicazioni non sono intese come, e non costituiscono, consulenza o raccomandazioni finanziarie, di investimento, di trading o di altro tipo fornite o approvate da TradingView. Per ulteriori informazioni, consultare i Termini di utilizzo.
Declinazione di responsabilità
Le informazioni e le pubblicazioni non sono intese come, e non costituiscono, consulenza o raccomandazioni finanziarie, di investimento, di trading o di altro tipo fornite o approvate da TradingView. Per ulteriori informazioni, consultare i Termini di utilizzo.