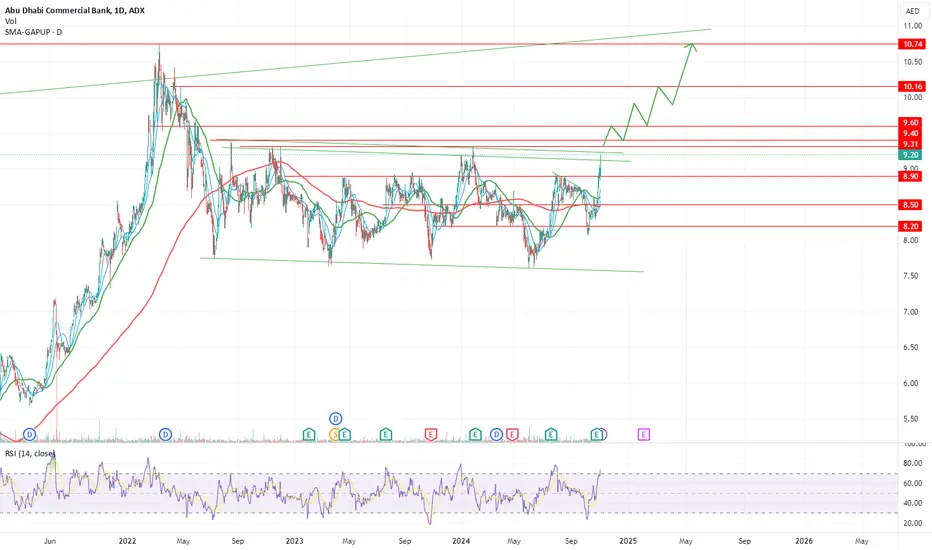
 ADCB chart is amazing! More than two years of consolidation and now the stock seems to be ready to move forward. This is a long term buy and targets are higher than the levels shown on the chart, the anticipated price movement shown on the chart should unfold in the coming 6 to 12 months if the stock breaks above the level 9.31~9.4 AED. Stoploss daily close below 8.8 AED.
 Trade chiuso: obiettivo raggiunto

Declinazione di responsabilità
Le informazioni e le pubblicazioni non sono intese come, e non costituiscono, consulenza o raccomandazioni finanziarie, di investimento, di trading o di altro tipo fornite o approvate da TradingView. Per ulteriori informazioni, consultare i Termini di utilizzo.
Declinazione di responsabilità
Le informazioni e le pubblicazioni non sono intese come, e non costituiscono, consulenza o raccomandazioni finanziarie, di investimento, di trading o di altro tipo fornite o approvate da TradingView. Per ulteriori informazioni, consultare i Termini di utilizzo.