
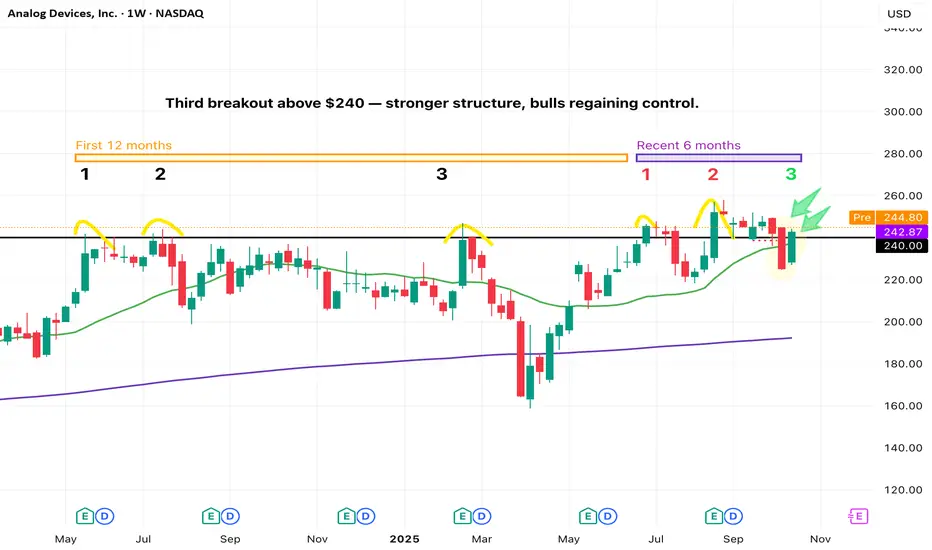
NASDAQ: ADI (Analog Devices) has been consolidating for about a year and a half since May last year. During this period, the $240 level has acted as a major psychological and structural resistance zone.
Over the past year, price has tested this level three times — yet none of the weekly candles managed to close above $240, each time retreating shortly after. This showed consistent selling pressure at that zone.
In recent months, however, the price action has started to shift.
* First Breakout (June 30): ADI closed above $240 after a three-month rally, but the move lacked a proper pullback or base formation. Price failed to hold above the breakout level afterward.
* Second Breakout (August 18): A second attempt after a month of mild consolidation also failed to sustain above $240, signaling insufficient buying momentum.
* Third Breakout (October 6): Last week’s weekly candle finally closed at $242.87, about $2.87 above the key resistance, marking a third breakout attempt — and this time, the setup looks technically healthier.
The latest two weekly candles formed a clear “break and reclaim” pattern: 1. The first candle broke below the $240 level and tested the 20-week SMA. 2. The following candle reclaimed both the SMA 20 and the $240 level in one strong move.
This indicates that the market successfully retested short-term support and regained strength quickly — completing a constructive pullback within just two weeks.
In summary:
* $240 remains the key line in the sand.
* The third breakout shows stronger technical structure (with retest + reclaim).
* If price can continue holding above $240 with increasing volume, ADI could be entering a renewed uptrend phase following its long consolidation.
Over the past year, price has tested this level three times — yet none of the weekly candles managed to close above $240, each time retreating shortly after. This showed consistent selling pressure at that zone.
In recent months, however, the price action has started to shift.
* First Breakout (June 30): ADI closed above $240 after a three-month rally, but the move lacked a proper pullback or base formation. Price failed to hold above the breakout level afterward.
* Second Breakout (August 18): A second attempt after a month of mild consolidation also failed to sustain above $240, signaling insufficient buying momentum.
* Third Breakout (October 6): Last week’s weekly candle finally closed at $242.87, about $2.87 above the key resistance, marking a third breakout attempt — and this time, the setup looks technically healthier.
The latest two weekly candles formed a clear “break and reclaim” pattern: 1. The first candle broke below the $240 level and tested the 20-week SMA. 2. The following candle reclaimed both the SMA 20 and the $240 level in one strong move.
This indicates that the market successfully retested short-term support and regained strength quickly — completing a constructive pullback within just two weeks.
In summary:
* $240 remains the key line in the sand.
* The third breakout shows stronger technical structure (with retest + reclaim).
* If price can continue holding above $240 with increasing volume, ADI could be entering a renewed uptrend phase following its long consolidation.

Declinazione di responsabilità
Le informazioni e le pubblicazioni non sono intese come, e non costituiscono, consulenza o raccomandazioni finanziarie, di investimento, di trading o di altro tipo fornite o approvate da TradingView. Per ulteriori informazioni, consultare i Termini di utilizzo.
Declinazione di responsabilità
Le informazioni e le pubblicazioni non sono intese come, e non costituiscono, consulenza o raccomandazioni finanziarie, di investimento, di trading o di altro tipo fornite o approvate da TradingView. Per ulteriori informazioni, consultare i Termini di utilizzo.