
A trading strategy should not depend on one coin, one timeframe, or one perfect-looking chart. What matters is understanding the price behaviour behind the setup.
In the previous article, we introduced the Fake Breakout strategy using JUPUSDT. If you missed it, you can read it here:

Previous Article: Fake Breakout — When a Breakout Becomes a Trap
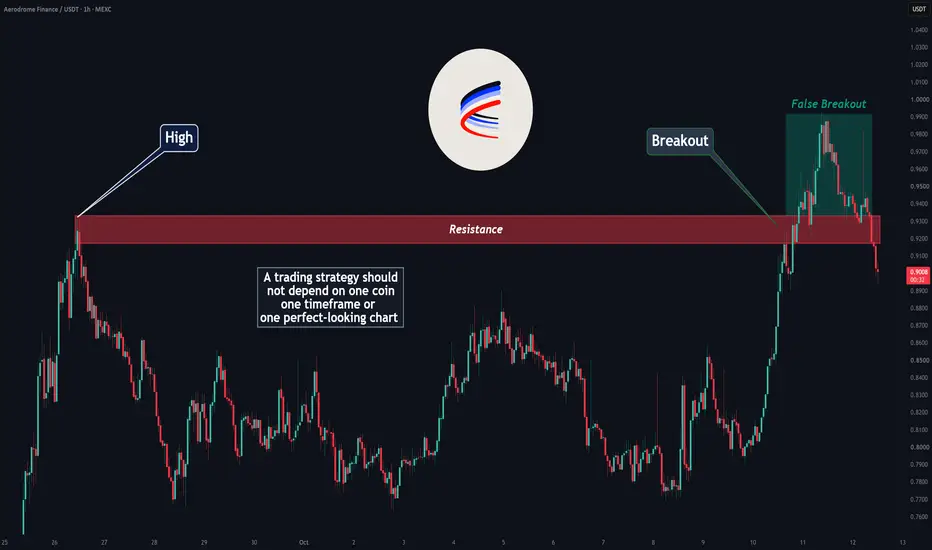
This time, let’s look at another example: AEROUSDT on the 1-hour chart.
The goal is not to predict every move or present a perfect trade. We want to recognise the sequence that can turn an apparent breakout into a potential trading opportunity.
Step 1 — Identify the Resistance
First, we have a resistance level that price has struggled to break. Eventually, price moves above it.

At this point, we do not yet have a fake breakout. A genuine breakout can lead to a strong continuation, and entering against it too early can be costly.
The important thing is to observe what happens next.
Step 2 — Price Returns Below Resistance
After several candles, price moves back below the level it had just broken.

This changes the situation.
Traders who bought the breakout may now find themselves in losing positions. Some may close their trades, while others may be forced out as selling pressure increases.
That is why a failed breakout can create an opportunity in the opposite direction.
Step 3 — Recognise the Fake Breakout
What About Stop Loss and Take Profit?
Is This Strategy Limited to Certain Charts?
No. The same price behaviour can appear across different assets and timeframes.
That does not mean it works equally well everywhere.
Lower timeframes can contain more noise and false signals. Strong trends can also continue after a breakout despite an initial rejection.
The goal is not to find a pattern on every chart; it is to recognise when the conditions are clear enough to consider a trade.
What do you think? Should we continue this educational series?
Would you like the next article to explain SL and TP placement, different entry methods, and the situations in which a fake breakout is more likely to fail?
This article is for educational purposes only and is not financial advice. Fake breakouts can fail, and trading involves the risk of loss. Always define your risk before entering a position.
In the previous article, we introduced the Fake Breakout strategy using JUPUSDT. If you missed it, you can read it here:
Previous Article: Fake Breakout — When a Breakout Becomes a Trap
This time, let’s look at another example: AEROUSDT on the 1-hour chart.
The goal is not to predict every move or present a perfect trade. We want to recognise the sequence that can turn an apparent breakout into a potential trading opportunity.
Step 1 — Identify the Resistance
First, we have a resistance level that price has struggled to break. Eventually, price moves above it.
- — AERO breaks above resistance
At this point, we do not yet have a fake breakout. A genuine breakout can lead to a strong continuation, and entering against it too early can be costly.
The important thing is to observe what happens next.
Step 2 — Price Returns Below Resistance
After several candles, price moves back below the level it had just broken.
- — Price falls back below the broken resistance
This changes the situation.
Traders who bought the breakout may now find themselves in losing positions. Some may close their trades, while others may be forced out as selling pressure increases.
That is why a failed breakout can create an opportunity in the opposite direction.
Step 3 — Recognise the Fake Breakout
Once price has broken above resistance and then returned below it, we have the basic structure of a bearish fake breakout.
However, the pattern alone is not a guarantee. The quality of the level, the speed of the rejection, the candle closes, the broader market structure, and the space available before the next support all matter.
A trader might wait for additional bearish confirmation or a retest of the failed breakout level before considering an entry. The objective is to avoid treating every move back below resistance as an automatic sell signal.
What About Stop Loss and Take Profit?
For this example, the exact SL and TP levels are not the focus. We are studying the entry concept first.In a practical trade, however, risk management cannot be separated from the strategy. A stop loss needs to be placed where the trade idea is invalidated, while the target should account for the next meaningful support area and the available risk-to-reward ratio.
A setup may look attractive but still be unsuitable if the next support is too close, the invalidation level is too far away, or the potential reward does not justify the risk.
We can cover these details in the next part of this series with simple chart examples, including different entry methods, stop-loss placement, target selection, and situations where the setup should be avoided.
Is This Strategy Limited to Certain Charts?
No. The same price behaviour can appear across different assets and timeframes.
That does not mean it works equally well everywhere.
Lower timeframes can contain more noise and false signals. Strong trends can also continue after a breakout despite an initial rejection.
The goal is not to find a pattern on every chart; it is to recognise when the conditions are clear enough to consider a trade.
What do you think? Should we continue this educational series?
Would you like the next article to explain SL and TP placement, different entry methods, and the situations in which a fake breakout is more likely to fail?
Share your thoughts in the comments. Your feedback will help us make these lessons more practical and easier to apply.
This article is for educational purposes only and is not financial advice. Fake breakouts can fail, and trading involves the risk of loss. Always define your risk before entering a position.

✨ Learn • Analyze • Trade
📊 Free Analysis for Crypto • Forex • Gold
t.me/pullbacksignal
🎯 Price Action & Market Structure
📚 Trading Education & Market Insights
📊 Free Analysis for Crypto • Forex • Gold
t.me/pullbacksignal
🎯 Price Action & Market Structure
📚 Trading Education & Market Insights
Pubblicazioni correlate
Declinazione di responsabilità
Le informazioni e le pubblicazioni non sono intese come, e non costituiscono, consulenza o raccomandazioni finanziarie, di investimento, di trading o di altro tipo fornite o approvate da TradingView. Per ulteriori informazioni, consultare i Termini di utilizzo.
✨ Learn • Analyze • Trade
📊 Free Analysis for Crypto • Forex • Gold
t.me/pullbacksignal
🎯 Price Action & Market Structure
📚 Trading Education & Market Insights
📊 Free Analysis for Crypto • Forex • Gold
t.me/pullbacksignal
🎯 Price Action & Market Structure
📚 Trading Education & Market Insights
Pubblicazioni correlate
Declinazione di responsabilità
Le informazioni e le pubblicazioni non sono intese come, e non costituiscono, consulenza o raccomandazioni finanziarie, di investimento, di trading o di altro tipo fornite o approvate da TradingView. Per ulteriori informazioni, consultare i Termini di utilizzo.