
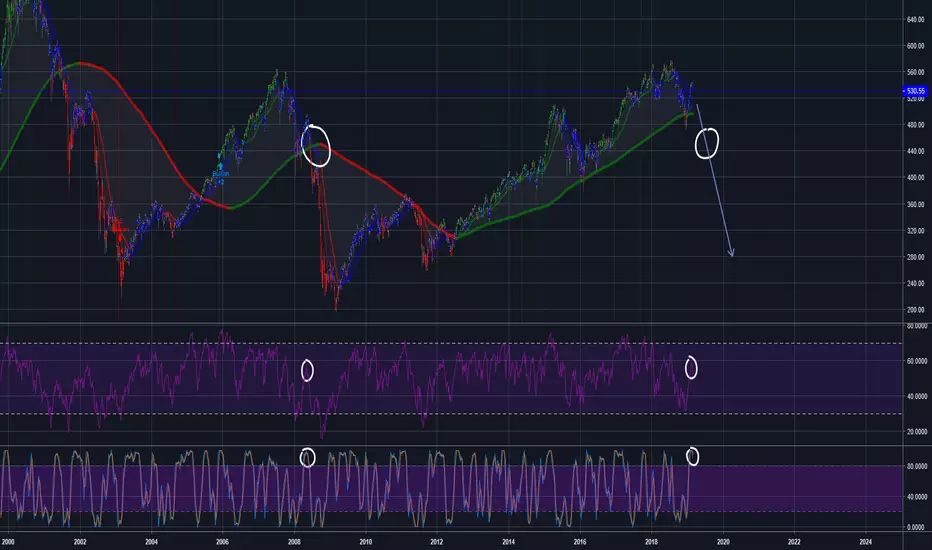
The death cross occurs when a short-term moving average crosses over a major long-term moving average to the downside and is interpreted by analysts and traders as signaling a definitive bear turn in a market.
As we can see it occured in 2008 aswell and the chart and other indicators (RSI and stoch RSI, but also ichimoku cloud and few others) are almost indenticial to when the crash in 2008 happened.
The AEX will take a big hit and may fall to 0.786 fib. level and perhaps lower.
The death cross is a technical chart pattern indicating the potential for a major selloff.
The death cross appears on a chart when a stock’s short-term moving average crosses below its long-term moving average.
The death cross indicator has proven to be a reliable predictor of some of the most severe bear markets of the past century: 1929, 1938, 1974, and 2008
As we can see it occured in 2008 aswell and the chart and other indicators (RSI and stoch RSI, but also ichimoku cloud and few others) are almost indenticial to when the crash in 2008 happened.
The AEX will take a big hit and may fall to 0.786 fib. level and perhaps lower.

Declinazione di responsabilità
Le informazioni e le pubblicazioni non sono intese come, e non costituiscono, consulenza o raccomandazioni finanziarie, di investimento, di trading o di altro tipo fornite o approvate da TradingView. Per ulteriori informazioni, consultare i Termini di utilizzo.
Declinazione di responsabilità
Le informazioni e le pubblicazioni non sono intese come, e non costituiscono, consulenza o raccomandazioni finanziarie, di investimento, di trading o di altro tipo fornite o approvate da TradingView. Per ulteriori informazioni, consultare i Termini di utilizzo.