Short
A Corrective Mess
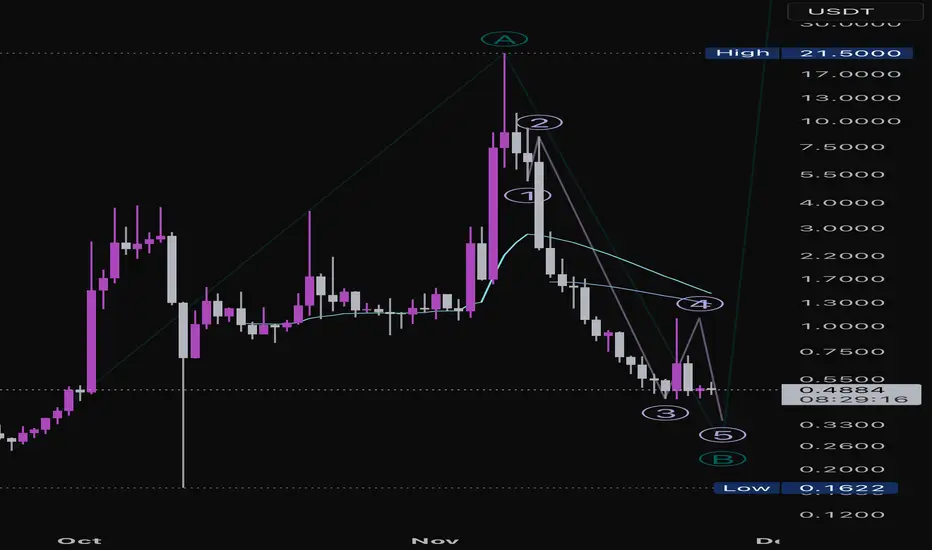
Hard to count this chart as anything but long-term bearish, but my best Elliot interpretation of AIA is that we could be in wave 4 of C of B to the downside. Very short term, we could see another [relatively] small rally to the 1.09-1.3ish area, but volume is low and further downside is expected with or without a C wave up. A break above the intraday high would be a first signal for a C wave, break below 0.439 for larger trend continuation.
Nota
Clarification: very short-term possibility is Wave c of 4, not Wave C of larger ABC count. Standard Fibonacci extension targets if we do get a Wave c of 4 rally: 1.09-1.49
Declinazione di responsabilità
Le informazioni e le pubblicazioni non sono intese come, e non costituiscono, consulenza o raccomandazioni finanziarie, di investimento, di trading o di altro tipo fornite o approvate da TradingView. Per ulteriori informazioni, consultare i Termini di utilizzo.
Declinazione di responsabilità
Le informazioni e le pubblicazioni non sono intese come, e non costituiscono, consulenza o raccomandazioni finanziarie, di investimento, di trading o di altro tipo fornite o approvate da TradingView. Per ulteriori informazioni, consultare i Termini di utilizzo.