Daily chart
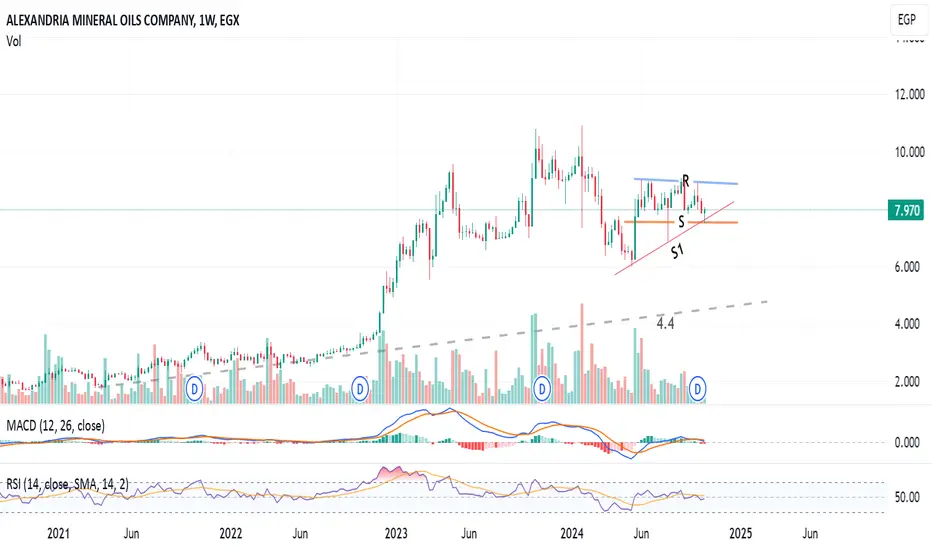
The stock AMOC is trading in a channel between lines R and S, so the opportunity to buy near support S and sell near resistance line R (at around 8.9)
Technical indicators RSI and MACD are supporting the bullish view.
Closing above 9.0 for 3 days, the target will be 10.5
Closing above 10.9 for 2 weeks, the target will be 12
Below line S is considered a stop loss level, as the next down target will be 6.0
Note: Always keep a profit protection level, and raise it as the price goes up.
The stock
AMOC is trading in a channel between lines R and S, so the opportunity to buy near support S and sell near resistance line R (at around 8.9)Technical indicators RSI and MACD are supporting the bullish view.
Closing above 9.0 for 3 days, the target will be 10.5
Closing above 10.9 for 2 weeks, the target will be 12
Below line S is considered a stop loss level, as the next down target will be 6.0
Note: Always keep a profit protection level, and raise it as the price goes up.

Declinazione di responsabilità
Le informazioni e le pubblicazioni non sono intese come, e non costituiscono, consulenza o raccomandazioni finanziarie, di investimento, di trading o di altro tipo fornite o approvate da TradingView. Per ulteriori informazioni, consultare i Termini di utilizzo.
Declinazione di responsabilità
Le informazioni e le pubblicazioni non sono intese come, e non costituiscono, consulenza o raccomandazioni finanziarie, di investimento, di trading o di altro tipo fornite o approvate da TradingView. Per ulteriori informazioni, consultare i Termini di utilizzo.