
Hello?
Dear traders, nice to meet you.
"Like" is a huge force for me.
By "following" you can always get new information quickly.
Thank you for always supporting me.
-------------------------------------------------- -----
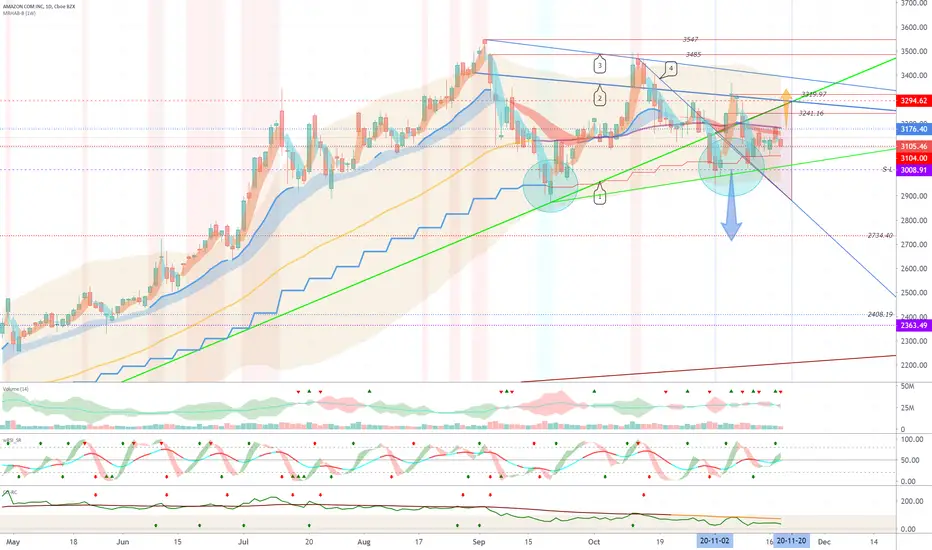
You should watch for any movement that deviates from the 3104.0-3176.40 segment.
If it rises with support from the 3008.91 slowdown, it is likely to rise above the 3294.62 floor, but if it falls, it could fall below the 2734.40 point.
Therefore, this is the point where careful trading is required.
------------------------
(DJI 1D chart)

It started with the gap (29783.4-29875.4) rising and closed at -1.16%.
If you drop from the 29467.9 point, you can touch the 28989.7 point.
------------------------
(IXIC 1D chart)

It started with the fall of the gap (11899.3-11896.1) and closed at -0.82%.
If you decline from the uptrend line (2), you can touch the 11458.1 point.
-----------------------------
(SPX 1D chart)

It started with the gap (3609.5-3612.1) rising and closed at -1.16%.
-----------------------------
(GOLD 1D chart)

It started with a drop in the gap (25.37-25.24) and closed at -3.59%.
If you fall from the 24.37 point and the downtrend line, you can touch below the 22.35 point.
-------------------------------
(XAUUSD 1D chart)

If you drop from 1855.5, you can touch 1803.382.
We have to see if we can quickly ascend above 1871.828 points.
-------------------------------------------------- -------------------------------------------
** Check support, resistance, and abbreviation points.
** Support or resistance is based on the closing price of the 1D chart.
** All explanations are for reference only and do not guarantee profit or loss on investment.
Explanation of abbreviations displayed on the chart
R: A point or section of resistance that requires a response to preserve profits
S-L: Stop-Loss point or section
S: A point or segment that can be bought for profit generation as a support point or segment
(Short-term Stop Loss can be said to be a point where profits and losses can be preserved or additionally entered through installment trading. You should trade from a short-term investment perspective.)
GAP refers to the difference in prices that occurred when the stock market, CME and BAKKT exchanges were closed because they do not trade 24 hours a day.
G1: Closed price
G2: Market price at the time of opening
Dear traders, nice to meet you.
"Like" is a huge force for me.
By "following" you can always get new information quickly.
Thank you for always supporting me.
-------------------------------------------------- -----
You should watch for any movement that deviates from the 3104.0-3176.40 segment.
If it rises with support from the 3008.91 slowdown, it is likely to rise above the 3294.62 floor, but if it falls, it could fall below the 2734.40 point.
Therefore, this is the point where careful trading is required.
------------------------
(DJI 1D chart)
It started with the gap (29783.4-29875.4) rising and closed at -1.16%.
If you drop from the 29467.9 point, you can touch the 28989.7 point.
------------------------
(IXIC 1D chart)
It started with the fall of the gap (11899.3-11896.1) and closed at -0.82%.
If you decline from the uptrend line (2), you can touch the 11458.1 point.
-----------------------------
(SPX 1D chart)
It started with the gap (3609.5-3612.1) rising and closed at -1.16%.
-----------------------------
(GOLD 1D chart)
It started with a drop in the gap (25.37-25.24) and closed at -3.59%.
If you fall from the 24.37 point and the downtrend line, you can touch below the 22.35 point.
-------------------------------
(XAUUSD 1D chart)
If you drop from 1855.5, you can touch 1803.382.
We have to see if we can quickly ascend above 1871.828 points.
-------------------------------------------------- -------------------------------------------
** Check support, resistance, and abbreviation points.
** Support or resistance is based on the closing price of the 1D chart.
** All explanations are for reference only and do not guarantee profit or loss on investment.
Explanation of abbreviations displayed on the chart
R: A point or section of resistance that requires a response to preserve profits
S-L: Stop-Loss point or section
S: A point or segment that can be bought for profit generation as a support point or segment
(Short-term Stop Loss can be said to be a point where profits and losses can be preserved or additionally entered through installment trading. You should trade from a short-term investment perspective.)
GAP refers to the difference in prices that occurred when the stock market, CME and BAKKT exchanges were closed because they do not trade 24 hours a day.
G1: Closed price
G2: Market price at the time of opening
Nota
(NIO 1D chart)If it falls from the uptrend line (1) and at 44.56, it is a short-term Stop Loss.
We have to see if we can get support and rebound in the 37.71-39.75 range.
Nota
(GE 1D chart)It started with an increase in the gap (9.68-9.97) and closed at 0.52%.
We need to make sure we can get support at 9.77.
If you go down from 9.43, you can touch 8.71.
Nota
(TSLA 1D chart)It started with the gap (441.61-448.35) rising and closed at 10.20%.
It remains to be seen if it can gain support and rise at the uptrend line (2) and at 475.05.
If you go down from the 475.05 point, you can touch the 429.01 point, so this is the point that requires careful trading.
If it rises along the uptrend line (2), it is expected to update the New High.
Nota
(FORD (F) 1D chart)It started with the gap (8.75-8.82) rising and closed at 0.80%.
We have to get support at 8.80 and see if we can climb above 9.68.
If you move down from the 8.46 point, there is a possibility that it will fall below the downtrend line (3), so trade carefully.
Nota
(AAPL 1D chart)It started with the gap (119.39-118.61) falling and closed at -1.14%.
You need to see if you can quickly ascend to the 119.21 point.
You'll also need to see if you can climb over 120.96 points.
We need to see if we can get support at the downtrend line (4) and (5), and move up along the uptrend line (2).
If it falls, it is expected to fall below the 106.84 point.
Nota
(PFE 1D chart)It started with the gap (36.04-36.93) rising and ended at 0.78%.
You need to make sure you can get support at 36.36.
If you fall from the 36.36 point, you can touch the 33.50 point, so you need to trade carefully.
It is off the downtrend line (2), so if it is supported at 36.36, it is expected to rise above 38.50.
We must see if we can break above the uptrend line (3) and the downtrend line (4).

YouTube: youtube.com/@readcrypto9837
※ Follow X to check out the posts.
※ X를 팔로우하고 게시물을 확인하세요.
◆ t.me/readCryptoChannel
[HA-MS Indicator]
bit.ly/3YxHgvN
[OBV Indicator]
bit.ly/4dcyny3
※ Follow X to check out the posts.
※ X를 팔로우하고 게시물을 확인하세요.
◆ t.me/readCryptoChannel
[HA-MS Indicator]
bit.ly/3YxHgvN
[OBV Indicator]
bit.ly/4dcyny3
Pubblicazioni correlate
Declinazione di responsabilità
Le informazioni e le pubblicazioni non sono intese come, e non costituiscono, consulenza o raccomandazioni finanziarie, di investimento, di trading o di altro tipo fornite o approvate da TradingView. Per ulteriori informazioni, consultare i Termini di utilizzo.
YouTube: youtube.com/@readcrypto9837
※ Follow X to check out the posts.
※ X를 팔로우하고 게시물을 확인하세요.
◆ t.me/readCryptoChannel
[HA-MS Indicator]
bit.ly/3YxHgvN
[OBV Indicator]
bit.ly/4dcyny3
※ Follow X to check out the posts.
※ X를 팔로우하고 게시물을 확인하세요.
◆ t.me/readCryptoChannel
[HA-MS Indicator]
bit.ly/3YxHgvN
[OBV Indicator]
bit.ly/4dcyny3
Pubblicazioni correlate
Declinazione di responsabilità
Le informazioni e le pubblicazioni non sono intese come, e non costituiscono, consulenza o raccomandazioni finanziarie, di investimento, di trading o di altro tipo fornite o approvate da TradingView. Per ulteriori informazioni, consultare i Termini di utilizzo.