
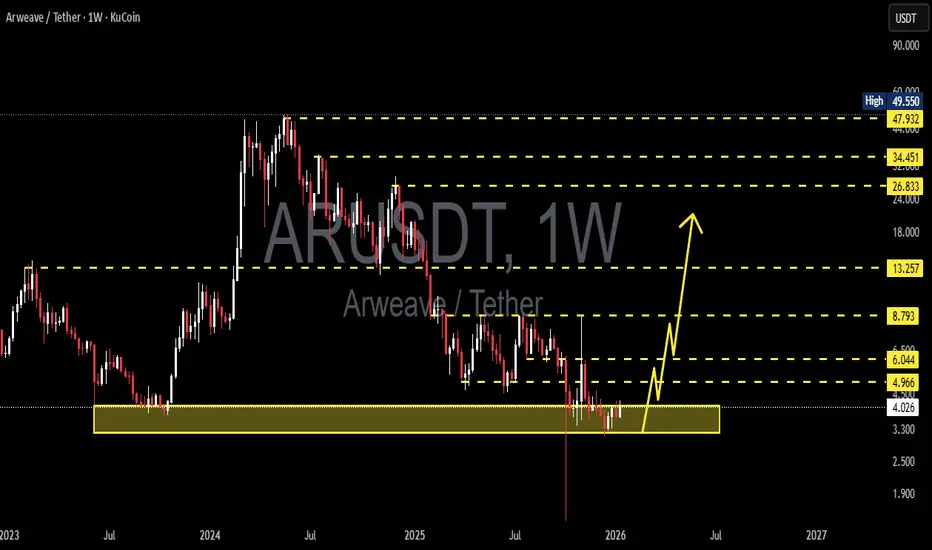
AR/USDT is currently trading on the Weekly (1W) timeframe and is testing a very critical historical demand zone at 4.03 – 3.20 USDT (highlighted by the yellow box). This area represents a previous accumulation base before a major bullish impulse, making it a highly significant technical level.
After failing to maintain its mid-term bullish structure, price has formed a clear downtrend (lower highs – lower lows) and is now approaching a long-term decision point.
---
Key Levels
Major Support (Demand Zone):
4.03 – 3.20 USDT → Strong historical demand & accumulation zone
Resistance / Layered Supply Zones:
4.96 – 6.04 USDT → Minor resistance / pullback zone
8.79 USDT → Previous breakdown support
13.25 USDT → Weekly key resistance
26.83 USDT → Mid-cycle resistance
34.45 USDT → Major supply zone
47.93 – 49.55 USDT → Macro top resistance
---
Pattern & Market Structure Explanation
Primary Trend: Bearish (Lower High & Lower Low)
Market Phase: Late downtrend / potential accumulation
Observed Pattern:
Falling structure into a major demand zone
Indication of potential Wyckoff Accumulation Phase A–B, if price holds above demand
Candle Behavior:
Strong rejection wicks below demand indicate early buyer interest
However, there is no confirmed weekly bullish reversal candle yet
---
Bullish Scenario
The bullish scenario is valid only if:
1. Price holds above 3.20 USDT
2. A weekly higher low is formed
3. Strong break and weekly close above 4.96 – 6.04 USDT
Bullish Step-by-Step Targets:
6.04 USDT → Initial reversal validation
8.79 USDT → Key resistance
13.25 USDT → Trend reversal confirmation
26.83 USDT → Mid-cycle bullish expansion
34.45 USDT → Major distribution zone
This bullish bias represents a long-term accumulation opportunity, not a short-term scalp setup.
---
Bearish Scenario
The bearish scenario occurs if:
1. A valid weekly close below 3.20 USDT
2. The demand zone fails to absorb selling pressure
3. There is no impulsive bullish reaction from the yellow zone
Bearish Implications:
Demand breakdown → downside price discovery
Potential continuation targets:
2.50 USDT
1.90 USDT
Possible retest of the all-time base
In this case, the structure shifts into a macro bearish continuation, not merely a correction.
---
Conclusion
The 4.03 – 3.20 USDT zone is a make-or-break level for AR/USDT’s long-term structure.
Holding and reclaiming resistance → potential major trend reversal
Weekly breakdown below demand → bearish continuation
Price is currently in a decision zone, not an area for aggressive entries without confirmation.
#ARUSDT #Arweave #CryptoAnalysis #TechnicalAnalysis #WeeklyChart #DemandZone #SupportResistance #MarketStructure #TrendReversal #LongTermSetup
After failing to maintain its mid-term bullish structure, price has formed a clear downtrend (lower highs – lower lows) and is now approaching a long-term decision point.
---
Key Levels
Major Support (Demand Zone):
4.03 – 3.20 USDT → Strong historical demand & accumulation zone
Resistance / Layered Supply Zones:
4.96 – 6.04 USDT → Minor resistance / pullback zone
8.79 USDT → Previous breakdown support
13.25 USDT → Weekly key resistance
26.83 USDT → Mid-cycle resistance
34.45 USDT → Major supply zone
47.93 – 49.55 USDT → Macro top resistance
---
Pattern & Market Structure Explanation
Primary Trend: Bearish (Lower High & Lower Low)
Market Phase: Late downtrend / potential accumulation
Observed Pattern:
Falling structure into a major demand zone
Indication of potential Wyckoff Accumulation Phase A–B, if price holds above demand
Candle Behavior:
Strong rejection wicks below demand indicate early buyer interest
However, there is no confirmed weekly bullish reversal candle yet
---
Bullish Scenario
The bullish scenario is valid only if:
1. Price holds above 3.20 USDT
2. A weekly higher low is formed
3. Strong break and weekly close above 4.96 – 6.04 USDT
Bullish Step-by-Step Targets:
6.04 USDT → Initial reversal validation
8.79 USDT → Key resistance
13.25 USDT → Trend reversal confirmation
26.83 USDT → Mid-cycle bullish expansion
34.45 USDT → Major distribution zone
This bullish bias represents a long-term accumulation opportunity, not a short-term scalp setup.
---
Bearish Scenario
The bearish scenario occurs if:
1. A valid weekly close below 3.20 USDT
2. The demand zone fails to absorb selling pressure
3. There is no impulsive bullish reaction from the yellow zone
Bearish Implications:
Demand breakdown → downside price discovery
Potential continuation targets:
2.50 USDT
1.90 USDT
Possible retest of the all-time base
In this case, the structure shifts into a macro bearish continuation, not merely a correction.
---
Conclusion
The 4.03 – 3.20 USDT zone is a make-or-break level for AR/USDT’s long-term structure.
Holding and reclaiming resistance → potential major trend reversal
Weekly breakdown below demand → bearish continuation
Price is currently in a decision zone, not an area for aggressive entries without confirmation.
#ARUSDT #Arweave #CryptoAnalysis #TechnicalAnalysis #WeeklyChart #DemandZone #SupportResistance #MarketStructure #TrendReversal #LongTermSetup

✅ Get Free Signals! Join Our Telegram Channel Here: t.me/TheCryptoNuclear
✅ Twitter: twitter.com/crypto_nuclear
✅ Join Bybit : partner.bybit.com/b/nuclearvip
✅ Benefits : Lifetime Trading Fee Discount -50%
✅ Twitter: twitter.com/crypto_nuclear
✅ Join Bybit : partner.bybit.com/b/nuclearvip
✅ Benefits : Lifetime Trading Fee Discount -50%
Declinazione di responsabilità
Le informazioni e le pubblicazioni non sono intese come, e non costituiscono, consulenza o raccomandazioni finanziarie, di investimento, di trading o di altro tipo fornite o approvate da TradingView. Per ulteriori informazioni, consultare i Termini di utilizzo.
✅ Get Free Signals! Join Our Telegram Channel Here: t.me/TheCryptoNuclear
✅ Twitter: twitter.com/crypto_nuclear
✅ Join Bybit : partner.bybit.com/b/nuclearvip
✅ Benefits : Lifetime Trading Fee Discount -50%
✅ Twitter: twitter.com/crypto_nuclear
✅ Join Bybit : partner.bybit.com/b/nuclearvip
✅ Benefits : Lifetime Trading Fee Discount -50%
Declinazione di responsabilità
Le informazioni e le pubblicazioni non sono intese come, e non costituiscono, consulenza o raccomandazioni finanziarie, di investimento, di trading o di altro tipo fornite o approvate da TradingView. Per ulteriori informazioni, consultare i Termini di utilizzo.