
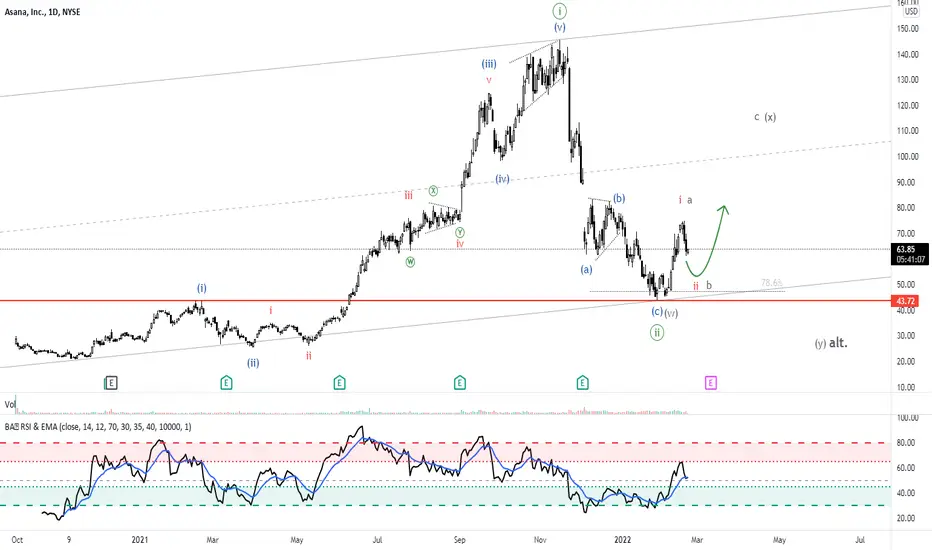
Asana demonstrates a classic Elliott wave analysis model.
There is a classic upward impulse and a correction in the form of an ABC zigzag, where B is triangle.
Now we have 5 wave upward impulse after the zigzag, which after ATH fell from the price of 145.3 to the level of 43.77, almost touching the strong support level of the top of wave .
I assume that ASAN can go to the 3rd wave with extension, but it's possible also get situation with more complicated correction in the form of WXY as double zigzag.
So, for a short-term trading there is a good opportunity to trade at least wave b of the zigzag as alt. scenario.

Declinazione di responsabilità
Le informazioni e le pubblicazioni non sono intese come, e non costituiscono, consulenza o raccomandazioni finanziarie, di investimento, di trading o di altro tipo fornite o approvate da TradingView. Per ulteriori informazioni, consultare i Termini di utilizzo.
Declinazione di responsabilità
Le informazioni e le pubblicazioni non sono intese come, e non costituiscono, consulenza o raccomandazioni finanziarie, di investimento, di trading o di altro tipo fornite o approvate da TradingView. Per ulteriori informazioni, consultare i Termini di utilizzo.