
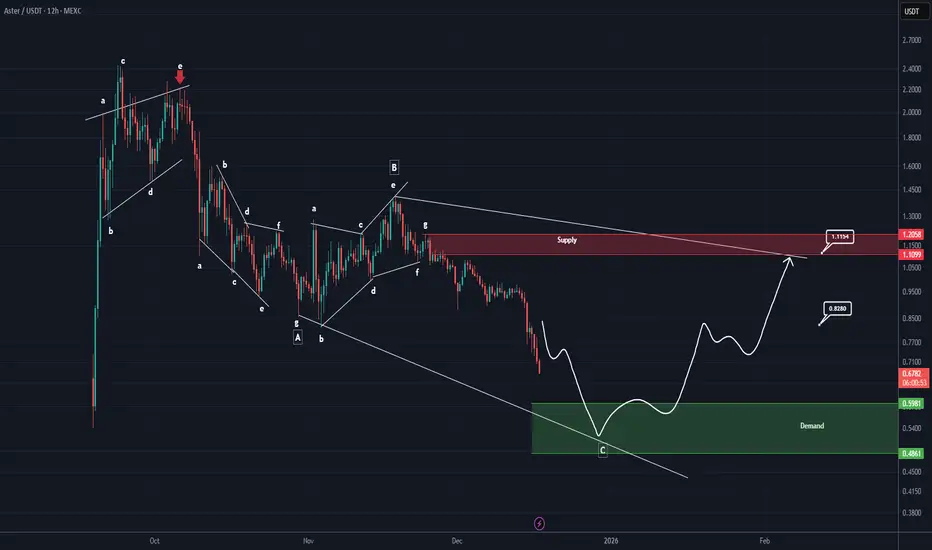
Based on the current candlestick data for ASTER, it appears to be forming an expanding pattern.
This pattern formed from the point where we placed the red arrow on the chart.
Wave C of this expanding pattern is expected to complete within the green zone. The green zone is an optimal higher-timeframe support area, such as the daily timeframe.
If the price reaches the green zone, we will look for buy or long positions.
The targets for this position are marked on the chart.
Let’s see what happens.
For risk management, please don't forget stop loss and capital management
When we reach the first target, save some profit and then change the stop to entry
Comment if you have any questions
Thank You
Trade attivo
Since the analysis, it dropped more than 33% and reacted upon hitting the green zone. So far, it has recovered about 14%
✅ Join our Telegram channel to succeed in trading.
💎Our CRYPTO Telegram Channel: 👉 t.me/Behdark_EN
💎Our FOREX Telegram Channel: 👉 t.me/FX_Behdark
💎Our CRYPTO Telegram Channel: 👉 t.me/Behdark_EN
💎Our FOREX Telegram Channel: 👉 t.me/FX_Behdark
Declinazione di responsabilità
Le informazioni e le pubblicazioni non sono intese come, e non costituiscono, consulenza o raccomandazioni finanziarie, di investimento, di trading o di altro tipo fornite o approvate da TradingView. Per ulteriori informazioni, consultare i Termini di utilizzo.